


A pullback is simply a temporary price dip in a market that's otherwise trending upwards. If the market is in a downtrend, a pullback would be a brief price rally.
Think of it like a marathon runner taking a quick water break. They aren't quitting the race; they're just pausing for a moment before continuing on. For traders, that pause can be a golden opportunity to join a strong trend at a better price.

Let's say you're watching a stock that's been on a tear, climbing steadily for weeks. That climb is what we call the primary trend. A pullback is when the price briefly falls, moving against that main trend, before—ideally—resuming its climb.
This kind of counter-move is perfectly normal. In fact, it's a sign of a healthy market. It's usually caused by traders who got in early deciding to cash out and take some profits, which creates a bit of selling pressure.
For anyone who missed the initial move, this dip is like a sale. It offers a chance to buy into a strong asset at a discount before it takes off again.
Here's where it gets tricky, and where many traders get burned. You have to be able to tell the difference between a minor pullback and a full-blown trend reversal.
A reversal is a complete change in market direction. The old trend dies, and a new one starts moving the other way. If you mistake a reversal for a simple pullback and buy the dip, you could be facing some serious losses.
The whole point of trading a pullback is to ride the market's natural rhythm. You spot the pause, get in, and catch the next wave of the main trend.
Getting this right isn't just theory; it's the bedrock of any successful trend-following strategy. To make it clearer, let's break down the key differences.
The table below gives you a quick side-by-side comparison to help you distinguish between a temporary dip and a permanent shift.
Ultimately, a pullback is an opportunity born from the market taking a breather. Spotting one requires a sharp eye for the underlying trend's strength and a respect for the fact that prices never move in a straight line.
Now, let's get into the nitty-gritty of how to spot a healthy pullback and the actual strategies you can use to trade them.
Not all dips are created equal. Far from it. Some are golden opportunities, the market practically begging you to buy in. Others are traps, ready to snap shut on anyone who bites. Learning to tell the difference is what separates consistently profitable traders from the rest.
Think of it like a doctor checking a patient's vital signs. You need to look for specific characteristics that signal the trend is strong and just taking a breather, not on its deathbed. A healthy pullback is a temporary, low-drama pause within a bigger, more powerful move. The key is that the underlying trend is still very much alive.
One of the first and most reliable signs I look for is declining trading volume. Let’s picture a stock that's been rocketing up on huge volume—a clear sign of widespread excitement. Then, the price starts to ease back, but the volume just dries up.
This is a classic "tell." It suggests the selling pressure is weak, almost half-hearted. The big players, the "smart money," aren't dumping their shares; they're likely just holding on, waiting for the next leg up. It’s the absence of panic that makes this dip feel safe.
A price drop on low volume is a good sign. It often means the sellers lack any real conviction, and the underlying bullish (or bearish) trend is still in charge.
On the flip side, if a pullback happens on increasing volume, that's a huge red flag. It tells you sellers are piling in with force, and what looks like a small dip could be the opening act of a full-blown reversal.
Another vital sign is how the pullback behaves around key technical levels. These are the lines in the sand, the zones on a chart where buyers are expected to show up and defend the trend. A pullback that neatly bounces off one of these zones is showing its strength.
Two of my go-to tools for spotting these areas are Moving Averages and Fibonacci Retracement levels.
When a stock pulls back to one of these well-known levels and holds firm, it’s a strong confirmation that the trend is still in the driver's seat. But if the price just slices through these levels like they're not even there, it's a clear warning of deeper problems.
Finally, look at the personality of the pullback itself. Is it a gradual, lazy drift downward, or is it a sharp, violent plunge?
A healthy pullback is usually pretty shallow and orderly. It looks more like a gentle slope or a sideways grind than a cliff dive. This calm, controlled price action tells you there’s no panic—just some routine profit-taking before the next move.
In contrast, a sharp, V-shaped drop with long, nasty-looking red candles screams fear. That kind of aggressive selling is way more typical of a trend reversal than a simple pause. By looking at the volume, the key levels, and the overall feel of the price action, you can get a really clear picture of whether you're looking at a genuine opportunity or a signal to stay far away.
Okay, let's move from theory to the real world of charts. This is where the rubber meets the road. Spotting a pullback isn't about some secret formula; it’s a skill you build by watching price action and understanding the market's rhythm. The idea is to develop a simple, repeatable process to find these high-probability moments as they happen.
What you're really looking for is a specific sequence of events. You need to see a clear trend, watch for the counter-move, and then patiently wait for the signal that the original trend is kicking back in.
First things first: you can't have a pullback without a trend. This is the absolute foundation. A pullback is meaningless if the market is just chopping sideways or heading in the opposite direction.
For an uptrend, you need to see a clear pattern of higher highs and higher lows. Think of it as a staircase climbing up. Each price peak is higher than the last one, and every dip finds its footing at a higher level than the previous dip. That structure is what bullish strength looks like on a chart.
On the flip side, a downtrend is a series of lower lows and lower highs—a staircase heading down. Each new price drop breaks the prior low, and any rally that follows is weak, failing to get above the previous peak. Trying to "buy the dip" in a market that's clearly making lower lows is a quick way to get yourself into trouble.
A simple upward-sloping trendline connecting the lows of an uptrend can be a surprisingly powerful visual aid. As long as the price respects that line, you can consider the uptrend to be healthy.
Once you've confirmed the trend, the next question is, where might this pullback stop? Prices don’t just turn around randomly. They tend to find support at predictable technical levels where buyers are likely waiting to step in.
Think of these as logical "rest stops" for the price. Some of the most common spots include:
This image breaks down the simple three-step process for spotting a potential pullback, from finding the trend to getting your confirmation.
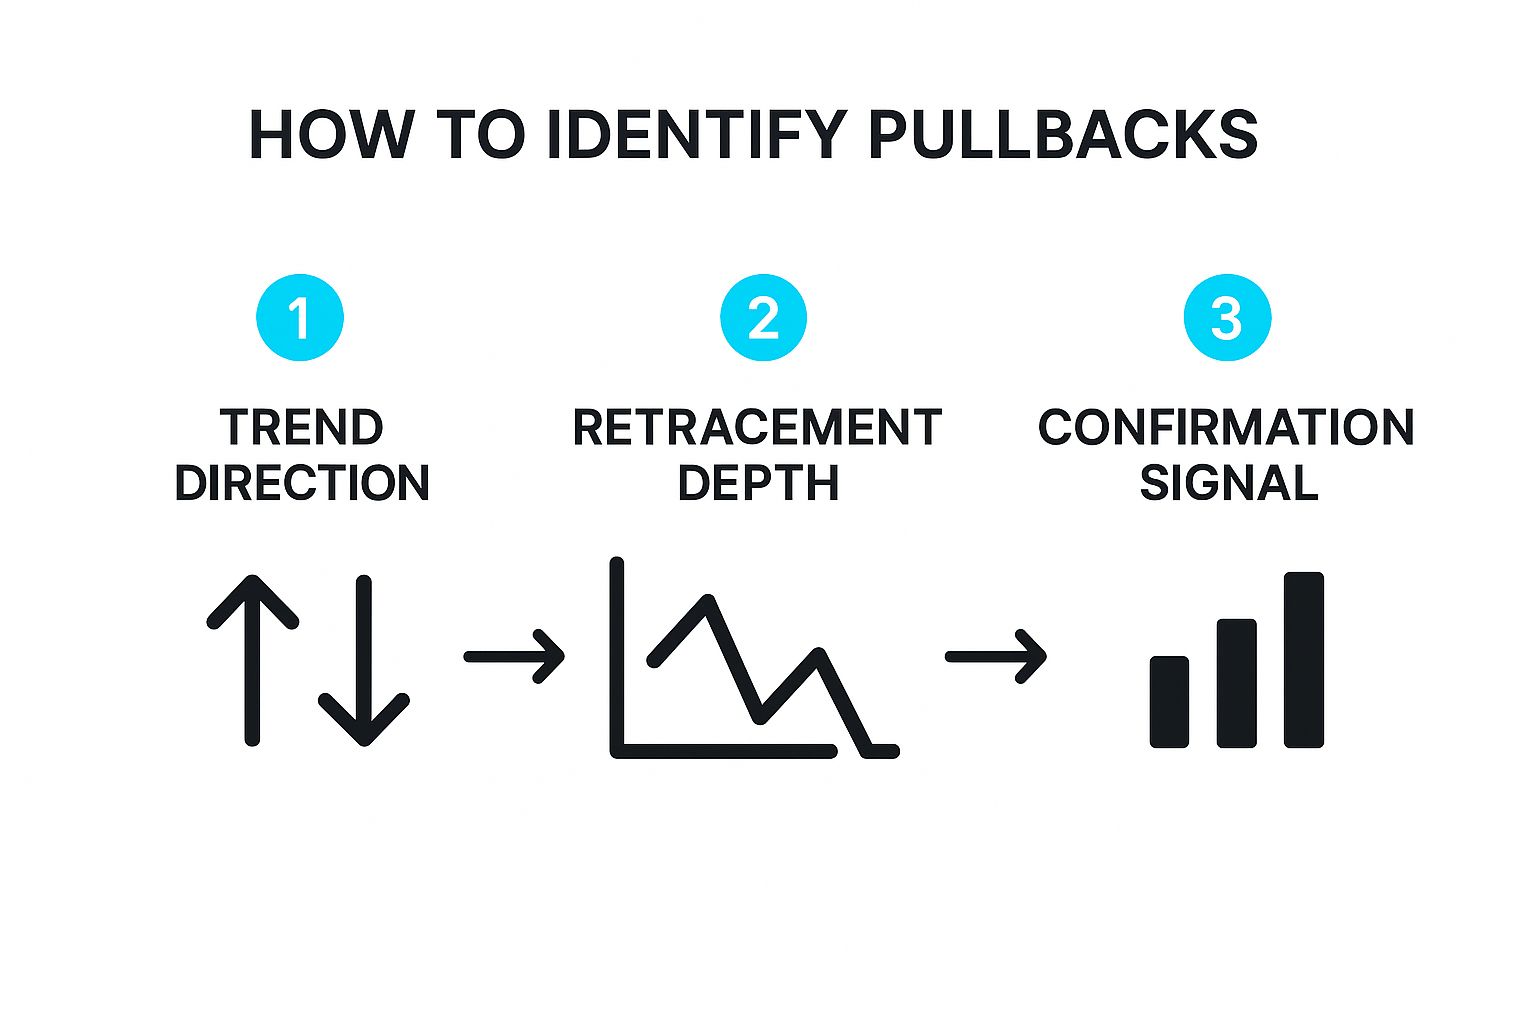
As you can see, it’s a sequence. First, identify the market's direction. Second, measure the retracement. And third, wait for a clear signal before you even think about clicking the buy button.
While price action is always the most important thing, a few indicators can add some serious weight to your analysis. One of the best tools for measuring the depth of a pullback is the Fibonacci retracement. To get the hang of it, check out our guide on how to draw Fibonacci retracements the right way.
This tool helps you see how far the price has pulled back as a percentage of its last major move. Pullbacks very often find support at key Fibonacci levels like 38.2%, 50%, and the "golden pocket" area between 61.8% and 65%. When the price stalls out right at one of these levels, it’s another piece of the puzzle suggesting buyers are waking up.
This last step is the most important, and honestly, the hardest. It requires real discipline. Just because the price has touched a support level doesn’t mean it's time to jump in. You have to wait for a confirmation signal—proof that the pullback is actually over and the main trend is ready to go again.
What does that proof look like? It can show up in a few ways:
Patience is everything here. So many traders lose money because they get impatient and buy too early, before the buyers have really proven they're back in control. Remember, pullbacks are a normal and healthy part of any market. In fact, between 2002 and 2021, a market drop of 10% or more happened in about half of those years. That just goes to show you how common these opportunities really are.

Spotting a pullback is one thing, but actually making money from it is a whole different ball game. To turn that chart observation into a profitable trade, you need a solid plan. A plan with clear rules for when to get in, when to get out, and how to manage your risk. Anything less is just guesswork.
Let's break down three distinct, battle-tested methods for trading pullbacks. Each one uses a different tool, but they all share the same core idea: buy on weakness during a strong trend. These aren't just theories; they're complete frameworks you can start using right away.
Moving averages are a trader's best friend for a reason—they just work. When a stock is trending, a key moving average often acts like a dynamic floor (in an uptrend) or ceiling (in a downtrend). This strategy is all about timing your entry for when the price pulls back and "bounces" off this moving level of support.
The Game Plan:
This method is so powerful because it's clean and visual. It keeps you aligned with the market's momentum and gives you a crystal-clear spot to define your risk.
The real magic of the moving average bounce is in its timing. You're aiming to catch the exact moment that big institutional players, who often use these same levels, step in to defend the trend.
The Fibonacci retracement tool is fantastic for figuring out just how deep a pullback might go. It measures the size of the counter-move relative to the main impulse wave of the trend. This strategy hones in on specific Fibonacci levels where the market has a high statistical probability of turning back around.
The Game Plan:
This technique is more precise than many others and often leads to some excellent risk-to-reward setups. It works especially well in markets that tend to move in clean, rhythmic waves.
Sometimes, the simplest tools are the most powerful. A simple, well-drawn trendline can be an incredibly reliable guide and a perfect place to look for entry points during a pullback in trading.
The whole strategy is built on a simple principle: a valid trendline should act as support. The more times it's been tested and has held firm, the more significant it becomes to other traders.
The Game Plan:
This timeless technique helps you literally see the trend's strength on your chart and gives you a logical, common-sense entry point based on classic market structure.
To help you decide which approach might fit your style, here’s a quick summary of the strategies we've just covered. Each has its own place and time.
Ultimately, the best strategy is the one that you understand deeply and can execute consistently. Try them out on a demo account and see which one resonates with you and the markets you trade.

Trading a pullback feels great when it works, but what happens when it doesn't? The single biggest danger is mistaking a real trend reversal for a simple dip. Get that wrong, and you're in a world of hurt.
This is where your financial survival skills kick in. Solid risk management isn't just a nice-to-have; it's the only thing that separates professional traders from gamblers. Without it, even a winning strategy will eventually blow up your account. Your goal is simple: protect your capital so you can live to trade another day.
Before you even think about clicking "buy," you need a rock-solid plan for what you'll do if the trade goes south. This isn't something you figure out on the fly. It’s a set of hard rules you follow with total discipline, every single time.
Here are the core principles you can't afford to break:
Risk management is your business plan for trading. It dictates how you handle losses, protect profits, and ensure your long-term viability in the markets. Ignoring it is planning to fail.
The charts are only half the battle. Your own mind can be your worst enemy, especially when a trade starts to turn against you. A pullback in trading is a perfect setup to trigger emotional decisions that cost you money.
Knowing these mental traps is the first step to sidestepping them.
History shows us just how brutal mismanaged pullbacks can be. During the major market drops of 2008, 2018, 2020, and 2022, traders without a plan got crushed. While 2008 was a massive systemic crisis, the 2020 crash actually caused the most severe ratio of losses for certain option-selling strategies, proving how critical a solid exit plan is.
By mastering these defensive tactics, you build the discipline needed to navigate the market's inherent uncertainty. To go even deeper, check out our complete guide on risk management for traders.
If you want to trade pullbacks well, you need perspective. Not every dip is the same, and knowing the difference between a small price drop and the start of a potential market crash is what separates successful traders from the rest.
Think of it like this: a minor dip in a strong bull run is a completely different animal than a widespread panic sell-off. Categorizing these pullbacks gives you a mental framework to assess risk and act accordingly. It’s like checking the weather—a light shower doesn't require the same preparation as a hurricane warning.
In the trading world, we generally group pullbacks into three buckets based on how far the price has fallen from its most recent high. Each level tells you something about the market's mood and how you should adjust your game plan.
Minor Pullback (5-10% Drop): This is your garden-variety dip. It's the market taking a quick breather, usually caused by traders taking some profits off the table. These are healthy, happen all the time, and are often the bread and butter for trend-following traders.
Market Correction (10-20% Drop): Okay, this one is more serious. A drop of this size signals that real concern is starting to creep into the market. Corrections can be sharp and scary, but more often than not, the primary trend eventually resumes. You just need to be more patient and wait for confirmation before jumping in.
Bear Market (20%+ Drop): This is the big one. A sustained decline of this magnitude means a major shift in market psychology has occurred. When you're down 20% or more, you’re officially in a bear market. Strategies here flip from "buying the dip" to protecting your capital or even looking for opportunities to short the market.
Knowing what kind of environment you’re in is everything. If you try to trade a 15% correction using the same tactics you’d use for a minor pullback, you're likely going to get chopped up as a support level after support level fails to hold.
History teaches us a powerful lesson: markets are surprisingly resilient. While big downturns feel like the end of the world when they're happening, they've always, always been followed by strong recoveries. Keeping that in mind is crucial for staying disciplined when everyone else is panicking.
The greatest opportunities are often born from the greatest fear. Knowing that major market declines are rare and eventually recover helps build the mental toughness you need to act when others are frozen.
The bigger the pullback, the rarer it is. Declines of 30% or more are significant, historic events. In fact, since the 1950s, the S&P 500 has only fallen by more than 30% on six occasions. While these drops were painful, they were also followed by some of the most powerful bull runs in history, as you can see from looking at historical S&P 500 percentage declines.
Even experienced traders have questions when a pullback starts unfolding on a live chart. Here are some of the most common ones, with straight-to-the-point answers to help you trade with more confidence.
There's no magic answer here—it all boils down to your personal trading style. A long-term investor might track a pullback developing over several months on a weekly chart. On the other hand, a day trader is hunting for small dips on a 5-minute chart that play out in under an hour.
The most important thing is to stay consistent. If you spot the main trend on a daily chart, you should be looking for pullback entries on that same chart or maybe a slightly lower one, like the 4-hour. Trying to match a weekly trend with a 1-minute entry is a recipe for disaster; you’ll just get tangled in conflicting signals.
While it’s not an exact science, a healthy pullback typically gives back just a portion of the prior move. Many traders lean on Fibonacci retracement levels to get their bearings.
A huge red flag is a pullback that slices deeper than the 78.6% level. At that point, you have to seriously consider that it's not a pause—it's the start of a full-blown trend reversal. It's time to be very cautious.
This is the million-dollar question and the biggest risk we face when trying to buy a dip. The answer isn't in a crystal ball; it's in solid risk management. Before you even think about clicking "buy," you absolutely must know your invalidation point—the price where your trade idea is officially proven wrong.
Your stop-loss should be placed just below the key support level you're trading against. That could be just under the 50 EMA, a tick below the 61.8% Fib level, or on the other side of your trendline. If the price breaks that level, you get out. Period. Taking a small, controlled loss is infinitely better than clinging to a losing trade and hoping it turns around.
Think of it this way: a trendline actually gets stronger with each successful test. The first two points draw the line, but it’s the third touch that really confirms other traders are watching and respecting it too. The fourth, fifth, and even sixth tests can still present great trading opportunities.
But nothing lasts forever. The more often a support or resistance level gets hammered, the more likely it is to eventually break. A well-tested trendline is reliable, but don't get complacent. Always wait for price to show you it's holding before you jump in.


%201.svg)