


Before you even think about indicators or fancy tools, you have to get a feel for the market's pulse. Spotting a trend isn't just about drawing lines on a chart; it's about understanding the story the price is telling you. At its heart, you're trying to figure out the dominant direction—is the market pushing up, sliding down, or just treading water?
This basic skill is your filter. It helps you tune out the daily noise and focus on the real, underlying momentum.
Let's get back to basics. A trend isn't just a squiggly line. It's the visible result of thousands of traders making decisions based on two powerful emotions: greed and fear. Grasping this psychological foundation is your first real step toward seeing trends for what they are and acting on them effectively.
At the end of the day, markets can only do one of three things. Your job is to figure out which one is happening right now, as that sets the stage for every trade you consider.
Trends don’t just happen. They're driven by the collective mindset of the market. Herd mentality is a huge factor here. Once a few key players start buying, others jump on board, creating a feedback loop that pushes prices higher. FOMO (fear of missing out) is a powerful accelerant for an uptrend.
Fear works the same way but in reverse. A single piece of bad news can trigger a wave of panic selling that snowballs into a full-blown downtrend. People rush for the exits, not wanting to be the last one holding the bag. It’s this very human, emotional behavior that creates the clean, predictable patterns we look for on the charts.
Remember, a chart is just a picture of human emotion. An uptrend is a visual of collective optimism. A downtrend is a snapshot of widespread fear.
If you can't tell an uptrend from a choppy, sideways mess, the best tools in the world will only confuse you. They might even cost you money.
Think about it: A buy signal from an indicator like EzAlgo is incredibly powerful when it appears in a market that's already making higher highs and higher lows. It confirms what you're already seeing.
But what if you get that same buy signal while the price is just bouncing around in a tight range? It's far more likely to be a fakeout—just market noise. By first figuring out the "what" (the trend direction) and the "why" (the market sentiment), you build a solid framework for every decision. This simple shift in approach turns you from someone who just reacts to signals into a trader who anticipates the market's next move.
Technical analysis is great for a close-up look at market moves, but it doesn't show you the whole landscape. Let's be honest, the most powerful and long-lasting trends aren't just born from chart patterns. They're usually driven by major shifts in the real economy.
This is where you need to zoom out and look at macroeconomic indicators. Think of them as the engine under the hood—the fundamental forces driving market sentiment and money flow. When an economy is humming along, people spend and invest. When it's struggling, they get cautious. Keeping an eye on these high-level reports gives you critical context that either confirms or calls into question what your charts are telling you.
Two of the biggest reports you'll want to watch are the Gross Domestic Product (GDP) and the Consumer Price Index (CPI). These are like a health check for the entire economy, and their results can dictate market direction for months.
First up is GDP, which measures the total value of everything a country produces. It’s the ultimate economic report card. When GDP is consistently rising, it signals a growing economy, which is fantastic news for corporate profits and usually a green light for the stock market. For example, sustained GDP growth in the US, often between 2-4% annually, has historically gone hand-in-hand with major market uptrends.
Then you have the CPI, which is everyone's go-to metric for inflation. It tracks how much the price of everyday goods and services is changing. If inflation gets too high, it eats away at our purchasing power. This often pressures central banks to raise interest rates, which can put the brakes on an overheated market and sometimes even spark a reversal.
A rising GDP is usually a bullish sign, but a climbing CPI can be a major red flag for investors. The key is to watch the rate of change—sudden spikes or drops are often more telling than the numbers themselves.
Beyond the big two, employment data gives you a real-time pulse on economic strength. Reports like the Non-Farm Payrolls (NFP) in the US, which shows how many jobs were created or lost last month, are huge market movers.
But why does this matter for spotting a trend? A strong job market tells you a few things:
For instance, if you see a string of NFP reports that blow past expectations, it can add serious fuel to a bullish stock market trend, especially for companies that sell directly to consumers. On the flip side, a sudden jump in unemployment claims can be an early warning of an economic slowdown and a potential market downturn.
No single indicator ever tells the whole story. The real skill is learning how to piece it all together. A stellar GDP report is great, but if it's paired with a soaring CPI, it might just signal an unsustainable boom that’s about to hit a wall when the central bank steps in. For a deeper dive, check out this guide on https://www.ezalgo.ai/blog/the-importance-of-economic-indicators-in-forex-trading, which really breaks down how these reports move currency markets.
Think about a scenario like this: GDP growth is grinding to a halt, but inflation is still stubbornly high. That’s a nasty mix called stagflation, and it's a tough environment where both stocks and bonds can get hammered.
By spotting that macroeconomic backdrop early, you can adjust your game plan. Maybe you shift your focus to defensive stocks or assets that tend to do well in inflationary times, like commodities. When you combine this big-picture economic view with your technical analysis, you’re not just trading—you’re building a much smarter, more resilient strategy.
Now that we have the big-picture economic view, it’s time to get our hands dirty and see what the charts are telling us. This is where technical analysis shines—it's the art of using past price action and volume to get a feel for where the market might be heading next.
You don't need to learn dozens of complicated indicators. The key is to master a handful that consistently reveal a trend's real strength and momentum. This is how you move from theory to practice, turning abstract economic data into real, actionable trading ideas by reading the market's psychology right off the price action.
To spot a trend on a chart, you need a solid toolkit. Three of the most reliable and widely used indicators are moving averages, the Relative Strength Index (RSI), and the Moving Average Convergence Divergence (MACD). Each gives you a different but crucial piece of the puzzle.
Moving averages are the foundation. They smooth out the day-to-day price noise into a single, clean line, making it much easier to see the underlying direction. There's a reason everyone watches the 50-day and 200-day moving averages; they are the industry standard for gauging medium-term and long-term market sentiment.
This infographic breaks down the key data points traders monitor to stay ahead of industry shifts.
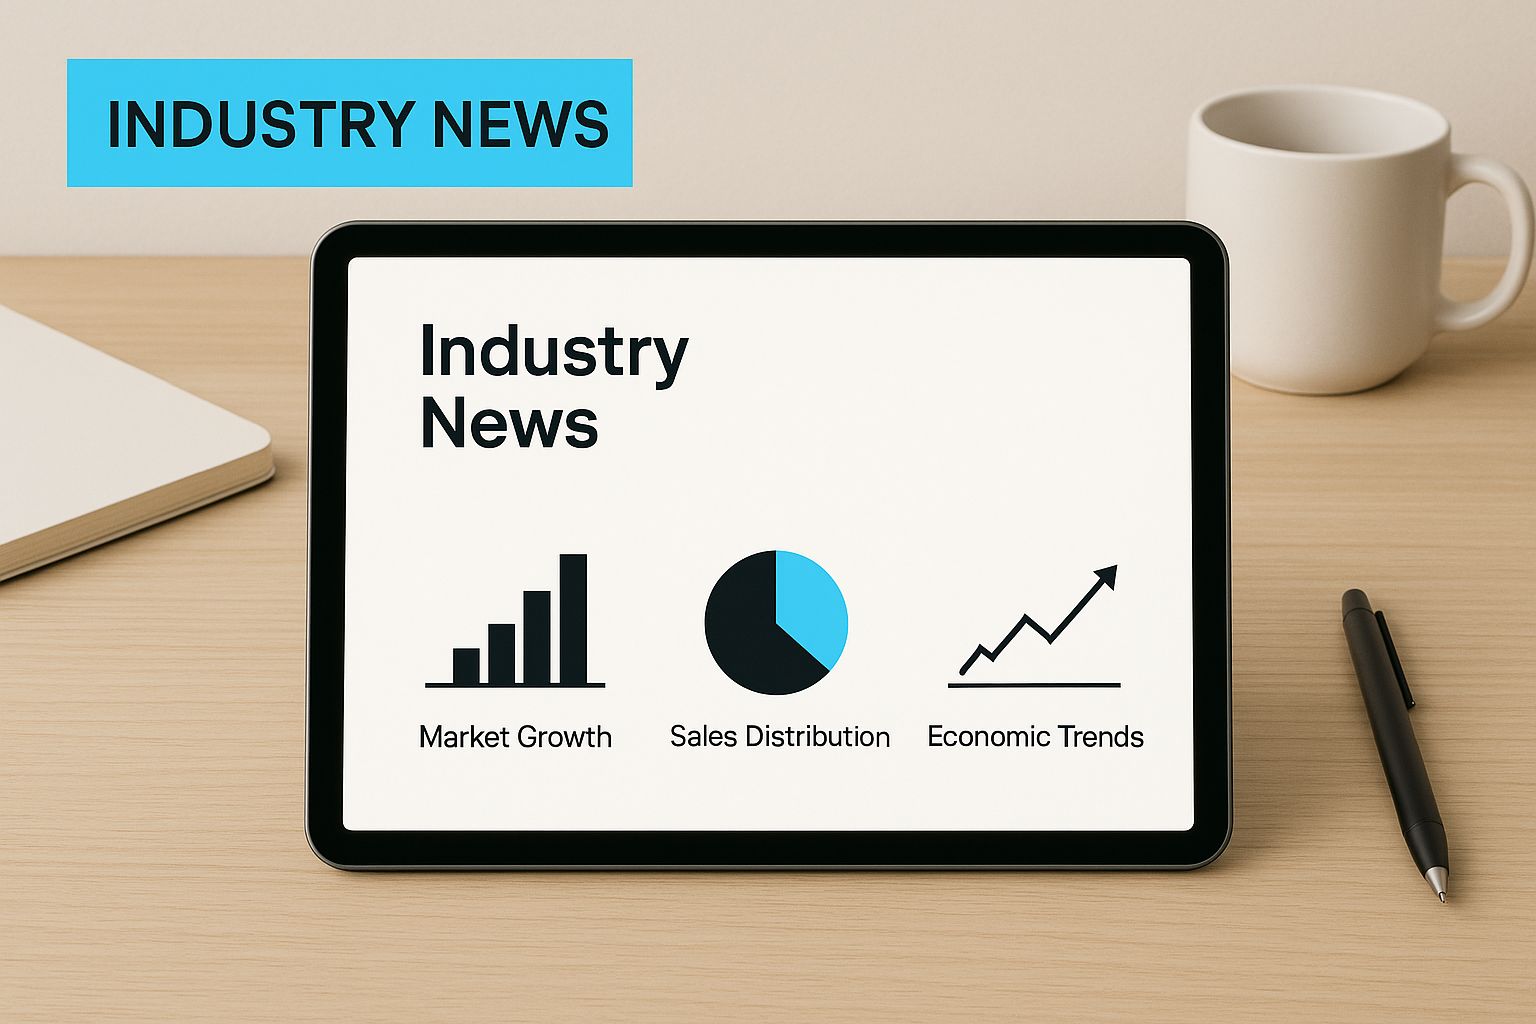
As the visualization shows, keeping a constant pulse on industry news and headlines is just as important as reading the charts.
Next up is the Relative Strength Index (RSI). Think of it as your momentum gauge. It moves between 0 and 100, signaling when an asset might be "overbought" (usually above 70) or "oversold" (below 30). In a healthy uptrend, you’ll often see the RSI stay above the 50 line, which is a great confirmation of bullish strength.
Finally, the MACD helps you understand the relationship between two moving averages. When the MACD line crosses above its signal line, it’s a classic buy signal. A cross below suggests bearish momentum is taking over.
I've put together a quick reference table to help you keep these straight.
Technical indicators can seem complicated, but they're really just tools for translating price action into clearer signals. This table breaks down some of the most common ones, what they do, and how to interpret what they're telling you.
By getting comfortable with these indicators, you can start building a more complete picture of the market's health instead of just looking at the price alone.
Some patterns on a chart are like giant road signs, pointing to a potential trend continuation or a full-blown reversal. Two of the most important ones involve the 50-day and 200-day moving averages: the "golden cross" and the "death cross."
A golden cross is when the shorter-term 50-day moving average moves above the longer-term 200-day moving average. This is widely seen as a major bullish signal, often suggesting that a new, powerful uptrend is just getting started.
The opposite is the death cross, which happens when the 50-day MA drops below the 200-day MA. This is a serious bearish signal that can precede significant market drops or confirm a bear market is taking hold. These patterns are so powerful because they filter out the short-term noise and signal a genuine shift in who's in control of the market.
A golden cross isn't just a technical signal; it's a visual representation of momentum shifting from bearish to bullish on a massive scale. It tells you that the buyers have not just won a battle, but are likely winning the war.
Price shows you what is happening, but volume tells you how much conviction is behind the move. Think of it this way: a price breakout on low volume is suspicious and often fails. But a breakout on a huge spike in volume? That confirms that big money and the broader market are on board.
Analyzing volume alongside price is essential. Data from exchanges like Cboe Global Markets shows that trading volume tells a story. When you see a golden cross form on high volume, for example, it’s a much stronger bullish signal.
Here’s a simple way to think about it:
By combining these three elements—core indicators, key patterns, and volume analysis—you build a robust framework for reading charts. You're no longer guessing; you're interpreting the evidence the market gives you every single day.
The charts and economic reports give you the hard numbers, the solid foundation. But let's be honest, some of the biggest market-moving trends don't start in a quarterly report. They start as whispers on the internet, growing into a roar that eventually dictates where money flows. If you can learn how to listen to that digital chatter, you can spot opportunities before they hit the mainstream.
This is all about tapping into social sentiment. Think about it—platforms like X (the old Twitter), Reddit, and even YouTube are global town squares. This is where real people—and real investors—voice their excitement, doubts, and wild speculations about stocks, new products, and entire industries, all in real time. Learning to tune in is a genuinely modern way to get a jump on emerging trends.
Just mindlessly scrolling through your social feed is a surefire way to get lost in an ocean of noise. The trick is to listen strategically. You need to zero in on the specific communities, keywords, and influencers that actually matter for the sectors you're watching.
For instance, everyone knows about the chaos of r/wallstreetbets, but the real gold is often in the quieter, more focused communities. Subreddits like r/electricvehicles or r/biotech can offer incredibly sharp insights into new tech and what real consumers are thinking. The same goes for X; instead of following the herd, build curated lists of sharp financial analysts and industry insiders to get a filtered, professional take.
The goal here isn't just to see what people are talking about. It's to understand why. Is a company suddenly getting tons of mentions because of a legitimate product breakthrough, or is it just the flavor-of-the-week meme stock? That's the million-dollar question.
Let's face it, trying to track all this manually is a fool's errand. The scale is just too massive. This is where tools that use Natural Language Processing (NLP) really shine. These platforms are built to do the heavy lifting, sifting through millions of posts and comments to figure out the emotional tone of the conversation.
Essentially, they analyze text and spit out a sentiment score—is the chatter positive, negative, or neutral? A sudden jump in positive sentiment for a biotech company, backed by discussions about promising clinical trial results, is a signal you can actually work with. It's a world away from a random, unexplained spike in mentions.
Sentiment analysis has become a serious tool. The massive amount of data from platforms like YouTube and X often reflects investor and consumer feelings before they show up in the price. In fact, sentiment scores pulled from tweets or YouTube comments have been shown to correlate with short-term stock volatility in major markets. You can find more data on the link between social metrics and financial markets over at Statista.com.
Here’s a pro tip: The real magic isn't just seeing if sentiment is positive or negative. It's about spotting a change in that sentiment. A clear shift from neutral to overwhelmingly positive can be a powerful heads-up that a new uptrend is brewing.
Finding a hot topic online is easy. The hard part is figuring out if it's real or just hype. A sudden burst of chatter doesn't automatically mean you've struck gold. You need a simple, repeatable way to check if the signal is the real deal.
Here’s a practical way to approach it:
Quantify the Buzz: Use a social listening tool to track the mention volume. Is it a slow, steady burn over days or weeks, or was it a one-day wonder that vanished? Steady, organic growth is what you want to see.
Check the Sources: Who’s doing the talking? Is the conversation being driven by a handful of anonymous accounts, or are credible industry experts, journalists, and respected users weighing in? The quality of who is talking is just as important as how many are talking.
Line It Up with the Chart: Now, pull up the stock chart. Does the price action actually back up the sentiment? If social media is screaming "buy" but the price is consistently making lower lows, something is seriously wrong. A real trend will have bullish sentiment confirmed by rising prices and strong volume.
Do a Reality Check: Does the online story match what the company is actually doing? If the internet is buzzing about a revolutionary new AI product, go check the company's official press releases. Did they actually announce it? Is it a core part of their business plan?
By running every social signal through this quick filter, you can learn to separate fleeting fads from genuine shifts in the market. It’s how you use all this digital data to your advantage without getting burned by the hype.
Alright, you’ve learned how to read economic reports, spot chart patterns, and even check the pulse of social media. Each of these skills is a solid piece of the puzzle. But the real edge in today's markets comes from blending that human intuition with the sheer number-crunching power of artificial intelligence.
AI-driven tools don’t have hunches; they have data. They can chew through millions of data points—from tick-by-tick price changes to an ocean of social media comments—and spot patterns a person could never see. This isn't about replacing your judgment. It's about giving it a powerful, data-backed partner.
Picture a tool that scans for all your favorite trend confirmations in real-time, right on your chart. That’s exactly what smart indicators, like those from EzAlgo, are built for. Forget manually stacking five different indicators and trying to decipher their mixed signals. AI can handle that for you.
These aren't your grandpa's static indicators. They’re built on machine learning models that actually adapt to what the market is doing now. They learn what a strong uptrend looks like and can flag signs of weakness or confirmation as they unfold.
For instance, instead of you just noticing a price crossing a moving average, an AI indicator might confirm that move by simultaneously flagging a spike in bullish volume and a positive shift in market sentiment. This gives you:
Let's walk through a common scenario. Your own technical analysis is screaming "bullish breakout." The price just punched through a major resistance level, and the MACD is curling up nicely. That’s a good start, but how can you be more certain?
This is where you bring in AI for a second opinion. You could look for a clear "Buy" signal from an algorithm like EzAlgo, which runs its own complex checks behind the scenes. If the AI signal lines up with your analysis, the confidence level of your trade idea just shot way up.
Think of AI as your unbiased co-pilot. It takes your hypothesis—"I think we're starting a new uptrend"—and stress-tests it against mountains of data, giving you a straightforward confirmation that cuts through all the noise.
It's like asking an expert who has analyzed every similar setup for the past decade. This extra layer of validation is invaluable for filtering out those fake-outs and head-fakes that trap so many traders. If you want to dive deeper, our guide on how to use AI for stock trading covers these concepts in much more detail.
Markets aren't static. They’re living, breathing things that are constantly evolving. A strategy that killed it last year might get you killed this year. This is where the adaptive nature of machine learning really shines.
AI algorithms can be trained to recognize when the market's personality shifts—when volatility picks up, when liquidity dries up, you name it. As conditions change, a smart algorithm can adjust its own parameters to stay effective, something a traditional, static indicator just can't do without you manually re-calibrating it.
For example, when things get choppy and volatile, an AI tool might automatically widen its definition of support and resistance to account for the bigger price swings. In a quiet, sideways market, it might tighten things up to give you more precise signals.
By weaving these tools into your process, you’re making your analysis more resilient. You're combining your hard-earned market intuition with a system that learns and adapts on the fly. This blend of human skill and machine intelligence isn't some far-off future concept—it's the new standard for anyone serious about trading.
Even with a solid strategy, a few questions always pop up when you're trying to read the market. It happens to everyone, from brand-new traders to seasoned pros. It’s one thing to read about trends in a book, but it’s a whole different ballgame when your own money is on the line.
Let's walk through some of the most common hurdles traders run into. Getting these sorted out will give you a much clearer framework for making decisions, especially when the charts look like they’re trying to trick you.
This is the million-dollar question, isn't it? The best way to tell a genuine trend from a random, short-term blip is through confirmation. A single indicator giving you a "buy" signal is just a hint; you need a few different, independent sources all telling you the same story.
Think of it like a detective building a case. One clue is interesting, but three or four all pointing to the same suspect? Now you've got something solid.
When you see these three things line up, you can be far more confident that you're riding a real trend and not just getting chopped up by market noise.
Conflicting signals aren't just common—they're a guarantee. It’s incredibly frustrating when your MACD is screaming "buy" while the RSI is flashing "overbought." This is a classic sign of market indecision, and honestly, the best move is often to just sit on your hands.
When your tools are arguing with each other, don't try to force a trade. That's a recipe for disaster. Instead, see it for what it is: the market telling you that neither the bulls nor the bears are in control.
A lack of a clear signal is a signal. It's the market's way of telling you to be patient and protect your capital for a better opportunity.
Let's say you're in a strong uptrend, but an AI tool like EzAlgo suddenly flashes a reversal warning. That doesn't mean you should immediately hit the sell button. It's a heads-up. It means the trend might be running out of gas, and it's probably a good time to tighten your stop-loss or maybe even take a little profit off the table.
The key is to keep it simple. Start small and get really good at one or two things before you add more. If you try to analyze economic data, chart patterns, social media sentiment, and AI signals all at once, you’ll just end up with analysis paralysis.
Here’s a practical way to get going:
Once you're comfortable and seeing some consistency in your practice trades, then you can start slowly adding more layers to your analysis, like economic news or AI-driven confirmation signals. The goal isn't to become an expert overnight; it's to build a solid, repeatable process one step at a time.
Ready to stop guessing and start getting clear, AI-driven signals on your charts? EzAlgo provides real-time buy and sell alerts, momentum shift warnings, and dynamic support and resistance levels to help you identify and act on market trends with greater precision. See how our tools can improve your trading strategy.


%201.svg)