


Simulating a trading strategy on historical data to see how it would have played out is called backtesting. Think of it as a dress rehearsal for your trading ideas. It's the single most important step you can take to validate a strategy, find its hidden flaws, and get a real feel for its risk before putting any actual money on the line.
How can you be sure a trading idea has any shot at working before you risk your hard-earned capital? That’s the question backtesting answers. It’s all about taking your trading rules, running them against past market data, and seeing what happens. This process helps you filter out bad ideas and build real, data-driven confidence in the good ones.
This isn't about chasing a "holy grail" system that never loses. Far from it. A proper backtest helps you set realistic expectations by showing you the true personality of your strategy. It’s a systematic way to uncover weaknesses that are otherwise invisible just by looking at a chart.
Every strategy has its own character. Some are superstars in trending markets but get torn apart when the market goes sideways. Others might grind out small, steady wins but then suffer one massive loss that erases weeks of progress. Backtesting brings these vital traits to the surface.
A backtest forces you to turn a vague "idea" into a concrete set of rules you can't break. That process alone is invaluable because it cuts out the emotional, seat-of-your-pants decisions that wreck most traders.
At its core, backtesting is simple: apply your rules to old data and measure the results. For example, you might run a strategy on a decade of S&P 500 data to see what kind of numbers it produced. You’re looking for key performance metrics like total return, Sharpe ratio, and that all-important maximum drawdown. A solid backtest might show a Sharpe ratio—which measures return versus risk—somewhere in the 0.7 to 1.5 range. You can learn more about these key investment metrics to get a deeper understanding.
Thankfully, platforms like TradingView have made this kind of professional-grade analysis accessible to everyone. The screenshot below is a perfect example of the Strategy Tester report in TradingView, which automatically crunches all these vital numbers for you.
This report gives you an instant snapshot of the net profit, total number of trades, and the equity curve. It provides a clear visual and statistical summary of how your strategy would have performed.
When you run a backtest, you'll be hit with a wall of data. It's crucial to know which numbers actually matter. This table breaks down the most important metrics you’ll see in any report.
Understanding these key figures is the first step toward properly interpreting your results. They move you beyond just asking "Did it make money?" to asking "How did it make money, and was the risk worth it?"
Alright, let's move from theory to action. This is where the rubber meets the road. To run a back test trading strategy you can actually trust, you need a clean and consistent setup. Think of it like a science experiment—if your starting conditions are always different, your results won't mean a thing.
We're going to walk through how to prep your TradingView environment. The whole point is to build a repeatable foundation. That way, every test you run is a fair, apples-to-apples comparison with the last one, which is essential for making smart, objective decisions.
Before you even start clicking buttons, you need to think like the pros and gather the right data.
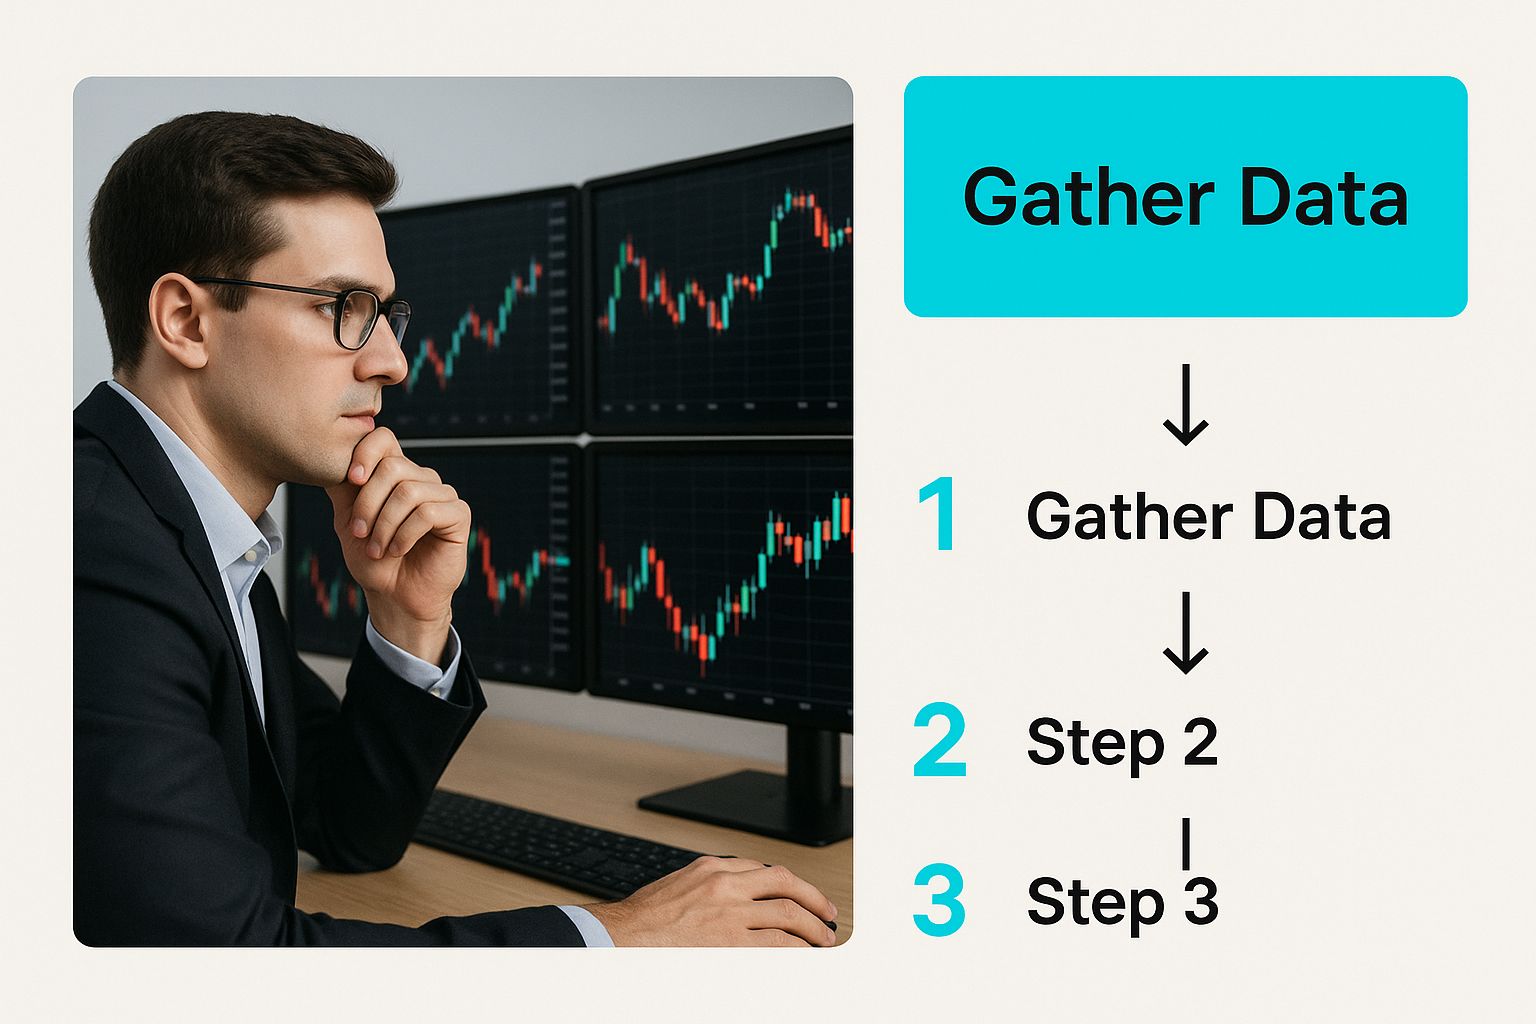
As you can see, the foundation of any solid backtest is methodical data analysis. It’s the groundwork that everything else is built on.
First things first: what are you trading, and on what timeframe? Your answer completely depends on your personal style. Are you a day trader glued to the 5-minute chart on BTC/USD, or are you a swing trader who checks the daily chart for SPY a couple of times a week?
Be honest with yourself here. A huge mistake I see people make is testing a strategy on a timeframe they can't realistically trade. If you have a 9-to-5 job, testing a 1-minute scalping strategy is a waste of time. Sure, the results might look amazing, but you’ll never be there to execute the trades. Pick a timeframe that actually fits your life.
A backtest is only as good as its data. You absolutely need to see how your strategy would have held up through different market phases—roaring bull runs, painful bear markets, and those frustrating sideways periods where nothing seems to happen.
On TradingView, the "Go to" feature in the bottom toolbar is your best friend. Use it to jump back in time.
A word of warning: Not using enough data is probably the #1 reason backtests fail in the real world. If you only test your strategy on a 6-month bull market, you're getting a skewed, overconfident view of its performance that will likely fall apart when conditions change.
Now it’s time to add your tools to the chart. For this guide, we’re focusing on EzAlgo. Once it’s on your chart, you need to open its settings. These settings are the rules of your strategy.
With EzAlgo, for instance, you'll be tweaking things like:
Think of these settings as the dials on a machine. Every little turn creates a new variation of your strategy. I can't stress this enough: write down every configuration you test. If you find a winning combination, you need to be able to replicate it perfectly.
For a deeper dive into the nuts and bolts, check out our complete guide on how to backtest on TradingView.
Nailing this setup is everything. A sloppy start leads to a worthless test. Once you're set, you're ready to start crunching the numbers.
Alright, with your chart set up and your rules clearly defined, it's time to dive in and actually trade—in a simulator, of course. This is where we put your strategy to the test using TradingView's Bar Replay tool. We're going to move through market history, candle by candle, and make decisions based only on the EzAlgo signals and the rules you've already laid out.
This isn't just a mechanical exercise. Manually clicking through each trade forces you to experience the market's rhythm. You'll feel the drag of a sideways market and the rush of a clear trend, all without risking a penny. Honestly, this is one of the best ways to build the discipline needed to execute your strategy when real money is on the line.

The goal here isn't just to find out if the strategy is profitable. It's about generating clean, unbiased data that shows you exactly how your system performs. That data is what you'll use to analyze and improve everything later.
First things first, find the Bar Replay tool in TradingView's top toolbar and click it. Then, click on your chart to pick a start date in the past. As soon as you do, all the price action after that point will vanish. This creates a realistic trading environment where you genuinely don't know what's coming next.
Now, you'll advance the chart one bar at a time using the "Forward" button. Your only job is to watch for your entry signals. For example, using EzAlgo, your rules might look something like this:
When your conditions are met, you pause and log the trade. No jumping ahead. No second-guessing. If the rules say "go," you go. It’s this strict, mechanical approach that makes a manual back test trading strategy so incredibly valuable.
The hardest part of manual backtesting? Fighting the urge to cheat. Your brain knows what actually happened in the market, but you have to force yourself to act only on what's visible on the screen at that moment. Overcoming this hindsight bias is the single most important factor in getting results you can trust.
Every simulated trade needs to be written down. Seriously, don't skip this. Open a simple spreadsheet and create columns for the key pieces of information. This isn't busywork; it's the entire reason we're doing this.
Your trading log should capture at least the following:
Discipline here is non-negotiable. Stick to your risk management rules like glue. If your plan calls for a fixed 2% stop-loss on every trade or a 1.5 ATR trailing stop, you have to apply it every single time, without exception. This methodical logging process is what turns watching charts into gathering hard data you can actually analyze for real, actionable insights.
You’ve done the hard work of running your manual backtest and logging every single trade. So now you've got a spreadsheet staring back at you, full of numbers. But raw data doesn't tell the whole story. This is where the real work begins—translating those numbers into a clear understanding of your strategy's performance and, more importantly, its personality.
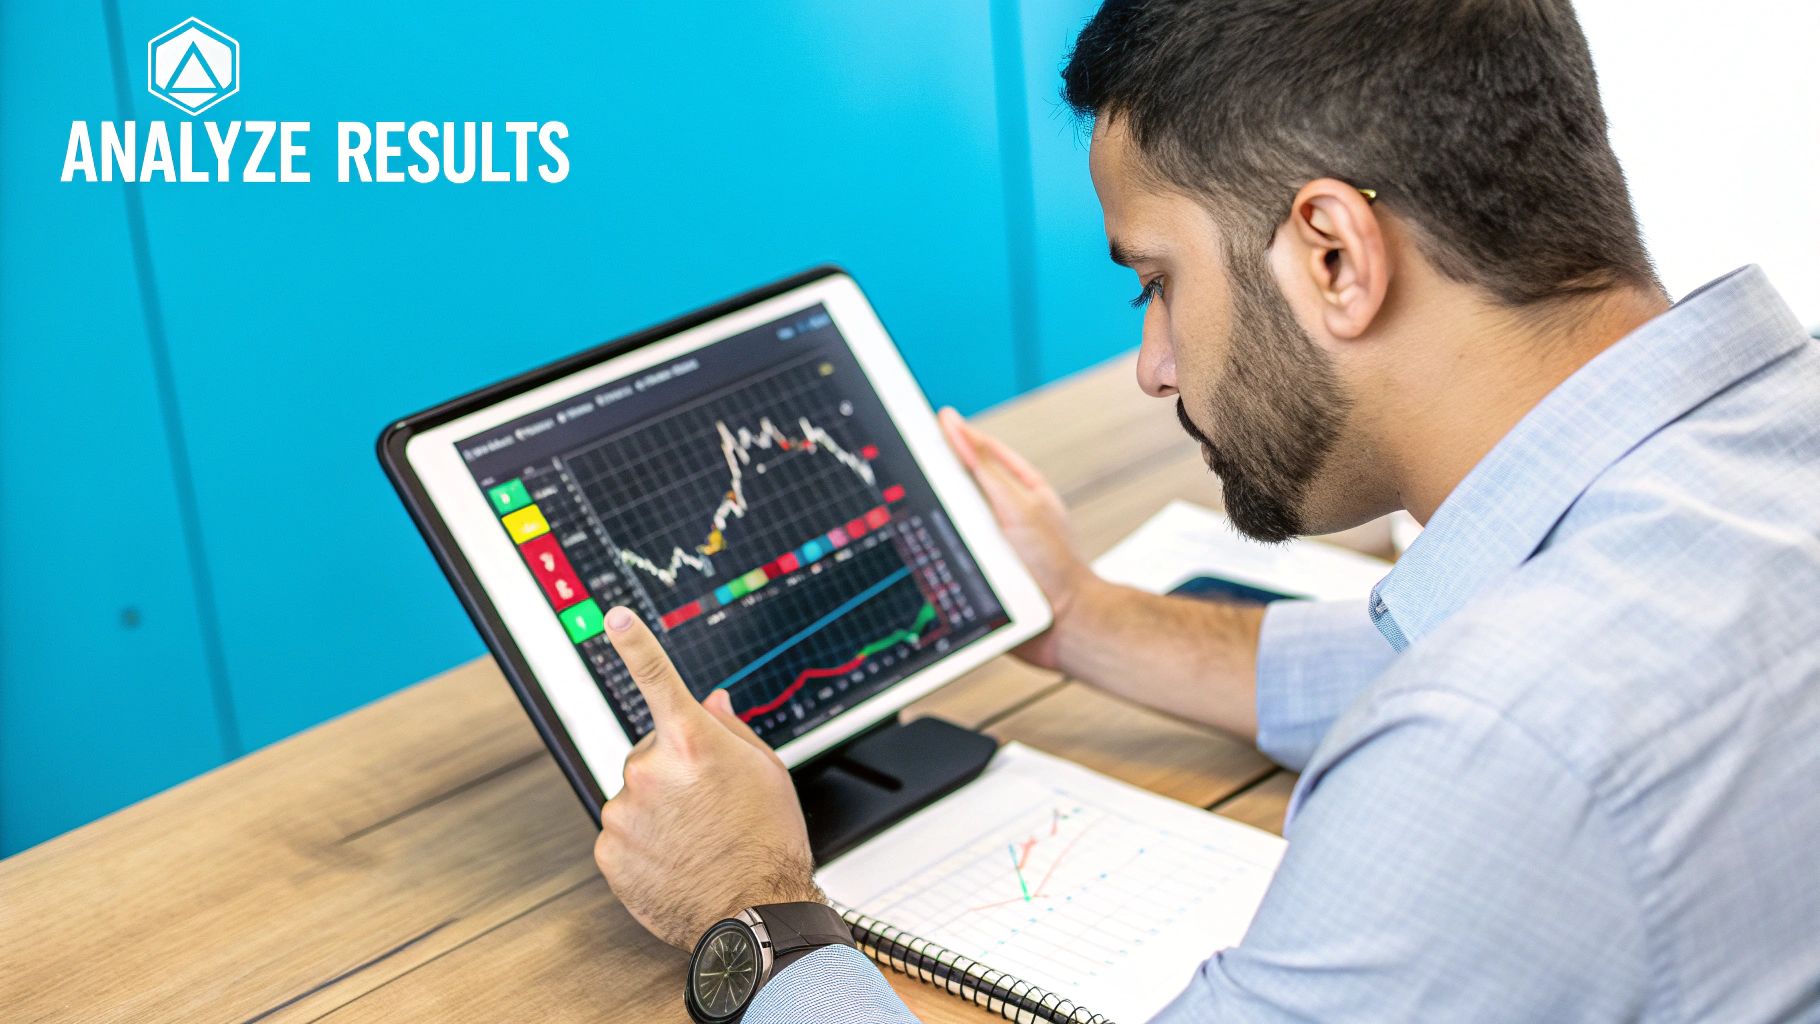
It’s tempting to just glance at the Net Profit and call it a day. While that’s an obvious starting point, it's really just a vanity metric. A profitable backtest doesn't automatically mean you have a robust strategy you can trust with real capital. We need to dig much deeper to see what's really going on under the hood.
To figure out if your back test trading strategy is actually viable, you have to focus on a few key metrics that paint a much more honest picture. These are usually found right in TradingView's "Strategy Tester" tab, but you can also calculate them easily from your own trade log.
Let's break down the most important ones:
A common mistake is falling in love with a high win rate. I'd much rather have a strategy with a 45% win rate and a 2.5 Profit Factor than one with an 80% win rate and a 1.1 Profit Factor. The first one makes real money; the second one just feels good.
Your backtest data tells a story. Look closer. Does your strategy thrive in strong, trending markets, or does it actually do better in choppy, sideways conditions? By looking at your winning and losing streaks, you can start to identify its unique "personality."
For example, you might discover that your biggest wins almost always happen on Mondays, or that a string of frustrating losses consistently occurs during the low-volume afternoon sessions.
This is where a detailed log becomes your best friend. If you want to see how to structure one, our guide on building a trading journal template can help you get organized. This level of detail is what allows for real refinement. Maybe you decide to stop trading on Fridays or only take signals during the London open. These are the kinds of data-driven decisions that separate amateurs from pros.
Quantitative strategies are built on this kind of deep statistical analysis. It's important to be realistic, though. Studies of quant funds have shown that around 70-80% of strategies don't perform as well in live trading as they did in backtests. This is often due to market changes or overfitting the data.
The successful ones, however, often produce consistent annual returns of 10-15% with manageable risk. Your ultimate goal is to find a strategy whose performance and behavior truly align with your personal risk tolerance. This analysis is the bridge between a good idea and a system you can actually trade with confidence.
A fantastic backtest result can feel like striking gold, but honestly, it’s often fool's gold. I’ve seen countless traders get caught up in common traps that paint a perfect picture, giving them a false sense of security before they risk a single dollar of real money.
Knowing what these pitfalls are is what separates the disciplined, professional testers from the hopeful gamblers.
The most dangerous and seductive mistake is overfitting. This is when you tweak your strategy’s parameters so perfectly to fit the historical data that it looks like a flawless money-printing machine.
For example, you might adjust a moving average from a 19-period to a 21-period just because it neatly erases two losing trades from your test. The equity curve looks amazing, but what you've really done is curve-fit the strategy to random market noise, not a genuine, repeatable edge.
That perfectly tuned machine will almost certainly break down the moment it faces live, unpredictable market conditions. It's a classic case of winning the battle on paper but losing the war in your brokerage account.
Beyond overfitting, there are a couple of other subtle but deadly errors that can completely invalidate your results.
Survivorship bias is a big one. This happens when you test a strategy only on assets that are still around today—like the current stocks in the S&P 500. You're completely ignoring all the companies that went bankrupt, got delisted, or simply failed. This makes your results look artificially fantastic because your test universe only includes the "survivors." The fix? Always use a historical dataset that includes delisted assets for a true picture of performance.
Then there's look-ahead bias, where your backtest accidentally uses information that wouldn't have been available when a trade was actually open. This is incredibly easy to do, especially with manual backtesting. For instance, you might see a strong candle forming and subconsciously anticipate its close, jumping into a trade a bit earlier than your rules would have allowed in real-time.
The only way to combat look-ahead bias is with brutal discipline. When using TradingView's Bar Replay tool, you must make your decision based only on the information available after the most recent bar has fully closed. No peeking. No exceptions.
Backtesting is a game of probabilities and resilience, and biases are the house edge working against you. It's crucial to be aware of them so you can actively design your testing process to minimize their impact.
By keeping these biases in mind, you can approach your backtesting with the healthy skepticism required to build something that actually works.
A robust back test trading strategy isn't about chasing a perfect equity curve. It’s about building a system that can take a few punches and handle the messy reality of the live market.
Focus on a solid profit factor and a drawdown you can mentally and financially handle. And please, test your idea across multiple, unrelated assets and over different timeframes. If a strategy only works on BTC/USD on the 15-minute chart from 2020-2021, you don't have a strategy—you have a fluke.
Getting started with backtesting can feel like you're opening a can of worms. You solve one problem, and three more pop up. It's totally normal. Let's walk through some of the most common questions traders ask when they first start putting their strategies to the test.
This is a classic question, and the honest answer is: it depends. There’s no universal "right" amount of data. The real goal is to capture a wide variety of market conditions—you want to see how your strategy held up during a raging bull market, a painful bear market, and those long, boring sideways grinds.
To get a result that isn't just random luck, you should aim for a sample size of at least 100-200 trades. What that looks like in terms of time can vary quite a bit.
The profit factor is one of your most important metrics. It's simply your total profit divided by your total loss. Anything above 1.0 means you're in the green, but just barely scraping by isn't what we're after.
A profit factor somewhere between 1.5 and 2.0 usually indicates a solid, healthy strategy. It tells you there's a real edge there, one that can likely absorb real-world trading friction like commissions and slippage.
Be a little skeptical if your profit factor is over 2.5. It's not impossible, but an exceptionally high number can be a warning sign that your strategy is overfitted to the historical data. On the flip side, if you're struggling to keep it above 1.25, the strategy might not be robust enough to survive in a live market.
A successful backtest isn’t the finish line; it’s the green light to move to the next stage. It validates the idea, but it's not a guarantee of future profits.
Hold your horses. A fantastic backtest is exciting, but it's not a direct ticket to live trading. The absolute next step is forward testing, which you might also know as paper trading. This means running your strategy in a simulated environment on the live market.
Think of forward testing as the final dress rehearsal. It’s where your strategy meets the chaos of the real world—slippage, unexpected news events, and the psychological pressure of making decisions in real-time.
Only after your strategy proves itself during a solid period of forward testing should you even think about putting significant capital behind it. This step-by-step process helps ensure you're not just banking on a pretty picture from the past but are truly prepared for the realities of the future.
Ready to stop guessing and start building your edge with real data? EzAlgo gives you the signals and institutional-grade tools to build, test, and execute your strategies with confidence right on TradingView.


%201.svg)