


So, you want to learn how to backtest on TradingView? Before we dive into the nuts and bolts, let's talk about why this is a non-negotiable skill for any serious trader. Think of backtesting as your training ground. It’s where you can put your trading ideas through their paces on historical data, without risking a single penny of your hard-earned capital.
This isn't about finding a magic formula. It's about stress-testing your strategy to see how it really behaves in the wild.
Jumping into the market without a tested strategy is like flying blind. You’re relying purely on gut feelings and luck, which is a recipe for disaster. Backtesting gives you a clear picture of how your rules would have held up through all kinds of market weather—from raging bull runs to punishing bear markets and the frustrating sideways chop in between.
This rigorous, data-first approach is what truly separates traders who stick around from those who don't. It’s not just about finding something that could work; it’s about knowing your strategy’s personality, its strengths, and, just as importantly, its breaking points.
At its core, backtesting drags your trading ideas out of the realm of guesswork and into the light of objective evidence. Instead of just hoping a moving average crossover strategy will be profitable, you can test it across years of price action to see the cold, hard numbers for yourself. This is where TradingView really shines, turning what could be a complex analysis into something you can actually understand and use.
You’ll get to know some critical performance stats:
TradingView’s backtesting engine is a beast. It takes your strategy’s rules—written in its Pine Script language—and runs them across historical price data, plotting every simulated entry and exit right on your chart. It’s incredibly powerful, analyzing millions of trades a year for traders worldwide.
But here’s a crucial detail: the standard backtester primarily works with candle data (the open, high, low, and close). It doesn't process every single tick that happened in real-time. This means your results are a very close simulation, but not a perfect one-to-one replica of live trading. For a deeper dive, it's worth understanding exactly how the TradingView backtester works.
A Word of Caution: A fantastic backtest result doesn't guarantee future profits. The market is always changing. The real goal of backtesting is to validate your logic, find hidden flaws, and build the rock-solid confidence you need to pull the trigger without hesitation when real money is on the line.
Ultimately, mastering backtesting on TradingView gives you a massive edge. It lets you refine your methods, get a handle on risk, and build the discipline that long-term trading success demands.
This is where the magic happens. The Strategy Tester is your command center for putting trading algorithms to the test on TradingView. Located right at the bottom of your chart, this panel lets you load, tweak, and analyze strategies without touching a single line of code. It's the fastest way to see if an idea has any merit.
Getting started is simple. Just pop open the "Indicators & Strategies" window and click on the "Strategies" tab. You'll find a whole library of ready-to-go scripts from TradingView and its community. Go ahead and click on one, like a classic "Moving Average Crossover," to add it to your chart.
The moment you add a strategy, the Strategy Tester panel springs to life and fills with data. This is your first real step in figuring out how to backtest a trading strategy the right way. You'll immediately see the simulated buys and sells plotted on your chart, giving you a quick visual gut check on how it performed.
The real power here is speed. Instead of spending hours manually scrolling back in time and marking up charts, you can let the platform crunch years of historical data in a matter of seconds. It lets you test a dozen ideas in the time it would take to analyze one manually.
This diagram shows the basic flow, from finding an idea to seeing the results.
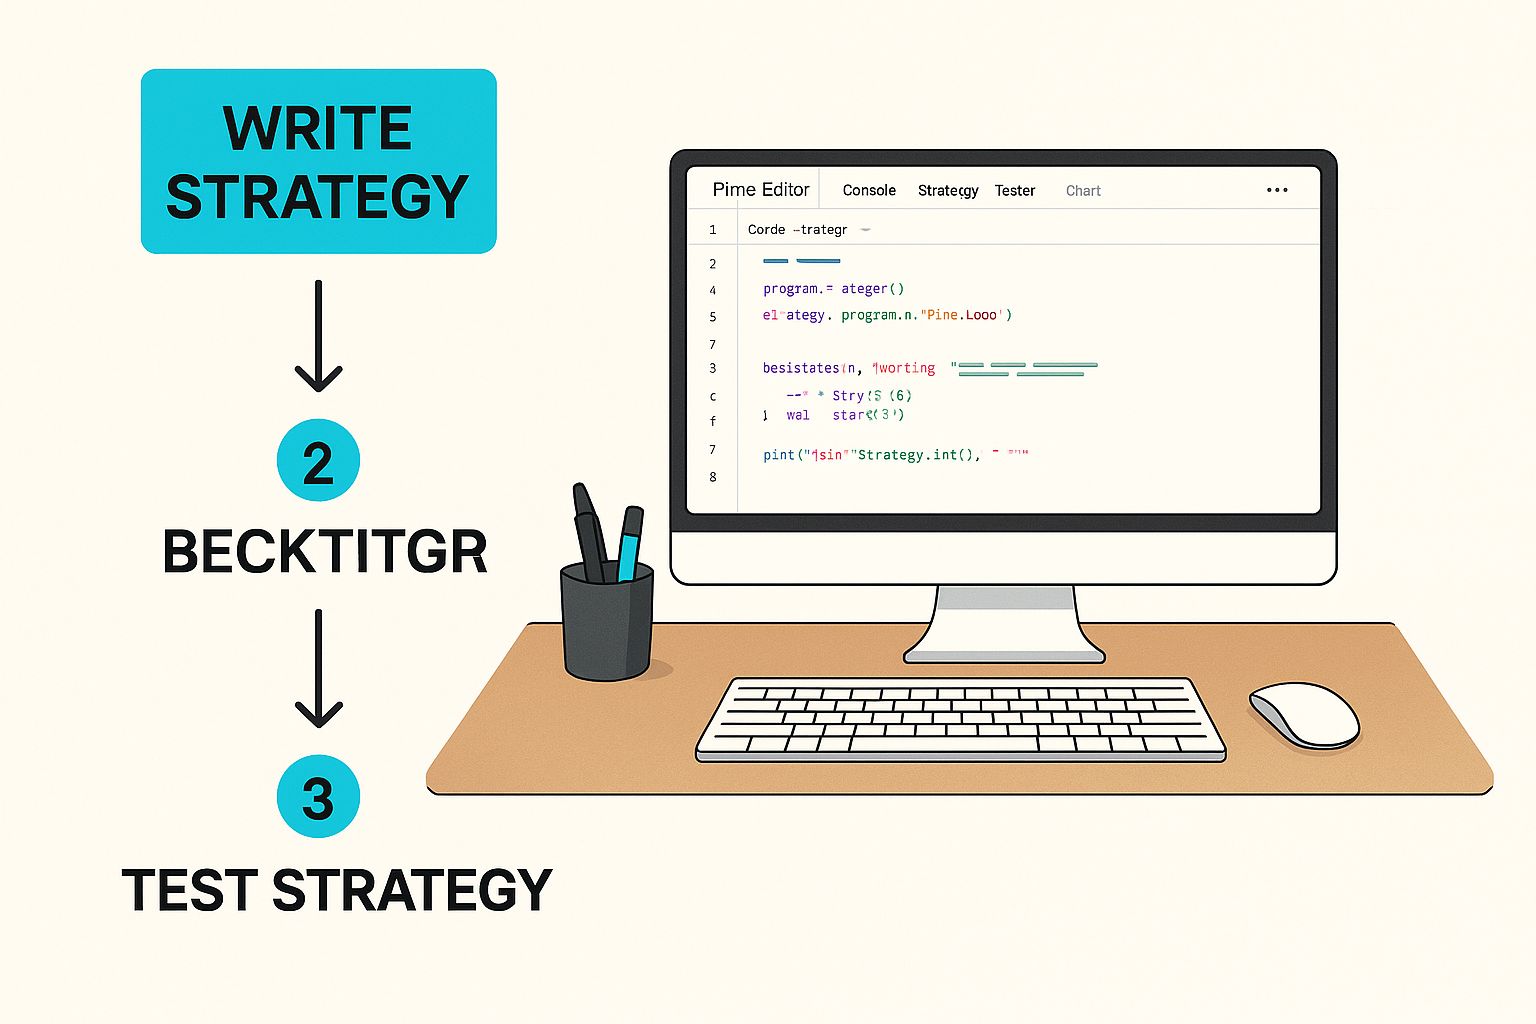
It’s all about this loop: select a strategy, run the numbers, and interpret the report. This is the core routine for any systematic trader.
Your first stop in the tester panel should be the "Overview" tab. Think of it as the strategy's report card. It throws a lot of numbers at you, but don't get fixated on just the final profit. The story is in the details.
I always focus on these three metrics first:
The Performance Summary report breaks down these numbers even further, giving you a complete picture of what happened.
Pro Tip: Dig into the "List of Trades" tab. This is a trade-by-trade log of every single action the strategy took. I use this to spot weird patterns. Does the strategy always lose money on Fridays? Does it get chopped up in low-volatility markets? This is where you find the clues to make your strategy even better.
Automated backtesting is fantastic, but let's be honest—not every trading strategy can be coded. Some of the best systems rely on a trader's feel for the market, their ability to read the subtle story each candle tells. If that sounds like you, then TradingView's Bar Replay tool is about to become your best friend.
Think of it as a time machine for your charts. It lets you go back and relive any market session, candle by candle, as if it were unfolding live. This is the ultimate training ground for discretionary traders who need to sharpen their chart-reading instincts.
Getting started is simple. Look for the "Replay" button on the top toolbar of your chart. Once you click it, your cursor transforms into a blue vertical line with a little scissors icon.
Now, just scroll back on your chart to the exact moment you want to start your simulation. Maybe you want to test your nerve right before a huge Federal Reserve interest rate decision. Click on the chart, and everything to the right of your blue line instantly disappears, erasing all future price action. No more cheating with hindsight!
A small control panel pops up, putting you in the driver's seat. You can:
This hands-on method forces you to make real decisions based only on the information you have at that moment. It's the closest you can get to live trading without risking a single penny.
Let's say you're working on a breakout strategy for the EUR/USD pair on the 15-minute chart. You could find a period where the price was stuck in a tight range, rewind to just before a big news event, and start the replay.
As each new candle appears, you're forced to analyze the momentum. Is this the real breakout or a fakeout? Where would you put your entry? Your stop-loss? Your profit target? This is where theory meets reality.
The Bar Replay feature is how serious discretionary traders manually backtest. It allows you to simulate live conditions on any timeframe, whether you're scalping the 5-minute chart or swing trading the 4-hour on assets like the Nasdaq 100 or major forex pairs. This is where you can truly refine your edge, testing and tweaking your approach to hit specific performance goals, like aiming for a 70% win rate or a consistent 2:1 risk-to-reward ratio. You can find more detail on how to backtest a trading strategy this way on TradingView.com.
Going through this process over and over again builds crucial muscle memory. It’s not just about proving a set of rules works; it’s about training your eyes to spot your setups and building the rock-solid confidence you need to execute without hesitation when your own capital is on the line.
Using the built-in strategies is one thing, but the real magic in learning how to backtest on TradingView happens when you start customizing. This is where you can truly dial in a strategy to fit your personal trading style, and for that, we need to open up the hood and look at the Pine Editor.
The Pine Editor is TradingView's own coding environment. It’s the engine room where every indicator and strategy on the platform is built.
Now, don't let the word "code" freak you out. You absolutely don't need a programming degree to make meaningful changes. The goal isn't to build a complex trading bot from scratch, but rather to take something that already works and fine-tune it. This is how you make a strategy your own.
First things first, you need a script to play with. A fantastic place to start is with one of TradingView’s own built-in strategies. Let's take the common "RSI Strategy" for example.
Add it to your chart. You'll see its name appear on the chart itself, and right next to it is a little icon that looks like curly braces: { } (Source Code). Click that. This will open the Pine Editor right at the bottom of your screen, showing you the exact code that makes the strategy run.
Before you touch a single line, you must make a copy. This is a non-negotiable step, trust me. You don't want to accidentally save over the original script. In the Pine Editor menu, just click "Make a copy..." to create your own private, editable version.
With your copy safe, let's make a simple tweak. The standard RSI Strategy might trigger a buy when the RSI dips below 30. But what if you’ve noticed that on the specific asset you're trading, a drop to 25 is a much more reliable oversold signal? All you have to do is find the line in the code defining that condition and change the number from 30 to 25. It's often that simple.
To get comfortable making these kinds of adjustments, it helps to know a few of the core commands. Pine Script was actually designed to be quite readable, even if you’ve never coded before.
Here's a simplified look at what you might find inside a strategy script:
// Lines that start with // are comments. The computer ignores them.
rsiValue = ta.rsi(close, 14) // This calculates the 14-period RSI
rsiOverSold = 25 // Here we're setting our oversold level
// The actual rule for entering a trade
if (ta.crossover(rsiValue, rsiOverSold))
strategy.entry("RSI_Long", strategy.long)
Let's quickly break that down:
ta.rsi(close, 14): This is a built-in function that calculates the Relative Strength Index over 14 periods. Want to see how a 21-period RSI performs? Just change the 14 to a 21.rsiOverSold = 25: This is us creating a variable to define our entry threshold. By changing this one number, you change the entry rule for the entire strategy.strategy.entry("RSI_Long", strategy.long): This is the command that tells the backtester, "Okay, when our condition is met, open a long trade." The text "RSI_Long" is just a label for the trade so you can identify it later.By making small, targeted changes like this, you can test specific ideas one by one. Does a slower RSI work better? Is a more extreme oversold level more profitable? The Pine Editor lets you ask these questions and get answers backed by hard data, almost instantly.
Once you’ve made your change, just hit the "Add to Chart" button. TradingView will immediately re-run the backtest with your new rules. You can then look at the Strategy Tester results to see exactly how your tweak affected performance. This cycle—tweak, test, analyze, repeat—is the absolute core of building a trading system you can be confident in.

Running a backtest and seeing a big, green profit number is exciting. But don't pop the champagne just yet. The raw profit figure is just one small piece of a much larger puzzle.
A profitable backtest doesn't automatically mean you've found a good strategy. In my experience, the real skill isn't just running the test—it's knowing how to read the story the data is telling you. A strategy that doubles an account but has a 90% drawdown isn't a trading plan; it's a recipe for a sleepless night and a blown account.
Likewise, don't get hypnotized by a high win rate. It feels great to win often, but if those small victories are consistently wiped out by one or two crushing losses, you're just bleeding your account dry, slowly but surely.
The very first thing I look at is the equity curve. This simple graph of your account balance over time is the most honest visual in the entire report. You're looking for one thing: a smooth, steady upward slope from the bottom-left to the top-right.
If you see a choppy, jagged curve—even if it ends higher than it started—that's a huge red flag. It points to an inconsistent, unreliable strategy. You need a system you can trust, not a financial rollercoaster.
Next, I check the Profit Factor, which you can find in the "Performance Summary" tab. This metric is pure gold. It tells you exactly how much money your strategy made for every dollar it lost.
This one number gives you a much clearer picture of a strategy's real earning potential than net profit ever could.
To truly understand your results, you need to know what "good" and "bad" look like across several key metrics. This table breaks down what I look for when I'm separating a potentially strong strategy from a weak one that's likely to fail under live market pressure.
Looking at these metrics together gives you a holistic view. A strategy might look great on one metric but fall apart on another, and that's exactly what you're trying to uncover before you risk real capital.
Maximum Drawdown might be the single most important risk metric on the entire report. It shows you the largest peak-to-trough drop your account would have experienced. This number isn't just data; it's a test of your psychological fortitude.
Ask yourself honestly: could you have watched your account drop by that much and still stuck with the plan? If the drawdown is 35%, could you handle seeing over a third of your capital vanish without panicking?
A good rule of thumb is to aim for a max drawdown below 20%. Anything higher suggests the strategy might be too aggressive or just isn't suited for the market you tested it on.
A critical mistake I see traders make all the time is overfitting. This is when you tweak a strategy's settings so perfectly to past data that it looks phenomenal in the backtest but completely falls apart in a live market. It's a data-mined illusion.
The best defense is to test over a large sample size of at least 100 trades and across different market conditions—bull, bear, and sideways markets. For a deeper dive into this, this guide on trading strategy backtesting can help you build a solid framework and avoid these common traps.
The goal isn't to find a "perfect" strategy that never loses. The goal is to find a robust one you can have confidence in, built on a foundation of solid, honest testing.
Even with a powerhouse like TradingView at your command, it's only natural for questions to pop up once you start digging into backtesting. Getting good answers is what builds real confidence in your strategy and your results. Let's tackle some of the most common questions I hear from traders.
The first thing most people wonder about is how accurate the backtesting engine really is. It’s important to know that the standard Strategy Tester works with candle data—the open, high, low, and close (OHLC). It isn't processing every single tick that happened in the market. This can create small differences between what your backtest shows and what would have happened in live trading.
Getting your backtest to mirror real-world trading as closely as possible is a huge priority. While no simulation will ever be perfect, you can absolutely get closer. A big, and often overlooked, step is to properly account for trading costs.
Go into your strategy's settings and configure commissions and slippage. Seriously, don't skip this. A strategy might look like a world-beater on paper, but those seemingly small costs can eat away at profits and turn a winner into a loser. It's a classic rookie mistake.
Here's a pro tip: If you have a premium TradingView plan, you need to be using the Bar Magnifier. This feature makes your backtest far more precise by forcing it to look at a lower timeframe to simulate how your orders would have filled. For example, if you're testing on a 15-minute chart, the Bar Magnifier will dive into the 1-minute data to resolve your trades, which drastically reduces the gap between simulation and reality.
The amount of data you test against directly impacts how much you can trust your results. A strategy that looks fantastic over a few months might have just gotten lucky with the market conditions during that short window.
Here are a couple of rules of thumb I stick to:
Relying on a small slice of history is the fastest way to overfit your strategy—tuning it so perfectly to the past that it has no chance of working in the future.
Yes, you can, and this is a great question for discretionary traders. What if your strategy is based on reading price action, spotting chart patterns, or other visual cues that are a pain to code?
The answer is TradingView's Bar Replay tool.
This feature is a game-changer. It lets you go back in time and "replay" the market candle by candle, just as if it were happening live. It's the perfect way to practice your decision-making and test your non-coded strategy under realistic, simulated pressure. You get to see if you would have pulled the trigger, hesitated, or managed the trade correctly.
Ready to stop guessing and start making data-driven decisions? The suite of tools from EzAlgo integrates directly into your TradingView charts, providing AI-powered buy and sell signals, real-time momentum alerts, and dynamic support and resistance levels. Eliminate emotional trading and gain the technical edge you need. Check out our indicators at https://www.ezalgo.ai.


%201.svg)