


Ever stare at a live chart, heart pounding, wondering if your trading idea is brilliant or a disaster waiting to happen? We've all been there. A backtest trading strategy is how you escape that stress. It's like a financial time machine, letting you test-drive your strategy on past market data to see how it would have fared—all before you risk a single dollar of your hard-earned capital.
Let's be honest: too many traders rely on gut feelings and hot tips. That's a recipe for inconsistent results and emotional whiplash. Backtesting completely changes the game. It turns trading from a gamble into a data-driven discipline, giving you solid evidence to back up every move you make.
Think of it as your personal trading lab. It's a risk-free sandbox where you can experiment with wild ideas, see what breaks, and fine-tune your approach without losing any sleep or money. This isn't just about chasing profits; it's about building genuine, unshakeable confidence in your system.
When you’ve watched your strategy navigate months or even years of historical data—surviving bull runs, bear markets, and choppy sideways action—you start to truly trust it. That confidence is what gets you through a losing streak in a live market.
Instead of panicking and ditching your plan at the first sign of trouble, you'll have the data to know that drawdowns are just part of the process. This insight is the cornerstone of intelligent risk management. A proper backtest will show you ugly numbers like the maximum drawdown (the biggest drop from a peak). Knowing this helps you set realistic expectations and size your positions correctly, so one bad run doesn’t blow up your account.
You can approach strategy building in two ways: endlessly sift through data hoping for a magical pattern, or start with a specific idea. The second approach is worlds more effective.
For example, a clear hypothesis might be, "Buying pullbacks after a stock makes a new 52-week high tends to be profitable." This is a testable idea. You then run it against historical data to see if it holds water. It’s a crucial process you can learn more about by exploring how to backtest a trading strategy with historical data.
To truly succeed, every backtest needs a solid foundation built on several key elements. This table breaks down what's involved in any robust backtesting process, giving you a clear, at-a-glance overview of what you need to get right.
Ultimately, my goal is to help you see backtesting not as a chore, but as your most powerful tool for finding a real edge in the markets. It’s the single best way to prove to yourself that your trading ideas have merit.
Jumping into a backtest trading strategy can feel a bit overwhelming at first, but the secret is to keep it simple. We'll be using TradingView as our home base—it's a fantastic and user-friendly platform that’s perfect for the job.
First things first, you need to decide what you're going to test. Don't get stuck here. Just pick an asset you're already familiar with, whether it's the SPY ETF, a major crypto like BTC/USD, or a forex pair like EUR/USD. The point is to get comfortable with the process, not to discover a million-dollar strategy right out of the gate.
Next, pick a timeframe that fits how you'd actually trade. If you see yourself as a swing trader, the daily or 4-hour chart is a great starting point. If you're thinking more along the lines of a day trader, try the 15-minute or 1-hour chart.
Alright, let's get to the good stuff. Look at the bottom of your TradingView chart and you'll see a panel called the "Strategy Tester." This little dashboard is where all the analysis happens. Go ahead and click on it. It might seem like a lot at first, but we’ll just stick to the important parts.
To get a feel for how it works without writing a single line of code, let's load a pre-built strategy.
The moment you load it, TradingView gets to work, running that strategy against the asset and timeframe you've selected. You’ll immediately see trade markers pop up on your chart—little arrows showing exactly where the strategy would have entered and exited trades. This visual feedback is one of the best ways to understand a strategy's logic.
A great backtest isn't just about the final profit. It's about really understanding how a strategy behaves through different market ups and downs and learning its built-in risks.
The Strategy Tester dashboard breaks down the results into two key tabs: "Overview" and "Performance Summary." The Overview is your high-level report card, showing you the big numbers like net profit, total trades, and the profit factor.
The Performance Summary is where you can really dig in. It gives you detailed metrics like the average profit per trade, the maximum drawdown (a crucial risk metric), and the overall win rate. Getting comfortable with these two tabs is the first real step in turning a pile of data into something you can actually use.
The quality of your data and the time period you test are everything. This image shows what a well-defined backtest setup looks like, detailing the data range, the number of instruments tested, and an acceptable amount of missing data.
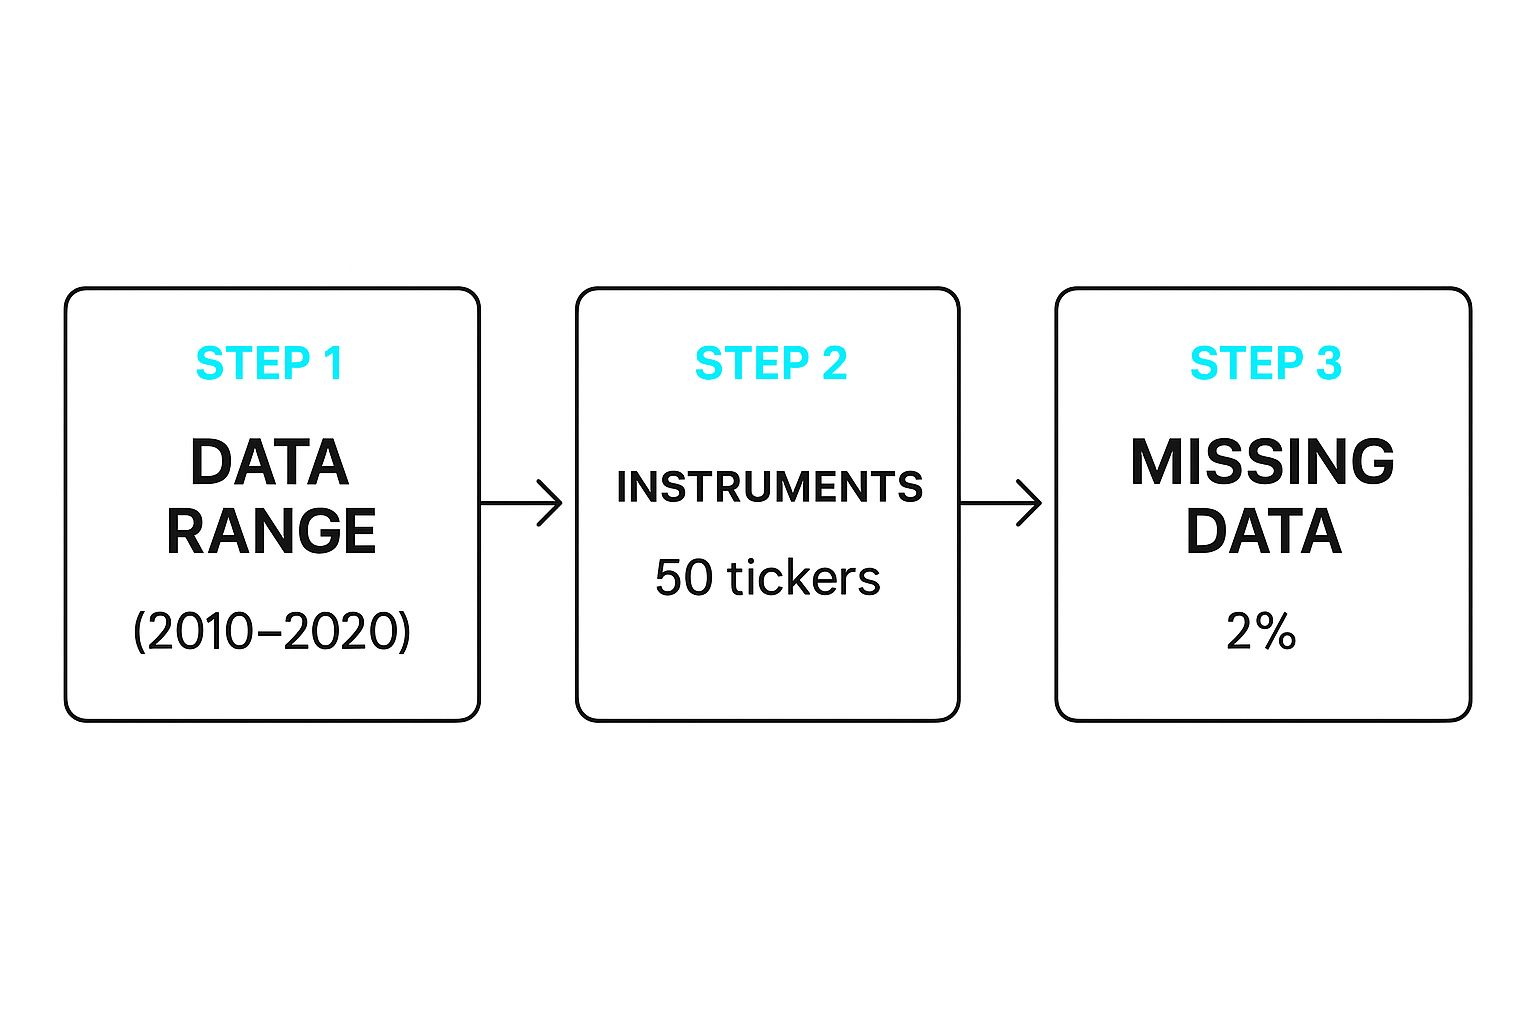
This really drives home the importance of setting clear parameters from the start. A good test needs to cover a long enough historical period and ideally include multiple assets, all while being transparent about any gaps in the data. Taking this structured approach is your best defense against getting fooled by misleading results.
Alright, you've run your first backtest. Now you’re looking at a screen packed with charts and numbers. Don't be intimidated—this data is the story of your strategy's past performance. Learning to read it is how you turn a pile of historical data into real trading intelligence.
The first instinct for many is to look straight at the "Net Profit" number. While that's obviously important, it doesn't tell the whole story. It says nothing about the risk you took or the gut-wrenching drawdowns you might have had to sit through.
To truly know if a strategy is worth trading, we have to look deeper.
Think of it this way: a good backtest report is like a strategy's report card. It tells you not just the final score, but how it behaved along the way. Let's imagine we ran a simple test on a Relative Strength Index (RSI) strategy for Bitcoin (BTC/USD) on the daily chart. Our rules were basic: buy when RSI crosses above 30 and sell when it crosses below 70.
The TradingView Strategy Tester would generate a report with a handful of key metrics. These numbers are what separate a potentially great strategy from a disaster waiting to happen.
A solid backtest tells a story that balances reward with risk. A high profit factor is fantastic, but not if it comes with a terrifying drawdown that would have made you quit in a live market. You need a performance profile you can actually stick with, psychologically speaking.
A backtest isn’t just about proving a strategy works; it’s about understanding how it works. Knowing its weaknesses, like its drawdown potential, is just as valuable as knowing its strengths.
For instance, our hypothetical RSI strategy might show a decent profit factor of 1.6 but a massive max drawdown of 45%. This tells us that while the strategy has an edge, it’s incredibly volatile. Trading it would have been a wild ride. This insight gives us a clear goal: find a way to smooth out those bumps and reduce the drawdown.
To get a clearer picture, it's essential to understand the language of these reports.
The performance summary table can look like a foreign language at first, but each metric tells a specific part of your strategy's story. Here’s a breakdown of the most critical ones you'll encounter.
Understanding these metrics is the first step toward refining your approach. It moves you from simply asking "Did it make money?" to "How did it make money, and could I have realistically traded it?"
By focusing on the relationship between metrics like Profit Factor and Maximum Drawdown, you start to build a much more complete picture. For a more detailed look at how these numbers interact, you can explore our complete guide on backtesting trading strategies.
A bad backtest is worse than no backtest. Why? It gives you a false sense of confidence, convincing you to risk real money on a strategy that was doomed from the start. To make sure your results are actually meaningful, you have to be almost paranoid about avoiding the common traps that can completely invalidate your work.
Think of these biases as optical illusions for traders. They can make a broken strategy look like a goldmine. Recognizing them is the first step toward building a system that has a real shot at working in live markets.
For beginners, these are often the silent account killers that lead to a ton of frustration and, eventually, big losses.
This one is sneaky but incredibly damaging. Survivorship bias creeps in when you only backtest your strategy on assets that are still around today. When you do this, you’re only looking at the "survivors"—the stocks or cryptos that didn’t go to zero or get delisted.
For instance, if you test a stock strategy on the current S&P 500 components going back 20 years, you’re completely ignoring all the companies that were once in the index but went bankrupt or got bought out. Naturally, your results will look fantastic because you’ve conveniently filtered out all the losers.
How to get around it:
This trap is all about accidentally using information that wasn't actually available at the time of the trade. It’s the backtesting equivalent of knowing the winning lottery numbers before you buy a ticket. A classic example is using a candle's closing price to trigger a trade signal that appeared while the candle was still forming.
In a live market, you have no idea what the closing price will be until that candle is officially closed. Using that future data in your backtest leads to impossibly perfect entries and exits that you could never replicate.
A backtest has one golden rule: it must perfectly simulate the forward flow of time. Every decision must be based only on data that was historically available at that precise moment. No cheating.
Finally, there’s overfitting. This is what happens when you tweak and tune your strategy’s settings so perfectly to past data that it becomes completely useless for the future. You’ve basically forced the strategy to memorize the past instead of learning how to adapt.
It’s like creating a rule that buys an asset every time it drops 3.7% on a Tuesday in May. Sure, it might look incredible on the historical chart, but a rule that specific is just noise. It has zero predictive power. This is an extreme example, but overfitting happens subtly all the time as traders keep adding rules and filters to erase every single past loss.
A powerful way to fight this is to split your data.
If the strategy still holds up on data it has never seen before, you've got something much more robust on your hands.
Avoiding these biases is a non-negotiable part of developing a solid trading plan. It's just as crucial as managing your money, which we dive into in our guide on risk management for traders. By staying vigilant, you can trust that your backtest results are giving you a realistic preview of your strategy’s true potential.
Let's get one thing straight: your backtest is only as good as the data you feed it. Think of historical data as the foundation of a house. If it’s built on sand, the whole structure will collapse, no matter how fancy your trading strategy is.
When you backtest a trading strategy, you're betting that past performance can give you clues about the future. But if your data is wrong, you're not just getting clues—you're getting lies.
Bad data can make a terrible strategy look like a goldmine. I've seen it happen. Gaps, errors, or just plain wrong numbers can create phantom profits, giving you a completely false sense of confidence before you put a single dollar of real money on the line.
This next part is critical, so listen up. The detail of your data must match how often you plan to trade. There's no way around it.
Trying to test a scalping strategy that gets in and out of trades in minutes using daily data? That’s like trying to navigate a city with a map of the entire country. It’s completely useless.
If you test a fast-paced strategy with slow daily data, your results will be a fantasy. You'll miss the real-world impact of spreads, volatility spikes, and slippage—all the little things that eat away at profits and can turn a "winner" into a loser.
Garbage in, garbage out. It’s a cliché for a reason. Investing time and even money into quality data isn't a luxury; it’s a non-negotiable part of the job for any serious trader.
The more detailed your data, the more you can trust your results. For anything high-frequency, tick data is the standard. It helps you simulate realistic fills because it captures the bid-ask spread and even order book dynamics. If you want to dive deeper, there's a great paper on why detailed data is so important for backtesting on lseg.com.
So, where do you get your hands on this stuff? Some brokers offer decent historical data, but for serious work, I usually recommend a dedicated data vendor. Their entire business is providing clean, accurate, and properly adjusted data.
When you're looking for a data source, here's what matters:
The good news is that platforms like TradingView—which is what our EzAlgo indicators are built for—provide access to a ton of historical data across different timeframes. For most traders, it’s a fantastic and reliable place to start.
Even with a step-by-step guide, it's totally normal to have a few questions rattling around. Backtesting is a detailed process, and getting it right can mean the difference between having a genuine edge and getting duped by fool's gold.
Let's tackle some of the most common questions that pop up when traders first start digging into their strategy's history.
That’s a great question, and the honest answer is: it depends. Your trading style and how often you get signals are the biggest factors. There’s no magic number, but we can definitely lay down some solid rules of thumb.
If you’re a long-term investor or a swing trader holding positions for weeks or months, you need to see how your strategy holds up through different market cycles. For you, aiming for 10-15 years of data is a good goal. This gives you a much better chance of seeing how things perform in bull markets, bear markets, and those choppy, sideways periods.
But if you're a day trader, your focus is entirely different. You're looking at patterns that unfold over minutes or hours. In that case, one to two years of clean, high-frequency data—like 5-minute or 15-minute charts—is usually plenty.
The real key is using enough data to cover the different kinds of market weather your strategy is likely to encounter. If you use too little, you might accidentally build a strategy that only works in one specific, short-lived market condition.
And remember, the quality of your data is just as important as the quantity.
The Profit Factor is a powerhouse metric in any backtest. It’s a simple calculation: just divide your total gross profit by your total gross loss. Any number over 1.0 means you were profitable during the test.
So, what’s a good number?
But context is king here. A strategy with an eye-popping Profit Factor of 3.5 from only 12 trades is way less convincing than a strategy with a 1.7 Profit Factor generated over 500+ trades. A bigger sample size gives you much more confidence that the results aren't just a fluke. Always look at this number alongside your total trades and max drawdown to get the full story.
Yes, absolutely. It's crucial to understand why this happens. A great backtest is a fantastic sign, but it’s a simulation of the past, not a guarantee of the future.
There are a few classic reasons why a winning strategy can fall flat in the live market:
This is exactly why forward testing (or paper trading) is so important. It’s the bridge between a good backtest and putting your hard-earned cash on the line. It tests you and your ability to follow the plan when things get real.
Ready to stop guessing and start making data-driven decisions? With EzAlgo, you get access to a powerful suite of trading tools designed to give you a clear edge. Our indicators help you spot high-probability setups, automate key analysis, and execute your strategy with more confidence.


%201.svg)