


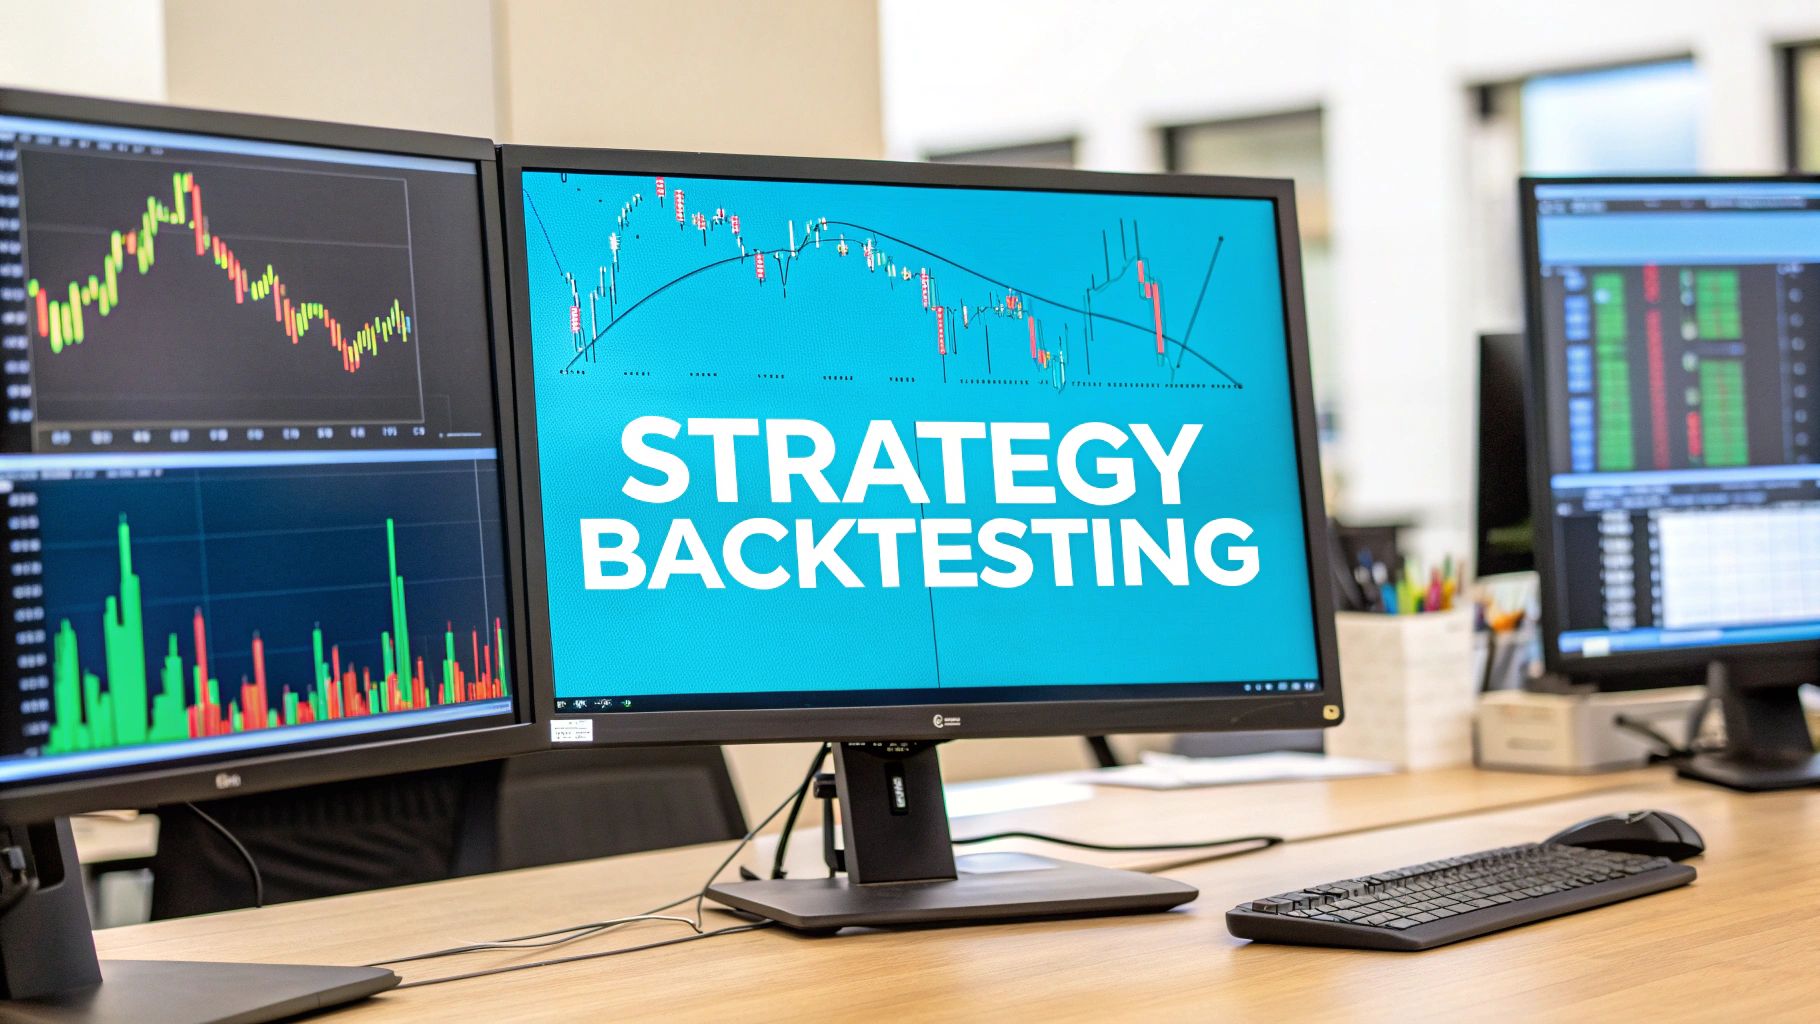
Before you ever dream of putting real money on the line, you have to ask one simple question: Does my trading strategy actually work? This is where trading strategy backtesting becomes your most valuable tool. It’s a simulation, a way to run your strategy against past market data to see how it would have performed.
For any serious trader, this isn't optional. It's an absolute must.
Think of it like a flight simulator for your trading plan. Pilots spend hundreds of hours in a simulator before they ever touch the controls of a real jet. Backtesting is your simulator. It lets you test-drive your strategy through every imaginable market condition—soaring bull runs, gut-wrenching bear markets, and those frustrating sideways grinds—all without risking a single penny.
This process is what separates guessing from evidence-based trading. You stop relying on gut feelings and start building a system grounded in cold, hard data.
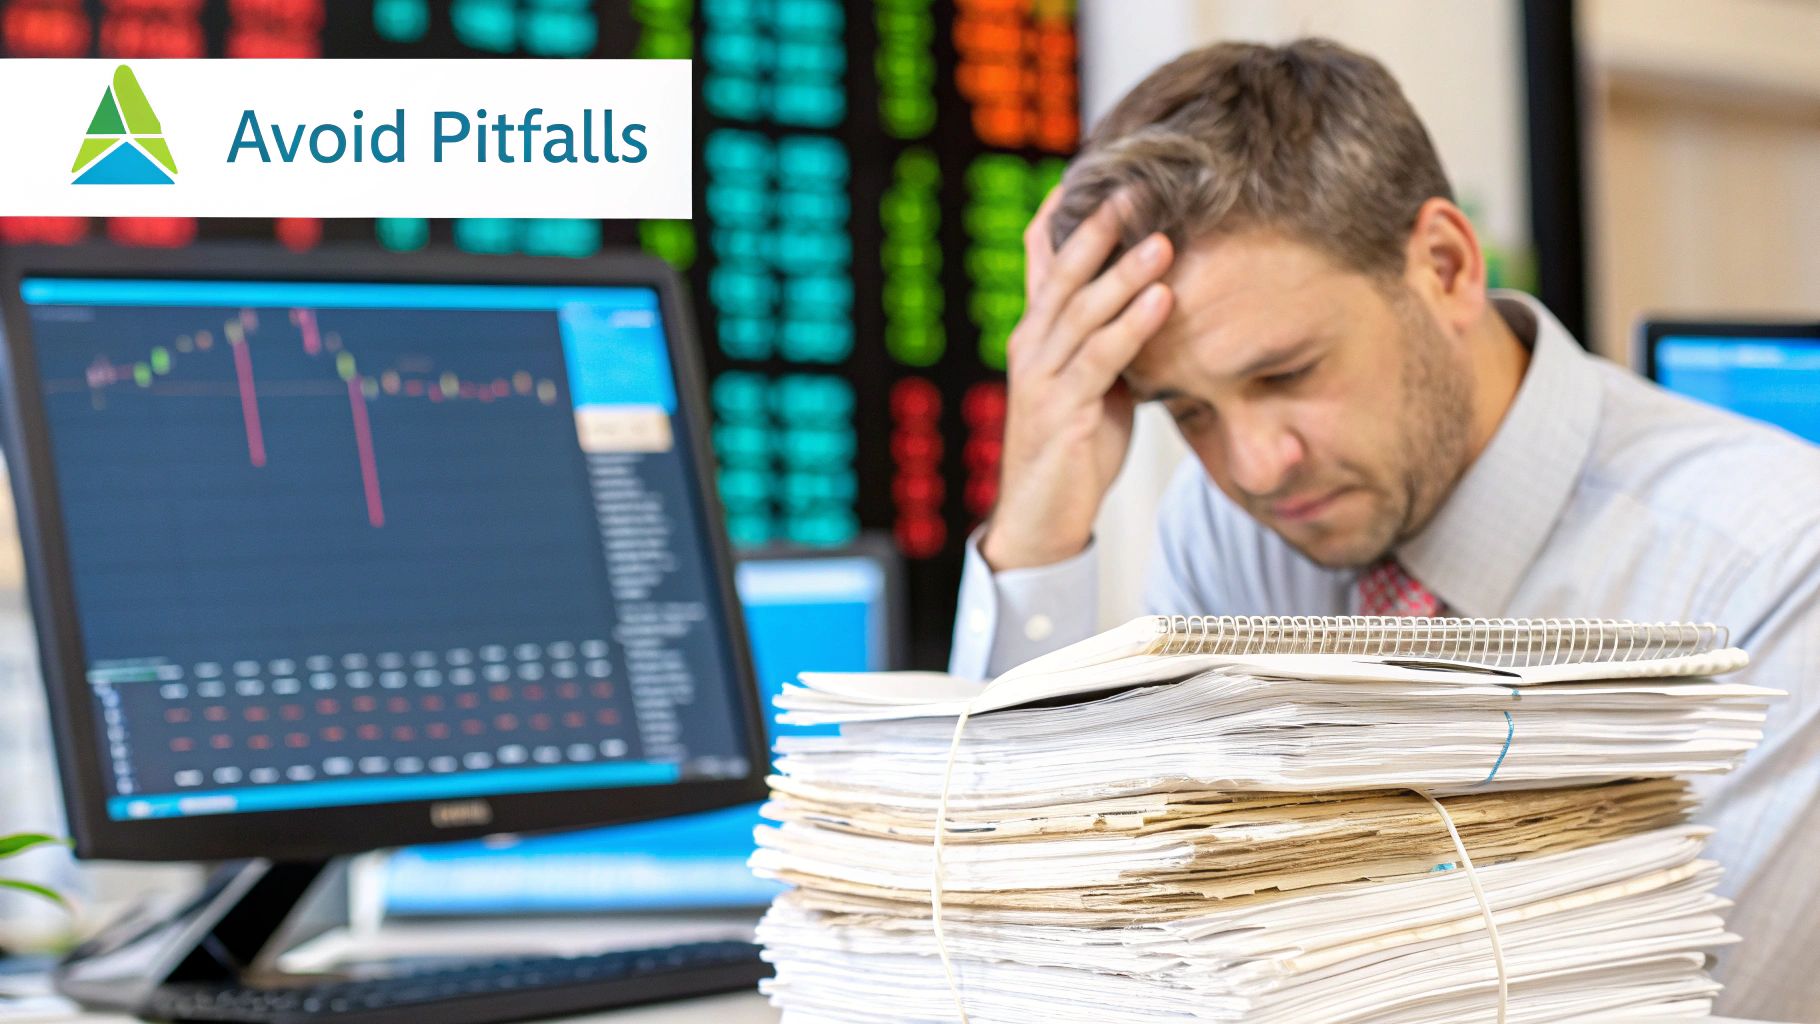
One of the biggest eye-openers from a proper backtest is a clear, numerical picture of your strategy's risk. It forces you to look past the exciting profit potential and face the harsh reality of trading.
A critical number you’ll uncover is the maximum drawdown. This shows you the biggest drop your account would have suffered, from its peak to its lowest point. This isn't just a random statistic; it’s a preview of the pain you might have to endure. If your backtest reveals a 40% drawdown, you have to be honest with yourself: could you really watch your account shrink by that much and not panic-sell?
On the flip side, a solid backtest builds incredible confidence. When you hit a losing streak in live trading—and you will—having data that shows your strategy has weathered and recovered from similar slumps is what gives you the steel to stick to the plan.
A good backtest spits out a report full of metrics. While net profit grabs the headlines, the real story is in the details. Before diving in, it helps to understand what the most important metrics are telling you about your strategy.
Here’s a quick rundown of the core metrics you'll see and what they actually mean for your trading.
These numbers, when looked at together, paint a complete picture. They help you understand not just if a strategy works, but how it works—its strengths, its weaknesses, and its personality.
The core idea is simple: You're using the past to make an educated guess about the future. By analyzing these metrics, you can forecast potential returns and, more importantly, prepare for the inevitable bumps along the way.
Of course, the quality of your backtest hinges entirely on the quality of your data. Simulating a strategy is only meaningful if the historical data is accurate—every price, every timestamp, and every cost must be realistic. Even a tiny error can create what’s known as "look-ahead bias," where your simulation accidentally trades on information that wasn't available at the time, giving you a dangerously false sense of confidence.
Ultimately, a rigorous backtesting process is what allows you to refine your ideas into a robust, road-tested trading plan. If you want to explore this topic further, our guide on various approaches to backtesting trading strategies is a great next step.
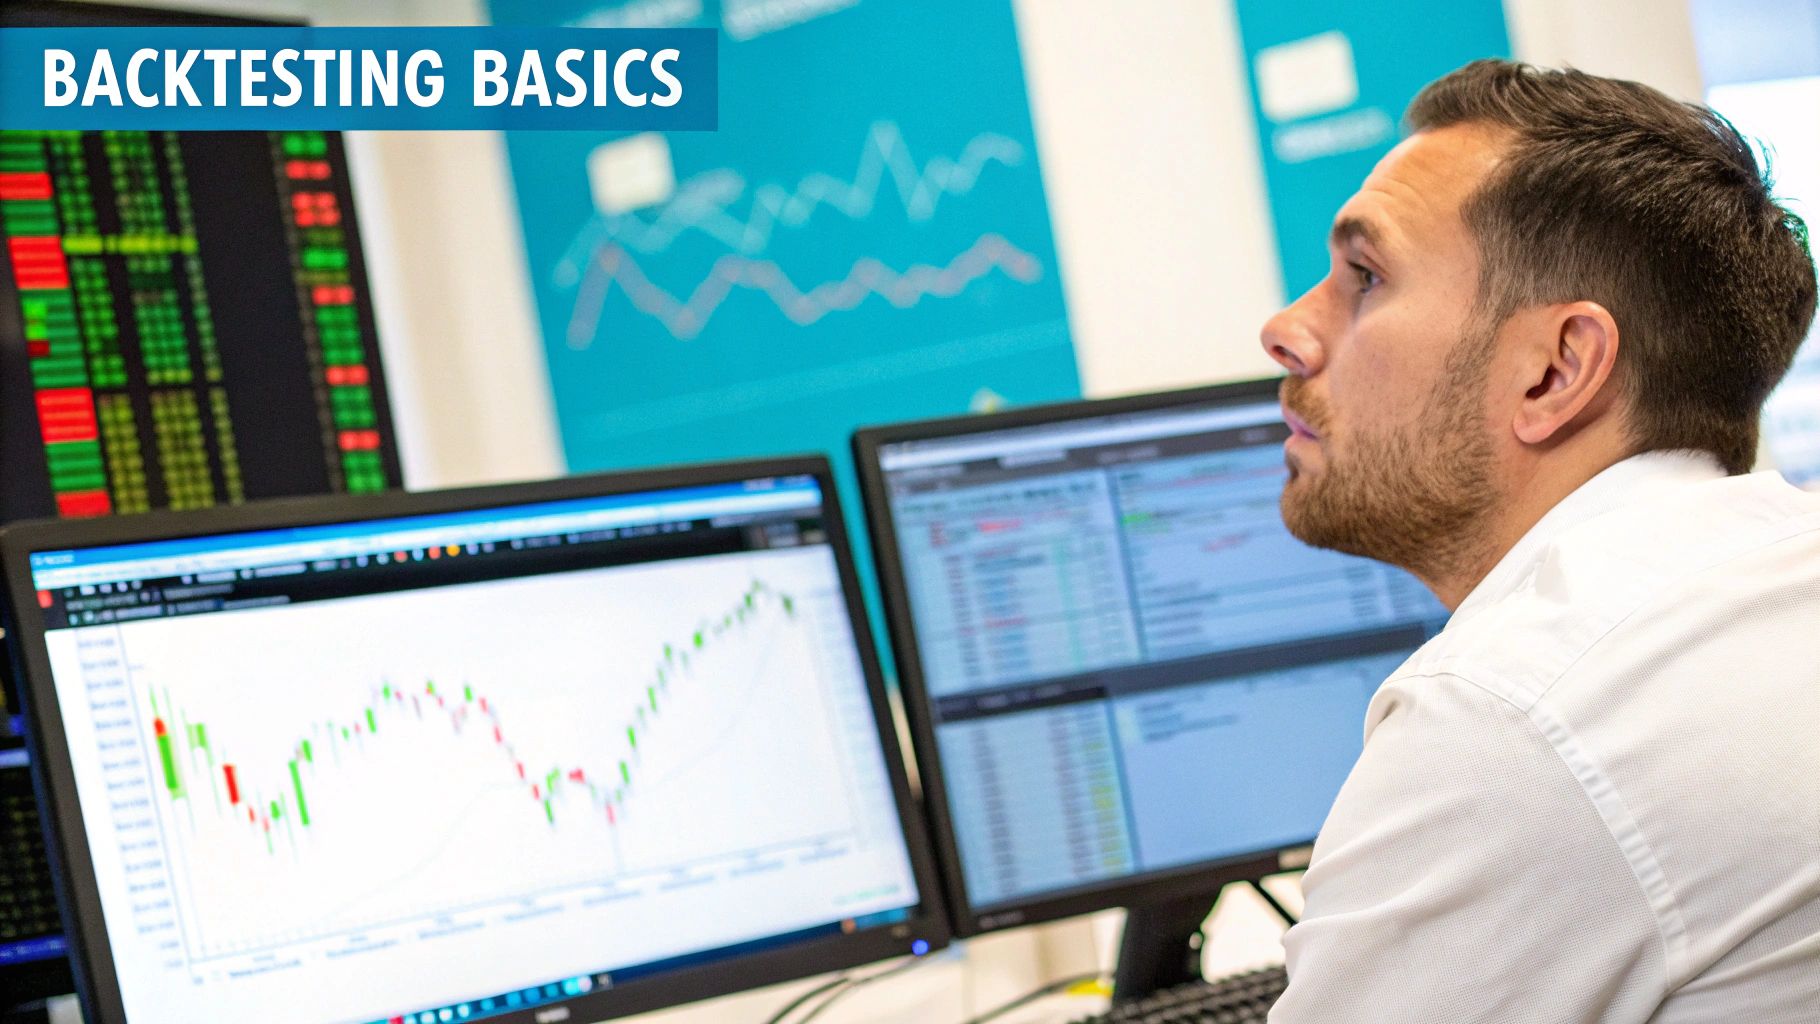
Before you can ever hope to see if a trading strategy works, you have to get your workshop in order. This isn't just about picking some software. It’s about building a solid framework, and the absolute most critical piece of that framework is clean, reliable historical data.
Seriously, without good data, you're just fooling yourself. Any results you get will be completely meaningless. Think of it like this: if your foundation is cracked, the house you build on top of it is doomed. Bad data is a cracked foundation, giving you a distorted, funhouse-mirror view of your strategy's potential.
Your first big decision is where you'll get your historical data. You really have two main options: free or paid.
For anyone serious about trading, high-quality data isn't just an expense—it's a crucial investment in your entire trading strategy backtesting process.
Once you've got your data sorted, you need the right tools for the job. What you choose here really boils down to your technical skills and how complex your strategy is.
For most people, a platform like TradingView is the perfect place to start. It comes with a built-in Strategy Tester that makes it dead simple to apply a strategy to a chart and see how it would have performed. It's visual, easy to use, and you don't need to know any code.
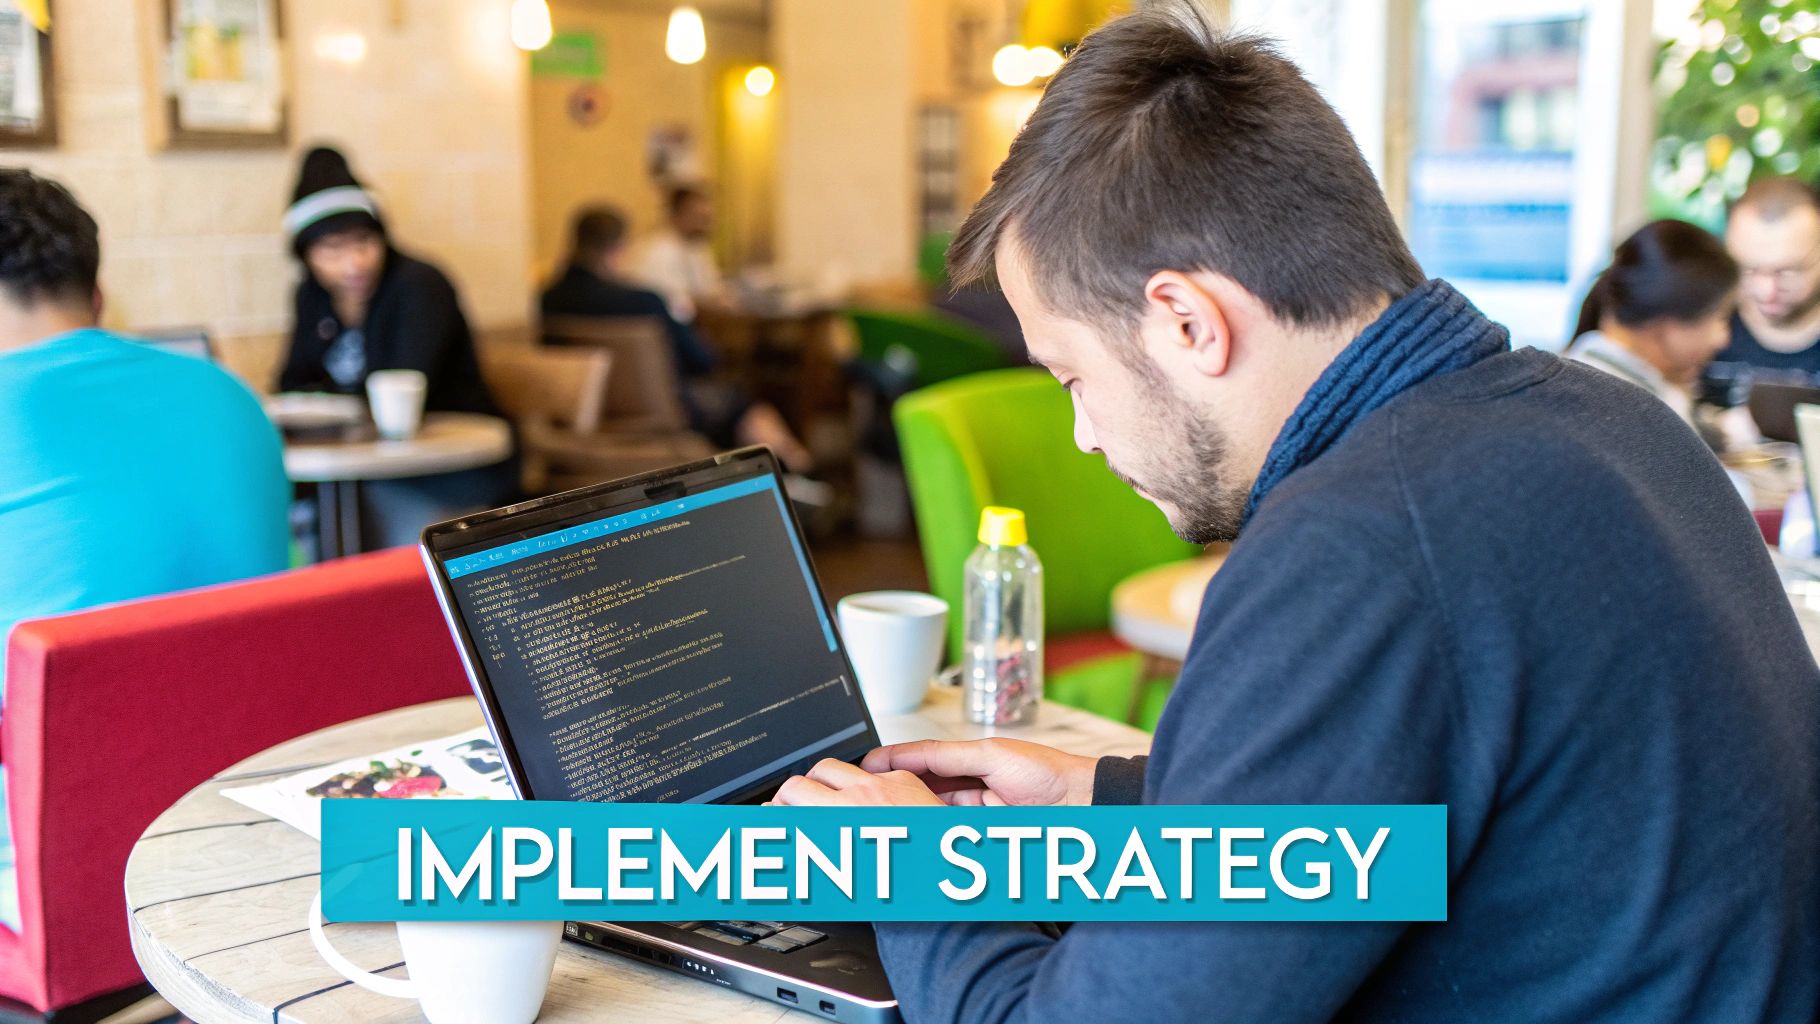
If you're a more advanced trader, you might want to build a custom setup using a programming language like Python. This route gives you total flexibility to build incredibly complex strategies and run deep statistical analysis. But be warned: it requires serious coding skills and has a much steeper learning curve.
My Advice: Start with TradingView. Get the hang of the backtesting process and master the fundamentals there. Only when you start hitting its limits should you even think about moving to something more complex like Python. Don't make it harder than it needs to be from day one.
This is the exact spot where most aspiring traders trip up. An idea like "buy when the RSI is low" isn't a strategy; it's a vague wish. You need to pin down every single rule with military precision. This is the only way to ensure your tests are repeatable and the results are valid.
This kind of precision is the heart of quantitative trading. Backtesting is all about sifting through historical data to find real, consistent patterns. Without this rigor, you're just gambling. In fact, empirical evidence shows that up to 75% of new trading algorithms fail when they hit live markets, usually because they weren't properly validated. To learn more about this validation process, you can find a solid guide on how investment strategies are validated with historical data on financialmodelingprep.com.
Your strategy definition must clearly state:
This whole process turns raw market noise into something you can actually test.
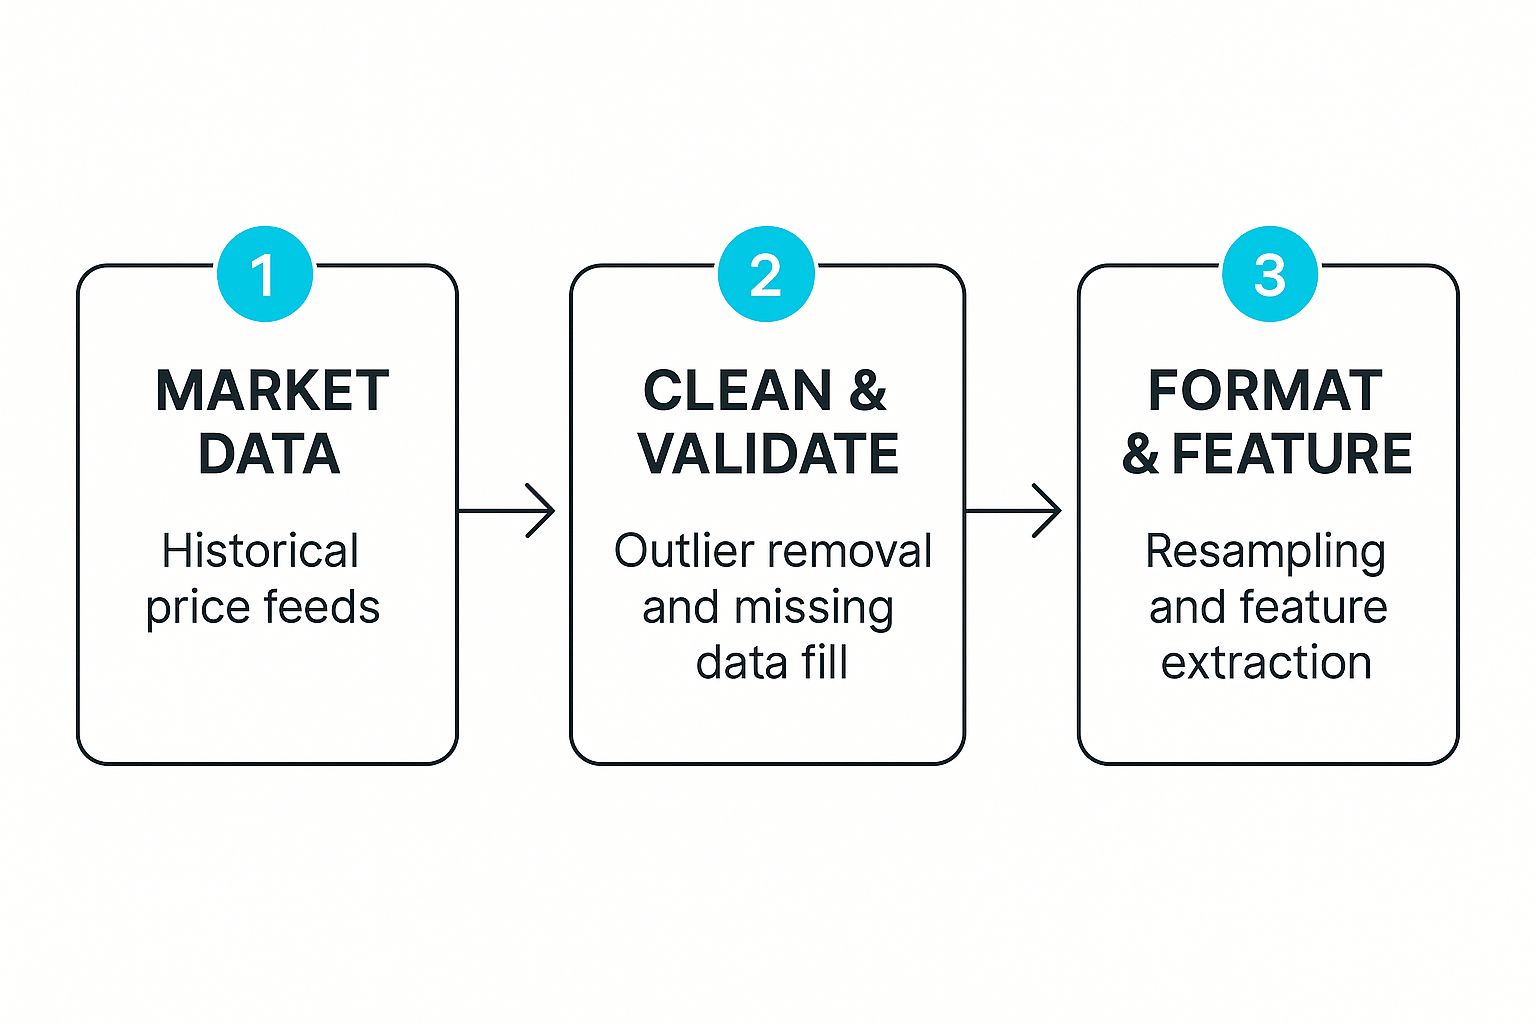
As the image shows, just getting raw data is the easy part. The real work is in cleaning, validating, and structuring it. That’s how you build a backtesting environment you can actually trust.
Alright, theory is great, but now it's time to actually do something. Let's fire up TradingView and run our first real backtest. The good news is you don't need a degree in computer science to get started. TradingView’s interface is surprisingly intuitive, making it one of the best places for traders to get their feet wet with backtesting.
This screenshot shows the Strategy Tester Performance Summary. Get used to this view—it’s where you'll be spending a lot of time. This is your command center for judging if a strategy has any promise, with a quick look at core metrics like net profit, drawdown, and the all-important profit factor.
First things first, you need a strategy on your chart. TradingView comes loaded with a library of them. Just click the "Indicators, Metrics & Strategies" button at the top of your chart, then flip over to the "Strategies" tab. For this walkthrough, let's grab a classic like the "MACD Strategy."
The moment you add it, a "Strategy Tester" panel will pop up at the bottom of your screen. This is where the magic happens.
Before you get too excited and let it run, we need to configure the test. This is a critical step. Just running a strategy on its default settings is a rookie mistake because those defaults almost never match real-world trading conditions.
You can get to the settings by clicking the little gear icon next to the strategy's name on your chart or inside the Strategy Tester panel.
You’ll land on the "Inputs" tab first. This is where you can play with the strategy's core logic. For our MACD example, you can adjust the lengths for the fast line, slow line, and signal line. Fiddling with these numbers helps you understand how sensitive the strategy is to small changes.
But the real meat is in the "Properties" tab. Getting this part right is what separates a realistic simulation from a fantasy. Here’s what you absolutely must configure:
Don't ever skip the "Properties" tab. I've seen countless backtests that looked amazing on paper turn into money pits once realistic costs like commissions and slippage were factored in. This is what separates professional analysis from wishful thinking.
Once your settings are locked in, TradingView automatically crunches the numbers on the historical data loaded on your chart. The Strategy Tester then spits out a report with three key tabs:
By going through each of these tabs, you're doing more than just checking for a profit. You're getting to know the personality of your strategy—its quirks, its strengths, and, most importantly, its weaknesses. That deep understanding is the entire point of running a backtest in the first place.
Running a backtest is the easy part. The real work—and where good traders separate themselves from the pack—is in reading the story the numbers are telling you.
Seeing a positive net profit is great, but it barely scratches the surface. To know if you have a genuinely robust strategy or just got lucky on a few trades, you need to dissect the results like a seasoned pro.
Before you dive into any numbers, look at the equity curve. This graph shows your account balance over the entire backtest period.
Ask yourself: is it a smooth, steady climb, or does it look like a terrifying rollercoaster? A jagged, volatile curve, even if it ends in profit, signals that you’re in for a stressful ride. A smoother curve, on the other hand, points to more consistent and predictable performance. This visual check gives you an immediate gut feeling for the strategy's personality.
Once you have a feel for the strategy's temperament, it's time to dig into the numbers that reveal the true risk and reward. The two most important metrics, right after net profit, are maximum drawdown and profit factor.
Maximum Drawdown (Max DD): This is arguably the most critical risk metric. It shows you the single largest drop your account would have suffered, from its peak to its lowest point. If your backtest shows a 35% max drawdown, you have to be brutally honest with yourself: could you actually stomach watching your account value shrink by that much without panicking and pulling the plug? This number prepares you for the real financial and emotional pain a strategy can inflict.
Profit Factor: This is a simple but powerful ratio. It measures how much money your strategy made for every single dollar it lost. It’s calculated by dividing your total profits by your total losses. A profit factor of 1.0 is breakeven. Anything below that, and you have a losing strategy. Generally, a profit factor above 1.5 is considered good, and anything over 2.0 is excellent. It shows your wins are consistently overpowering your losses.
A strategy with a lower net profit but a smaller drawdown and a higher profit factor is often far better than one with a huge profit but a gut-wrenching 50% drawdown. The first is sustainable; the second is a recipe for blowing up an account.
The performance summary gives you the headlines, but the trade log is where the real detective work happens. This is where you can uncover the hidden patterns that explain why your strategy performs the way it does.
Get granular and scrutinize the log to answer these questions:
This level of detail is a cornerstone of building successful algorithmic trading strategies. When you understand not just if your strategy works but how and when it works best, you’re no longer just testing—you’re actively refining and improving.
Finally, to compare different strategies on an apples-to-apples basis, professional traders turn to risk-adjusted return metrics like the Sharpe Ratio.
The Sharpe Ratio tells you how much return you’re getting for the amount of risk (measured by volatility) you're taking on. A higher Sharpe Ratio is always better because it means the performance is more efficient.
If you’re comparing two strategies with similar net profits, the one with the higher Sharpe Ratio is the superior choice. It achieved those returns more smoothly and with less risk. It's how you objectively decide if the potential rewards truly justify the risks involved.
Here's a hard truth I've learned over the years: a bad backtest is far more dangerous than no backtest at all. It wraps you in a false sense of security, pushing you into the live market with a strategy that’s secretly doomed to fail.
Getting good at trading strategy backtesting means learning to spot these account-killers. They’re masters of disguise, making a terrible strategy look like a genius move on paper, only to watch it crumble the moment real money is at stake. Let’s pull back the curtain on the most common culprits.
The biggest and most common trap is overfitting, which is sometimes called curve-fitting. This is what happens when you tweak your strategy so much that it perfectly explains the past. You’ve accounted for every little wiggle in your historical data, but in doing so, you've made it totally useless for the future.
Think of it like tailoring a suit to fit a store mannequin down to the last millimeter. It looks absolutely flawless on that specific, static model, but it won't fit any real, moving person. That's an overfitted strategy. It’s a work of art on one specific dataset but has zero ability to adapt to the chaos of a live market.
How do you fight it? Keep your strategy simple. If your system has a dozen complex rules and finely-tuned parameters, that’s a massive red flag. The most robust strategies I’ve seen usually rely on just a few clear, logical rules.
Key Takeaway: The goal isn't to create a perfect backtest report. The goal is to find a robust strategy that works well enough across different market conditions, not perfectly on just one.
Look-ahead bias is like getting a copy of the test answers before you sit the exam. This happens when your backtest uses information that wouldn't have actually been available at the moment of the trade. It’s a surprisingly easy mistake to make, especially if you’re coding your own tests.
A classic example is using the day's closing price to trigger a buy signal at the market open. At 9:30 AM, you have no way of knowing what the price will be at 4:00 PM. But if your code isn't careful, it can "peek" at that future data, giving you impossibly good results.
Another place this hides is in adjusted historical data. Data is often back-adjusted for things like stock splits and dividends. If not handled correctly, your system might trade based on knowledge of a future split—information that wasn't public at the time.
To avoid this, you have to be militant about ensuring your platform only uses data available at that precise moment. Good platforms like TradingView are built to prevent this, but it’s something you must always be aware of, especially with custom setups.
Survivorship bias is a more subtle but equally venomous error. It makes historical performance look way better than reality because your test only includes assets that are still around today. It conveniently ignores all the companies that went bankrupt, got acquired, or were delisted.
Imagine you test a stock-picking strategy on the current S&P 500 components, running it over the last 20 years. Your test would miss spectacular failures like Enron or Lehman Brothers, which were once in the index. By testing only the "survivors," you've systematically filtered out all the losers, which will make your returns look amazing.
The only real fix is to use a high-quality, point-in-time historical dataset. This kind of data shows you exactly what an index or market looked like on any given day in the past, including all the companies that eventually went under.
Building a solid backtest comes down to disciplined thinking. You need to actively hunt for these flaws before they cost you money. To help, I’ve put together a quick cheat sheet for the most common biases and how to defend against them.
Ultimately, a reliable trading strategy backtesting process is built on a foundation of healthy skepticism. Question every great-looking result. Look for the hidden flaws. Stress-test your ideas against these common biases. This discipline is what separates a hopeful gambler from a prepared trader.
When you first dive into backtesting a trading strategy, you're bound to run into a few questions and hurdles. It's just part of the process. Getting solid answers to these common sticking points is key to building the confidence you need to trust your results.
Let's walk through some of the questions I hear most often from traders.
This is probably the biggest question out there, and the honest answer is: it depends. There’s no single right answer because the amount of data you need is tied directly to how often you trade. Someone day trading on a 5-minute chart has very different data needs than a swing trader looking at daily charts.
Here are some good rules of thumb I've developed over the years:
The main goal is simple: get a big enough sample size to see how your strategy behaves in all kinds of market weather. If you use too little data, you risk getting fooled by overly rosy results that fall apart the second the market changes its tune.
People often use these terms interchangeably, but they are two very different—and equally important—parts of the testing process.
Think of backtesting as a lab experiment. It’s a pure, data-driven look at the past. You’re running your strategy against historical data to see if the core idea even works, crunching thousands of potential trades in seconds to spit out performance stats. It's all about the numbers.
Paper trading, on the other hand, is like a dress rehearsal. It’s a real-time simulation where you "place" trades as the market moves. This is where you test yourself. Can you actually follow your strategy's rules when real-time prices are flying around and your emotions kick in?
Backtesting tells you if the strategy has an edge. Paper trading tells you if you can execute that strategy. You absolutely need to do both before a single real dollar is on the line.
It's a great feeling to see a backtest report with incredible numbers. But hold on—don't rush off to fund your live account just yet. That glowing report is your signal to move on to the next critical step: forward testing.
You need to paper trade your strategy for at least one to three months. No exceptions. This is your chance to see if the backtest results hold up in the current market, which is always changing.
More importantly, this is a test of your own discipline. It’s one thing for a computer to follow rules; it’s another for you to do it when the pressure is on. If the strategy still looks good after a few months of paper trading and you've proven you can stick to the plan, then you can think about going live—and even then, start with a small, manageable amount of risk.
Ready to stop guessing and start testing? EzAlgo gives you a whole suite of indicators and tools on TradingView to find a clear, data-driven edge. You can simplify your analysis and build real confidence in your trading with automated signals and real-time insights.


%201.svg)