


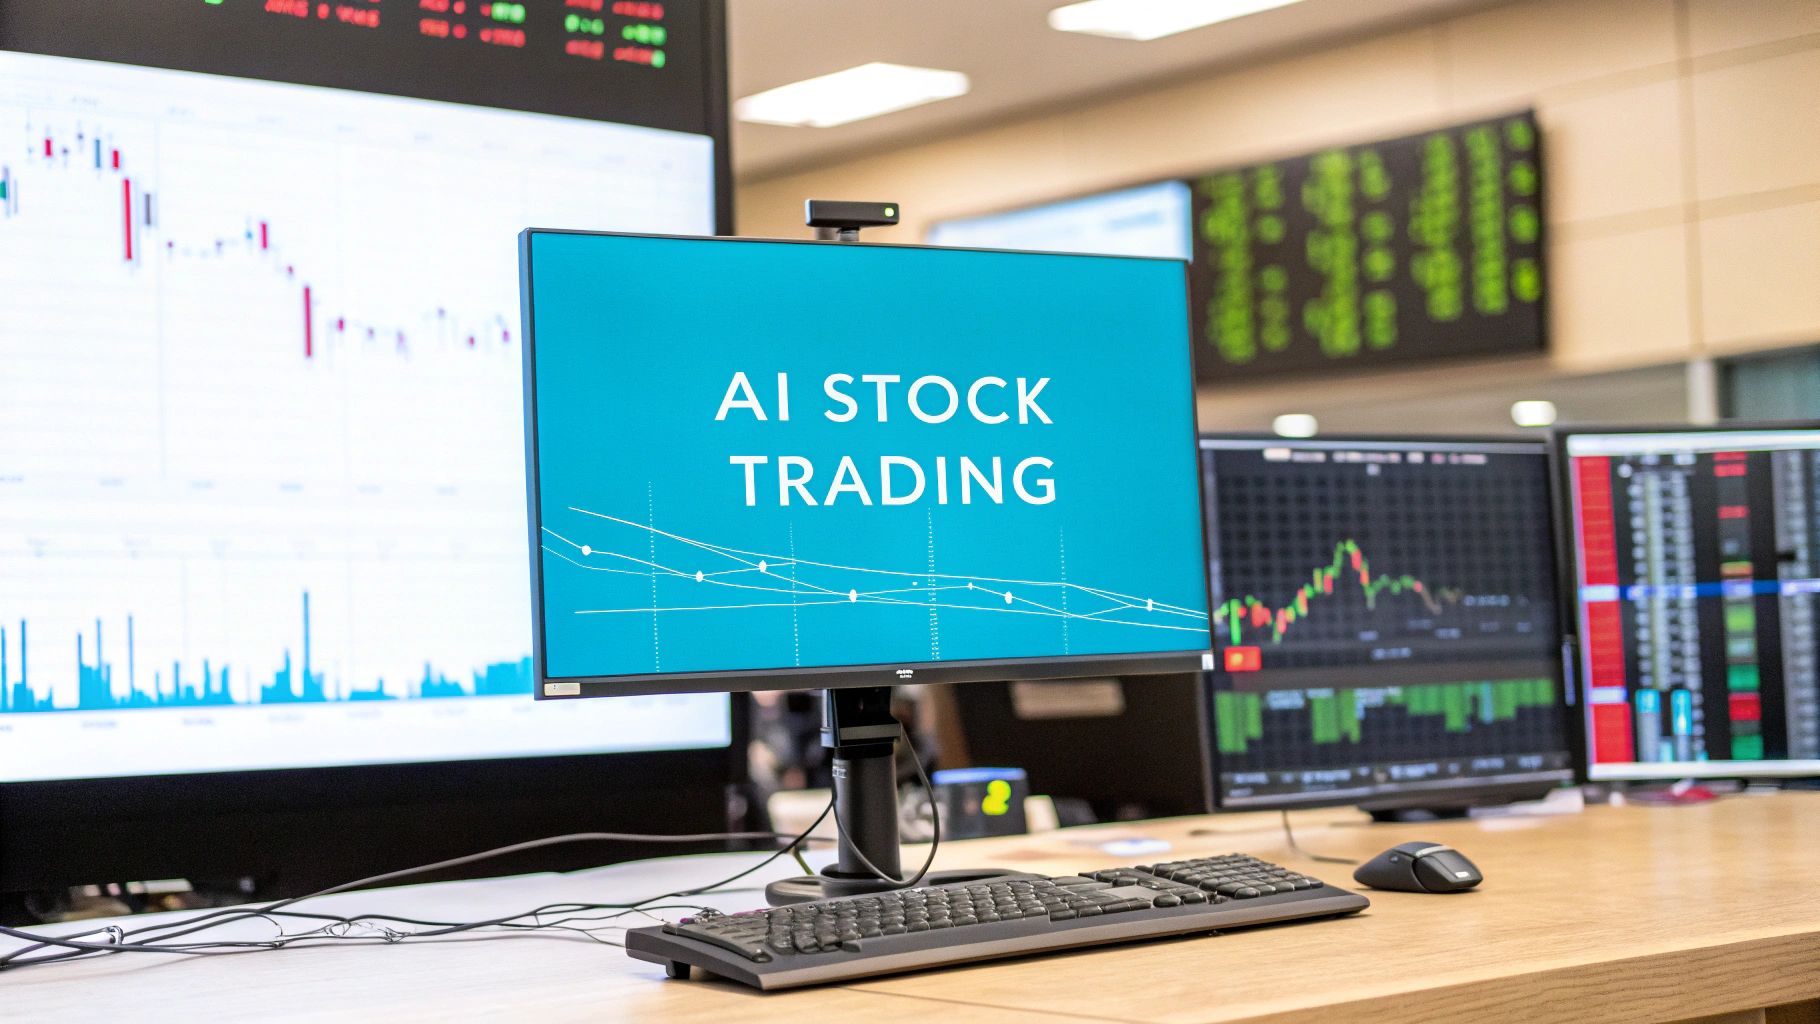
So, you're wondering how to use AI for stock trading? The simplest and most direct way is to bring AI-driven indicators, like the ones from EzAlgo, right into your TradingView charts. You don't need to be a coding whiz. Instead, you get clear, data-backed signals that act as a co-pilot, helping you spot market patterns and high-probability setups.
It’s easy to think that using AI in trading means letting a robot take over. That's a common myth. The reality is much more of a partnership. For the everyday trader, AI is an analytical sidekick, constantly sifting through market data for patterns, momentum shifts, and potential reversals that the human eye might miss.
Think of it as enhancing your trading style, not replacing it. You’re still the one calling the shots, but now your decisions are supported by objective, data-driven analysis. This is a game-changer for filtering out the emotional noise—like greed and fear—that can wreck your judgment when the market gets wild.
AI's footprint in finance is growing fast. This isn't just a fleeting trend; it’s a real shift in how traders and investors analyze the markets and make their moves. You can see just how serious it is by looking at where the money is going.
Globally, the value of AI deals shot up by 52%, from $86.3 billion in 2023 to $131.5 billion in 2024. That’s a massive amount of capital flowing into AI innovation, and trading technology is a big piece of that pie. If you want to dive deeper, you can explore the AI investment landscape for 2025.
This boom gives individual traders access to tools that were once the exclusive domain of big Wall Street firms. Platforms like TradingView have leveled the playing field, letting anyone plug powerful algorithms directly into their workflow.
The TradingView interface is basically your canvas. It's where you'll add AI indicators like EzAlgo to see the insights overlaid on live market action.
This setup is perfect because it combines familiar price charts with a massive library of tools, creating the ideal environment to merge your strategy with AI-driven signals.
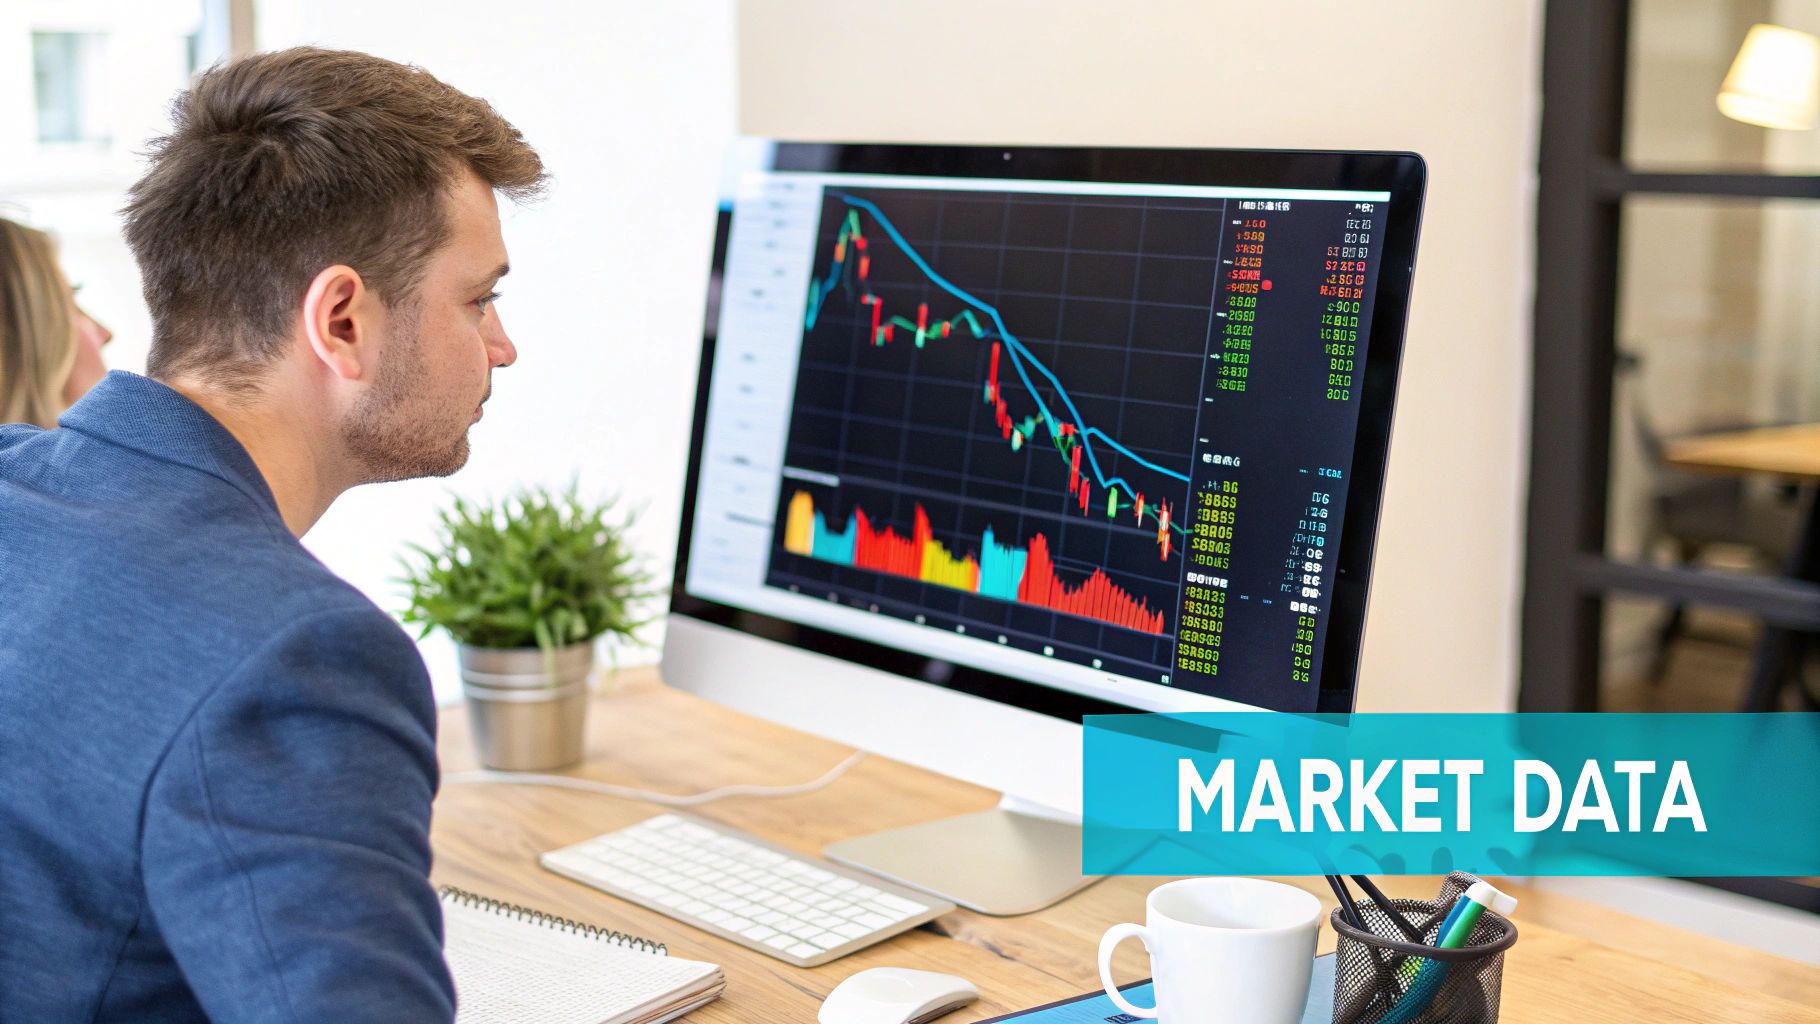
Okay, so what really happens when you add a tool like EzAlgo to your chart? The algorithm is crunching enormous amounts of data in real-time, looking at things a human trader simply couldn't track all at once.
This includes:
The real goal here is to shift from reactive trading—where you're just responding to what already happened—to proactive trading. AI offers a more forward-looking perspective, helping you anticipate what might happen next instead of just chasing the price. It gives you a much clearer, more objective view of what's driving the market.
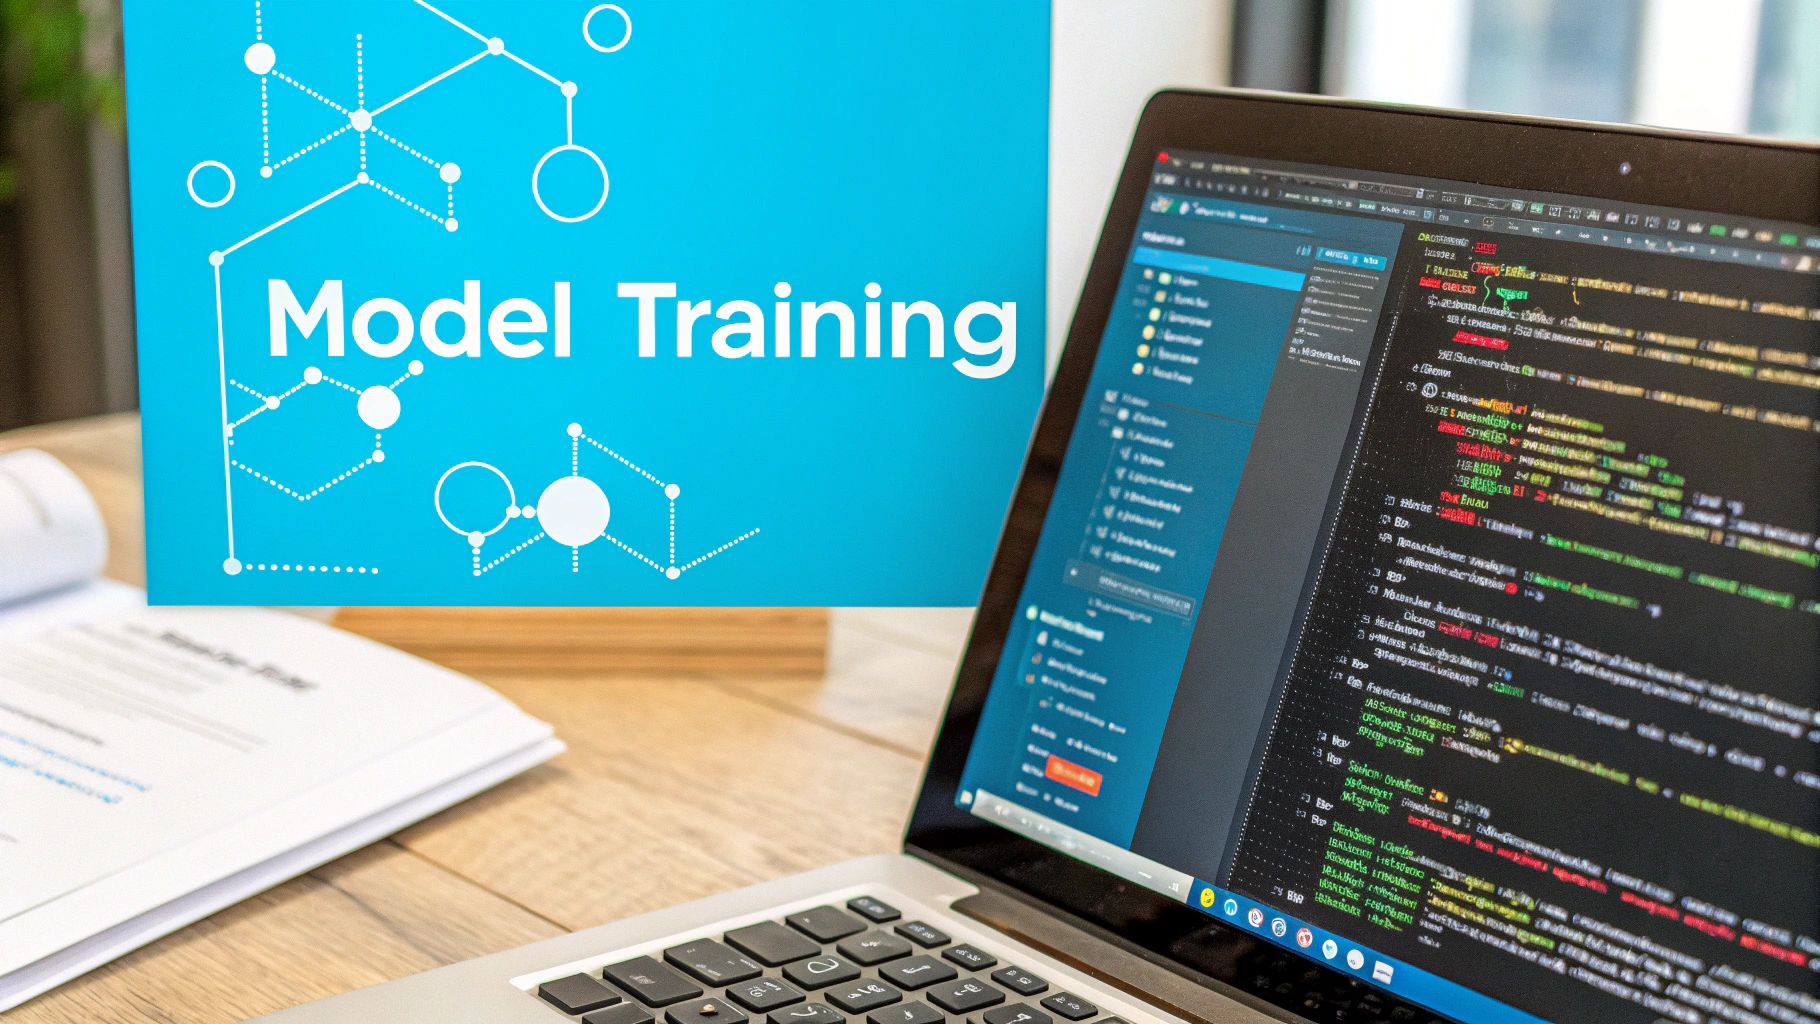
Alright, before we dive into making trades, let's get your digital workspace set up. Think of this as preparing your cockpit. It's a quick process and you don't need to be a tech wizard—it's all about getting EzAlgo's powerful AI indicators onto your TradingView charts. This is where the magic happens.
First thing's first: you need a TradingView account. If you don't have one, setting it up is free and only takes a minute. This platform will be your command center, where you’ll see the AI insights overlaid directly on the price charts of any stock, crypto, or forex pair you're watching.
Once you’re logged into TradingView, the next step is to connect EzAlgo. After you’ve subscribed to an EzAlgo plan, you'll get access to their private, invite-only indicators. Getting them on your chart is simple: just click the "Indicators" tab, head over to the "Invite-only scripts" section, and select the EzAlgo tools. They'll pop up on your chart, ready to go.
With the indicators loaded, it's time to make a few tweaks. The default settings are a fantastic starting point, but dialing them in to match how you trade can make all the difference. Don't think of this as complex configuration; it's more like adjusting the seat and mirrors in a new car before you hit the road.
When you open the EzAlgo settings, you’ll see a few key options. The two you'll want to get familiar with right away are sensitivity and timeframe settings.
I usually tell new users to start with the sensitivity at its default medium setting and turn on one higher timeframe for confirmation. It’s a balanced approach that cuts through a lot of market noise without leaving you on the sidelines for major moves.
The goal here is to experiment. Find a setup that feels right and works with your personal risk tolerance. What a day trader needs on a 5-minute chart is completely different from what a long-term investor wants on a daily chart.
As you get more comfortable with how the AI signals behave, you can start playing with the more advanced settings. But for now, a simple, balanced setup is the best way to get a feel for interpreting the signals accurately.
The EzAlgo dashboard keeps everything clean and manageable right on your TradingView chart.
As you can see, the indicators blend in smoothly, giving you clear signals without making your analysis space feel cluttered.
Now that your tools are installed and configured, you're ready to do the real work. Getting this initial setup right is the most important part of shifting from standard charting to AI-assisted trading. You've just laid the foundation for a much more objective, data-first approach.
You now have the tools to spot patterns and opportunities that are often completely invisible in the noise of raw market data. For traders who want to take this even further, the next logical step is to explore automation. While this guide is focused on using AI as your analytical co-pilot, you can learn more about automated trading strategies that actually work in our detailed guide to see where these concepts can lead.
With your charts now powered by AI, you're ready for the exciting part: learning to read the signals and weave them into your trading decisions.
So, you've got the AI tools plugged into your TradingView chart. Now what? Your screen is probably alive with new information, but it's useless unless you know what it's telling you. Learning to interpret these AI-generated signals is what separates guessing from making informed trading decisions.
It’s tempting to see a ‘Buy’ or ‘Sell’ signal and just jump in, but that’s not the game. Think of the AI as a world-class analyst working for you 24/7. It crunches an insane amount of data—price action, volume, momentum—and gives you its conclusion. That signal is the end result of a complex process, not just a random guess.
A single signal is a hint. Multiple signals, combined with your own analysis, form a strategy.
The most common signals are, of course, for buying and selling. But the best tools, like EzAlgo, give you more than just a simple red or green light. They communicate the conviction behind a potential move, which is far more valuable.
You'll typically see a few different kinds of alerts:
This isn't just theory. A well-known Stanford-led study simulated an AI fund manager rebalancing portfolios over 30 years. The result? The AI beat 93% of its human counterparts, delivering returns that were, on average, six times higher. You can dig into the specifics in the Stanford AI stock analysis research paper. It's a powerful demonstration of how data-driven models can consistently spot patterns humans might miss.
To help you get started, here’s a quick-reference table for deciphering the most common signals you'll encounter with a tool like EzAlgo.
This table is a great starting point, but remember that context is everything in trading.
Let's move from theory to practice. Here’s how these signals play out in live market scenarios.
Scenario 1: The Uptrend Confirmation
Let's say you're watching NVIDIA (NVDA) on the 1-hour chart. The stock is in a solid uptrend but has pulled back to a key support level. You're thinking about getting in, but you're hesitant. Just then, an EzAlgo ‘Strong Buy’ signal flashes.
What just happened? The AI didn't just see the price touch a line. It likely detected a surge in buying volume, a bullish tick in momentum, and confirmed that this bounce aligns perfectly with the larger upward trend. This isn't just a signal to buy; it’s powerful confirmation that the market's underlying flow agrees with your trade idea.
Before a signal ever hits your chart, the AI is busy cleaning and organizing data behind the scenes. This is crucial for getting reliable alerts.
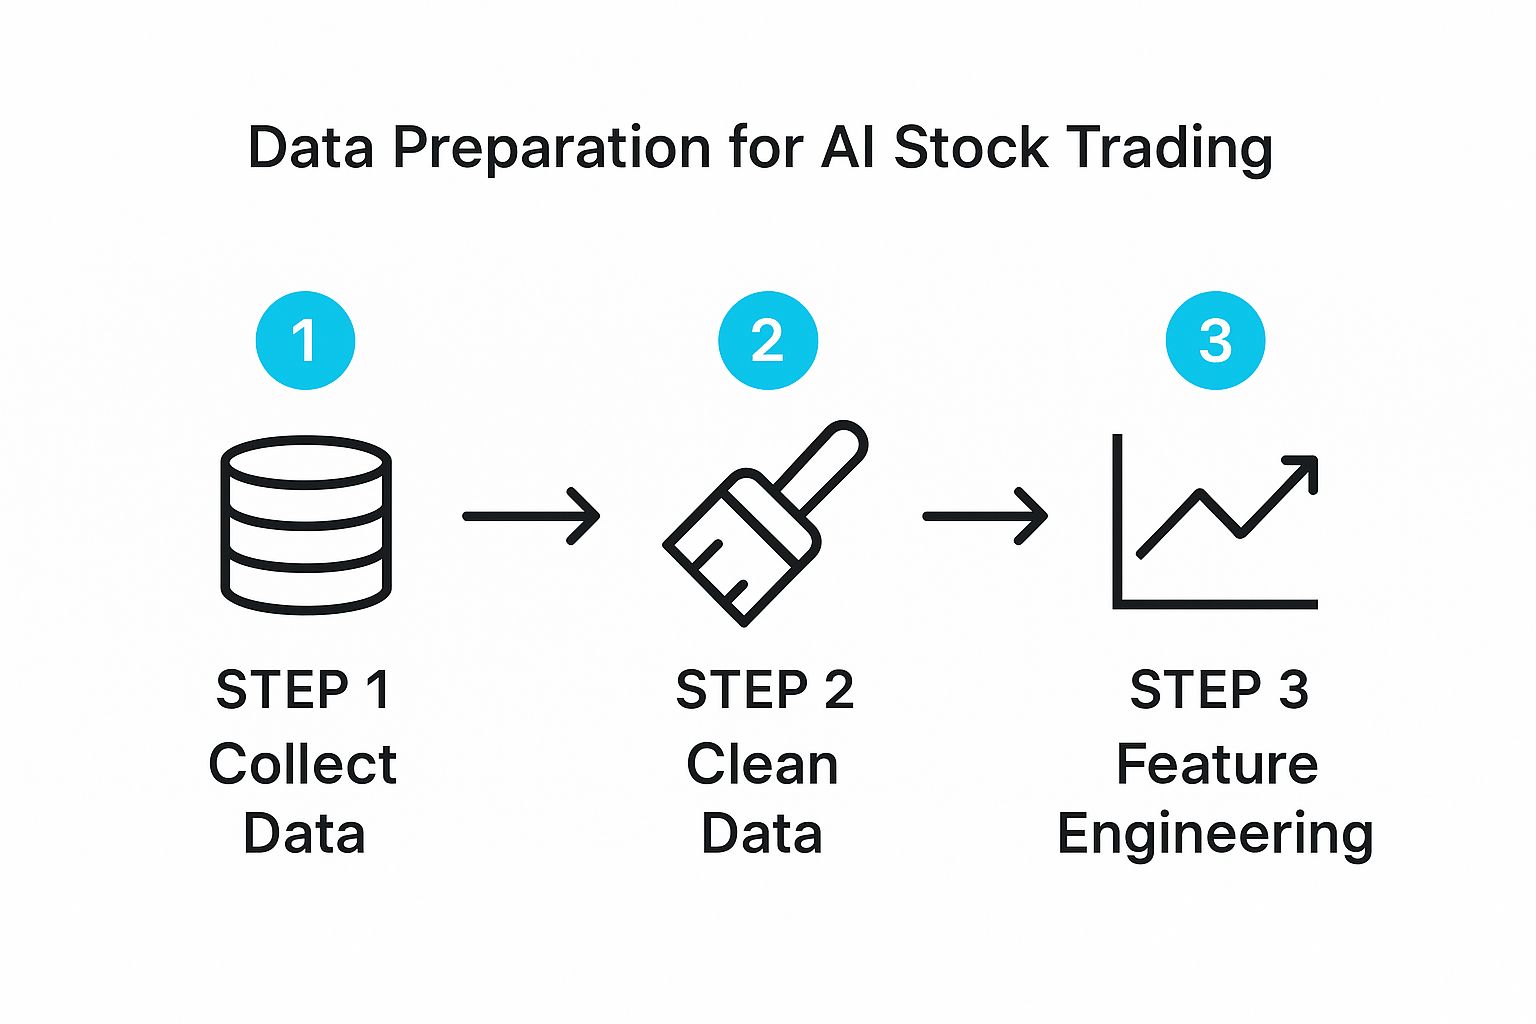
This data preparation is the foundation. Garbage in, garbage out—and good AI ensures it’s only working with quality information.
Scenario 2: The Volatility Reversal
Now for a different market. You’re on the 15-minute chart for a volatile crypto like Solana (SOL). The price has gone parabolic in the last hour, and the feeling is pure euphoria. Suddenly, a ‘Reversal Warning’ appears, even as the price pushes to a new high.
A rookie trader, high on FOMO, would probably ignore it. But the AI is purely objective. It's likely picking up on bearish divergence—the price is making higher highs while momentum indicators are making lower highs. It may also see that this last explosive push is happening on weak volume, a classic sign of exhaustion. This signal isn't a command to short, but it's a critical tap on the shoulder, telling you to protect your profits if you're long or to stay patient if you're looking for an entry.
By understanding the 'why' behind the signal, you move from being a signal-follower to an informed decision-maker. You start using AI not as a crutch, but as a lens that brings hidden market dynamics into sharp focus.
This is the real skill when you're figuring out how to use AI for stock trading. It’s about blending the machine’s number-crunching power with your own strategic judgment to create a smarter, more adaptive trading style.
AI indicators are incredibly powerful, but let's be clear: they aren't a crystal ball. The real magic happens when you start blending the objective, data-driven insights from AI with your own proven trading strategy. This is how you turn a good tool into a great system.
The goal isn't to follow every single alert blindly. It's about using the AI to confirm your own read on the market. Think of it as building a more robust, high-conviction trading plan where you’re still the one calling the shots—you're just much better informed.
In trading, confluence is everything. It's that sweet spot where multiple, independent reasons all point to the same conclusion. When an EzAlgo signal lines up perfectly with your own technical analysis, you’ve found confluence. And you've likely found a high-probability trade setup.
This approach immediately filters out the noise and forces you to be more selective. It stops you from chasing half-baked ideas and makes you wait for those A+ opportunities where your analysis and the AI’s data are in complete agreement.
Let’s say you’ve been watching a stock and have identified a key Fibonacci retracement level on the daily chart. You're anticipating a bounce, but you need that extra push of confirmation before you commit.
Suddenly, a few things happen at once:
That right there is a textbook confluence scenario. The AI signal becomes the final piece of the puzzle, giving you the data-backed confidence you need to act on your trade idea.
One of the best things about using a tool like this is its flexibility. It isn't a rigid, one-size-fits-all system. Instead, you can mold it to fit your specific trading style, whether you're in and out of trades in minutes or holding for weeks.
Here’s how different traders might weave it into their workflow:
As a swing trader, you're looking to capture bigger moves over several days or weeks. Your world revolves around the daily and 4-hour charts, where the major trends live.
For you, an AI signal is a powerful confirmation at key structural points on the chart. You're not concerned with every minor blip. You're waiting for an alert that validates an entry at a major support zone, confirms a breakout from a long consolidation, or signals a trend is ready to continue after a healthy pullback.
A swing trader might see a ‘Buy’ signal as the final green light to enter a position they’ve been stalking for days. It confirms that institutional order flow and market momentum are finally aligning with their own thesis.
If you're a scalper or day trader, you live life in the fast lane on the 5-minute or 15-minute charts. Your game is all about momentum and volatility.
You'll use AI signals to pinpoint those explosive moments and find razor-sharp entry points. A ‘Strong Buy’ signal could be your trigger to jump on a fast-moving trend, while a ‘Reversal Warning’ is your cue to take profits before the party ends. For you, the AI acts as a real-time momentum detector.
The rise of this technology is impossible to ignore. Modern AI allows traders to navigate complex markets with models that adapt on the fly. This trend is set to continue, with AI-driven funds and ETFs becoming more common for both pros and everyday investors. You can discover more about how AI is shaping global markets to get the bigger picture.
The ultimate goal here is to build a hybrid system that marries the best of human intuition with machine intelligence. Your personal analysis provides the why, while the AI provides the when.
Here’s a simple way to think about building your own approach:
Following this process helps you build a trading system that is truly yours—one that's disciplined, systematic, and reinforced by hard data. You're no longer just trading on a hunch; you're operating a refined, intelligent system where every decision is validated.
It’s easy to get caught up in finding the perfect entry. But what really separates the pros from the rest is how they protect their capital. This is where AI becomes your best defensive player, helping you manage risk with data, not gut feelings.
Winning in the markets isn’t about being right every single time. It's about making sure that when you’re wrong, the damage is small. Using AI for risk management helps you sidestep the emotional traps—like fear or greed—that can blow up an otherwise solid strategy.
A static stop-loss is better than nothing, but it’s a pretty blunt tool. Markets are alive and constantly shifting, so your risk management needs to be just as nimble. This is one area where AI signals give you a huge edge.
Let's say you're in a nice long position that's moving in your favor. The trend looks solid, but then an AI-generated ‘Reversal Warning’ pops up on your chart. This isn't a reason to panic; it's a data-driven cue to act intelligently.
Instead of just dumping the whole position, you can make a smarter move:
With this approach, your stop-loss becomes a dynamic shield, reacting to real threats the AI has spotted.
When you use AI-generated reversal alerts to manage your trades, you’re building a system. It turns a gut decision into a rules-based action, which is the secret sauce for long-term consistency.
How much do you risk on any single trade? This decision, your position size, is probably the most critical part of risk management. AI can help here, too, giving you the confidence to press your bets on the best setups and pull back when things look shaky.
EzAlgo indicators often give you a sense of the market’s conviction. When you spot a ‘Strong Buy’ signal that lines up perfectly with your own analysis, it’s a data-backed nod to maybe take a slightly larger position—always within your predefined risk limits, of course.
On the flip side, if the market is choppy and the AI is only spitting out weaker signals, that’s your cue to be more defensive. Maybe you trade smaller, or you just sit on your hands and wait for a true A+ opportunity to come along.
This helps you put your capital to work more effectively, focusing your firepower on the trades that both you and the AI agree have the highest potential. This is a big topic, and for a deeper dive, check out our guide on essential risk management for traders.
At the end of the day, the biggest threat to most traders is themselves. We’ve all been there—letting fear push us out of good trades or greed convince us to hold on way too long. AI is the perfect counterweight because it has zero emotions. It just sees the data.
By relying on these unbiased data points, you build a more disciplined trading framework. You're not just hoping the market goes your way; you're using a powerful tool to build a more resilient and systematic approach to your trading.
Jumping into AI-assisted trading is exciting, but it's natural to have a few questions. For many traders, this is new territory, and getting clear on the details is a smart move. Let's walk through some of the most common things people ask when they start using tools like EzAlgo.
Getting these points sorted out will help you trade with more confidence and make sure you’re getting the most out of these powerful indicators. It’s the final piece of the puzzle before you really start weaving AI into your daily trading.
This is a great question because it hits on the right way to think about how to use AI for stock trading. When your own analysis and an AI signal don't line up, don't see it as a problem. See it as critical information. It’s a bright, flashing sign telling you to pause and take a closer look.
Often, a disagreement like this shines a light on something you might have missed. Maybe you see a perfect bullish chart pattern, but the AI is picking up on a subtle decrease in buying volume that hasn't shown up on your radar yet.
Instead of trying to force a trade, use this as a warning sign. The best, highest-probability trades happen when your analysis and the AI’s signals are in perfect agreement—that's what traders call confluence. If they don't match up, the wisest decision is often to just wait for a better, clearer setup.
Yes, absolutely. The algorithms at the core of these tools are built to analyze price action, volume, and momentum. Those are universal languages spoken in every financial market. Whether you're trading blue-chip stocks, crypto, forex, or commodities, the fundamental patterns of how markets move are remarkably similar.
That said, you’ll definitely need to tweak your strategy based on the personality of the asset you're trading.
The trick is to fine-tune the tool's settings, like its sensitivity, to match the unique behavior of the market you’re in.
Trust isn’t given; it's earned through testing and experience. Let’s be clear: no indicator, whether it’s AI-driven or a classic one, is 100% right all the time. The goal isn't to find a magic bullet. It’s to gain a statistical edge that pays off over the long run.
The reliability of any signal skyrockets when you use it for confirmation, not as a standalone command to buy or sell.
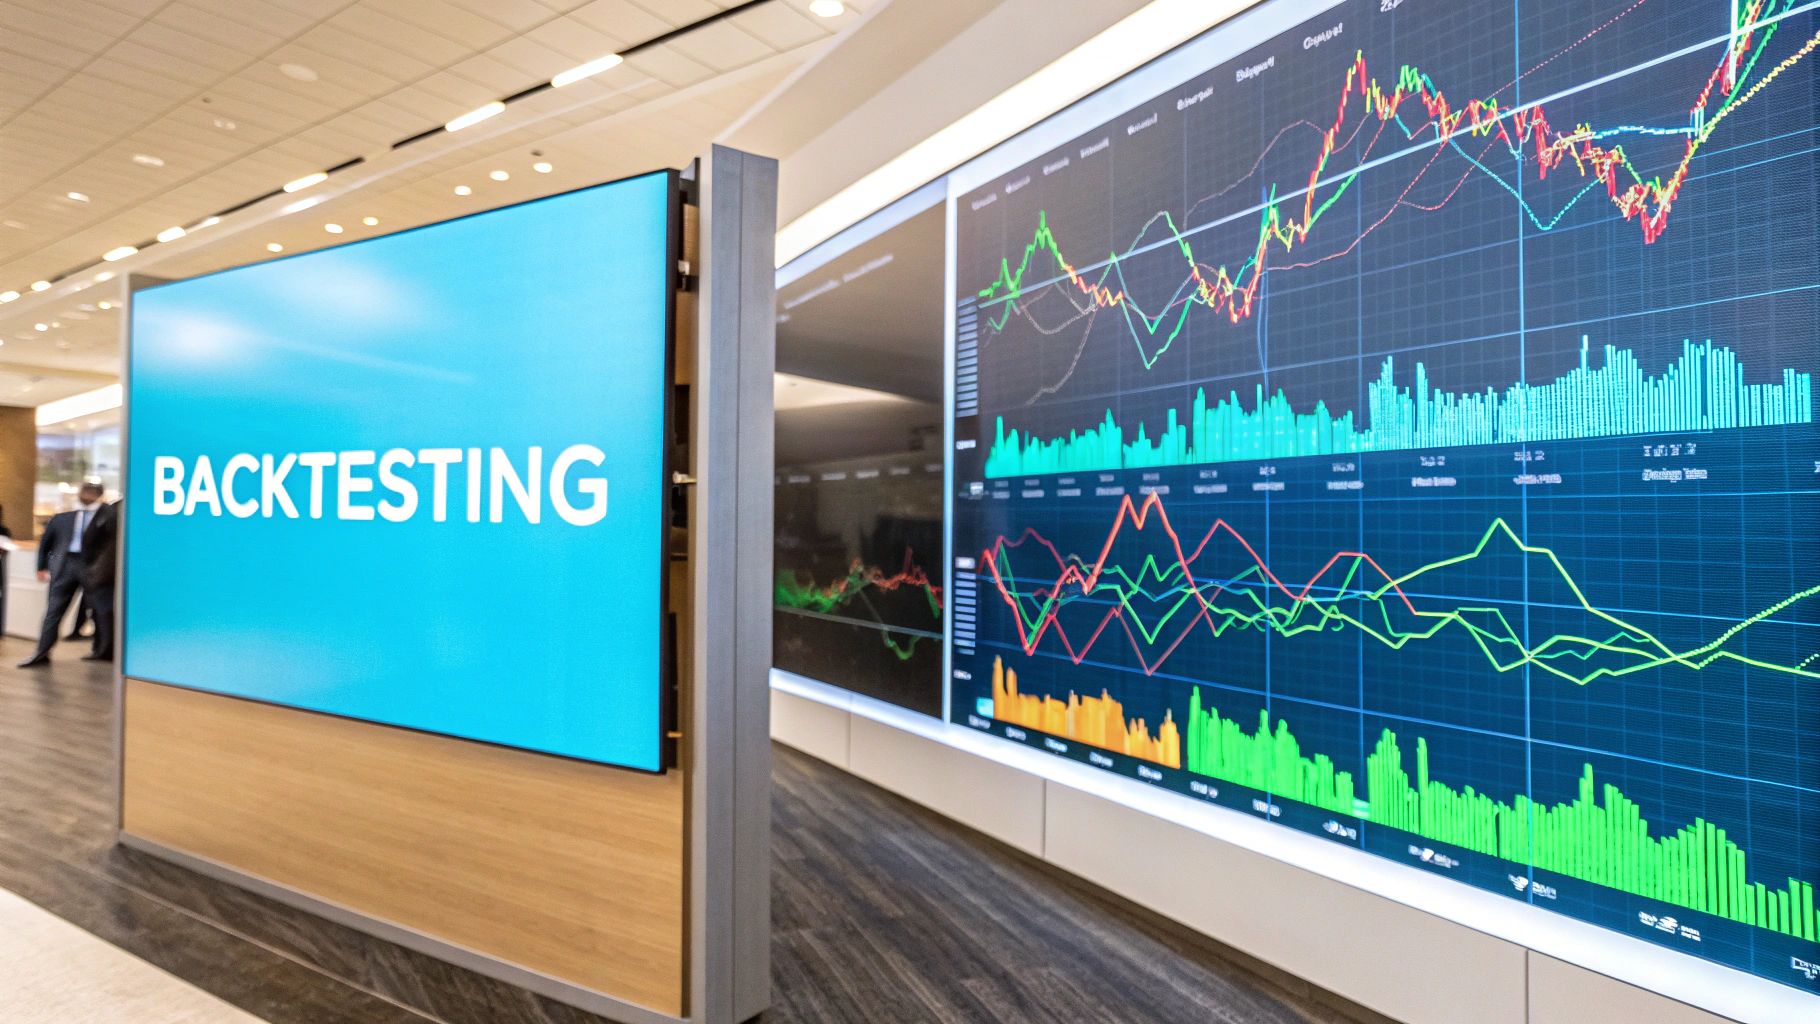
So, how do you build that trust? You start by backtesting. Scroll back on your charts and see for yourself how the AI signals performed during different market phases—strong trends, choppy sideways action, and big news events. After that, open a demo account and forward-test the signals in a live market without putting any real money on the line.
An IMF study pointed out that AI can cause markets to react much more quickly, hinting at its growing role in high-frequency trading. This just goes to show how good these models are getting at processing huge amounts of data in an instant, which is the very foundation of their reliability.
By watching the indicators work in real-time, you'll start to get a real feel for which signals are most powerful for your specific markets and timeframes. This is how you move from blind trust to confidence backed by your own data, letting you act without hesitation when a truly great setup appears.
Ready to stop guessing and start trading with data-driven confidence? EzAlgo provides the AI-powered indicators you need to see the market more clearly. Get instant access to our full suite of tools on TradingView and join our community of successful traders today!


%201.svg)