


When it comes to finding the best TradingView indicators for day trading, forget about searching for a single magic bullet. The real secret is building a cohesive system where a few select tools work together, each confirming what the others are telling you.
With thousands of options on TradingView, it’s easy to get lost. Many traders make the mistake of cluttering their charts, hoping more information will lead to better trades. In reality, the opposite is true. The goal is to build a lean, effective toolkit, not to carry every tool in the shed.
Think of each type of indicator as a different lens for viewing the market. By combining these perspectives, you get a much clearer picture of what's happening and where the price might go next.
Here’s how the main categories break down:
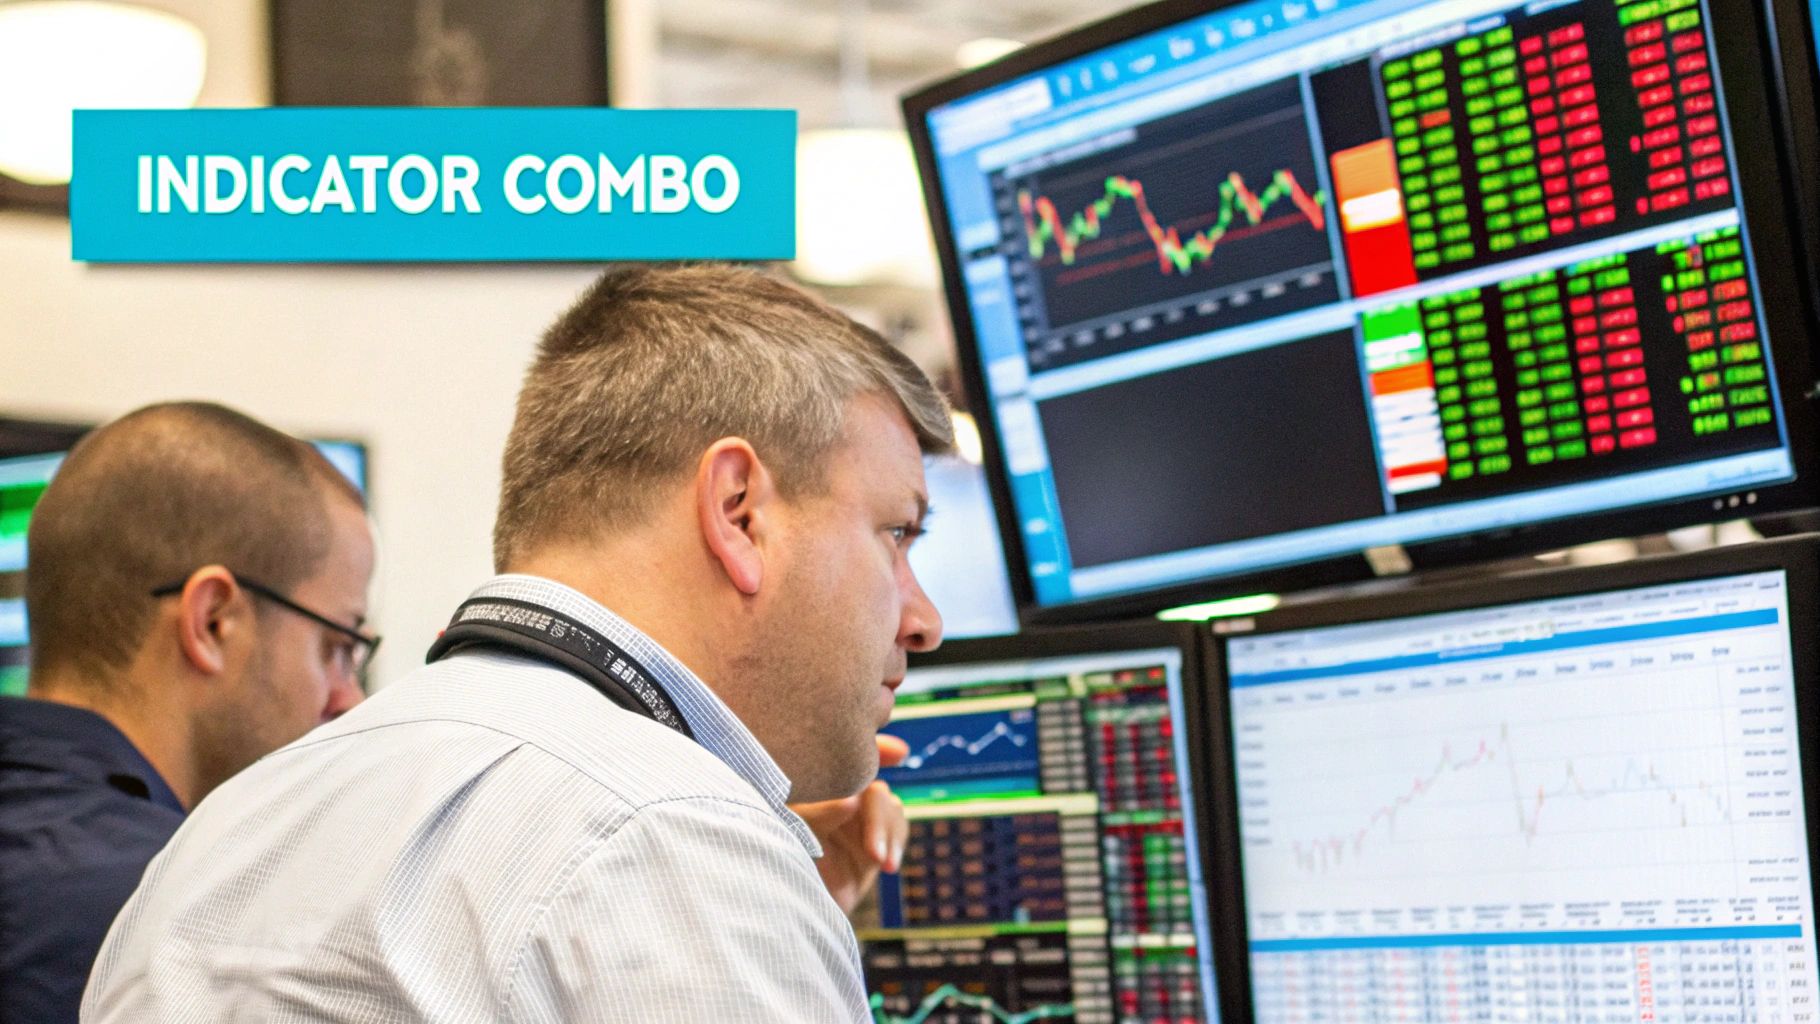
The best day traders don’t rely on a single "perfect" indicator. They build systems based on confluence, where multiple indicators point to the same conclusion, giving them a high-probability reason to enter a trade.
A great starting point for any day trading setup is to pick at least one indicator from the trend, momentum, and volume categories. This gives you a balanced view, so you're not just seeing the trend but also its strength and the conviction behind it.
To give you a bird's-eye view, here's a quick rundown of the indicators we'll be diving into. This table breaks down what each one does and the type of trader it's best suited for.
Think of this as a menu. Your job is to pick the combination that best fits your personal style and the markets you trade. Now, let's get into the specifics of each one.
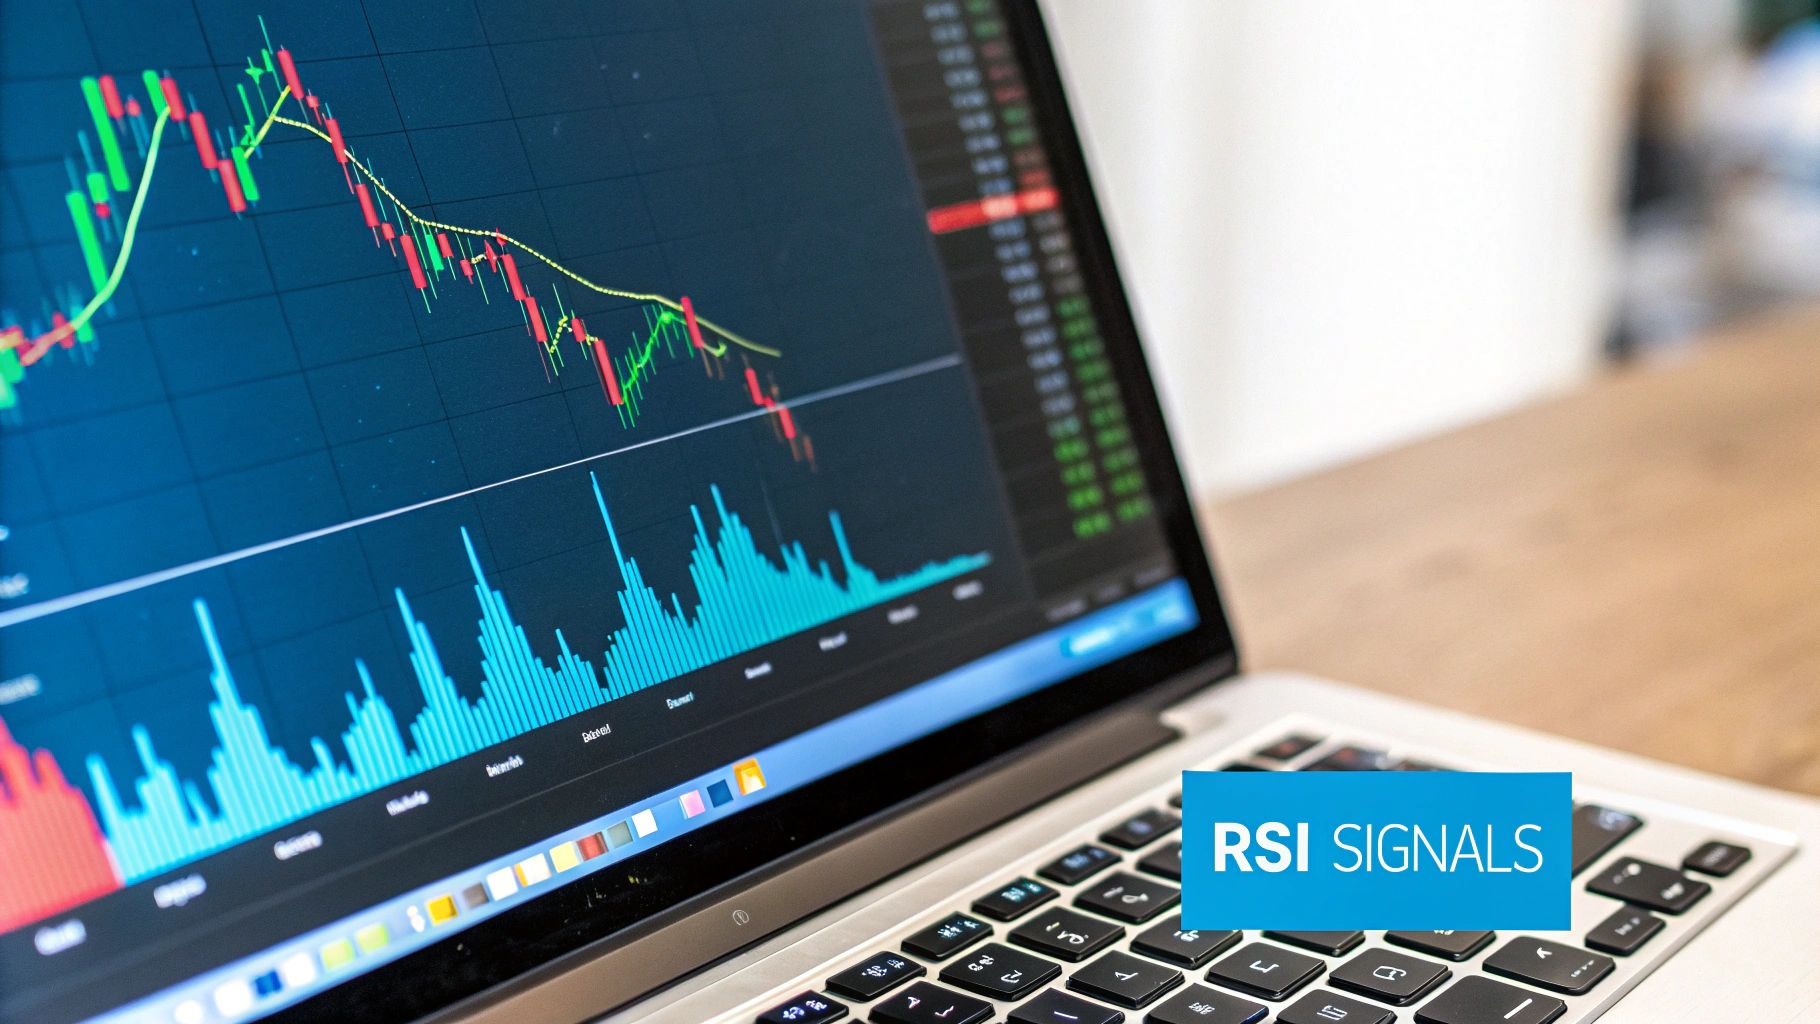
When it comes to day trading, momentum is everything. Two of the heaviest hitters for measuring it are the Relative Strength Index (RSI) and the Moving Average Convergence Divergence (MACD). They both track momentum, but they do it in fundamentally different ways. Think of it like this: RSI tells you when the market might be running out of steam, while MACD confirms if the trend has enough fuel to keep going.
The RSI is what we call a bounded oscillator—it’s stuck on a scale from 0 to 100. This makes it brilliant for spotting overbought (usually a reading over 70) and oversold (below 30) levels. In a choppy, sideways market, these signals can be gold for timing reversals.
If you're a day trader, the standard 14-period RSI setting can feel like you're driving with the handbrake on. It's just too slow for quick intraday moves. That's why many traders will dial it down to a 9 or 10-period setting to make it more responsive to what's happening right now. A quicker RSI means quicker signals, which is exactly what you need when you're in and out of trades within hours or even minutes.
Created way back in 1978, the RSI is still a go-to for day traders on TradingView for a reason: it works. It's a simple, effective way to gauge price momentum. Backtesting shows that when you pair RSI signals with other confirmations like a spike in volume, strategies can hit win rates between 55% and 65%. It's so ingrained in trading culture that it's a component in over 70% of manually placed day trades on TradingView in major financial centers.
Now, the MACD is a different beast. It’s an unbounded indicator built from two moving averages and a histogram. Its whole job is to show you the relationship between a fast trend and a slow trend. When the MACD line crosses above the signal line, that's a classic bullish signal—it’s telling you that upward momentum is picking up. A cross below suggests the bears are taking control.
Here’s the key takeaway: It's all about context. Use RSI to look for potential turning points in a sideways, choppy market. Use MACD to confirm that a trend has legs after a breakout has already happened.
The image below gives you a sense of how moving averages, which are the engine behind the MACD, look on a typical day trading chart.

This helps illustrate how these lines cut through the market "noise" to show you the real underlying trend, which is exactly what the MACD is designed to highlight.
One of the biggest mistakes traders make is using these tools interchangeably. Trying to short a stock just because the RSI is overbought during a monster uptrend is a recipe for disaster. In that situation, the MACD would be far more helpful, showing you that the trend's momentum is still strong. This is why knowing how to use the RSI indicator properly is so crucial—it shines in ranging markets but can give false signals in strong trends.
Ultimately, the smartest traders use both. Combining them gives you a much richer, more complete picture of what's really happening with market momentum.
Momentum indicators are great for telling you how fast price is moving, but volume-based indicators tell you about the conviction behind those moves. Price action on its own is only half the story. Volume is what confirms whether a trend has real institutional muscle or is just market noise. This is exactly where tools like the Volume Profile come in, giving you a much deeper look into the market’s structure.
Most traders are familiar with the standard volume indicator—those vertical bars at the bottom of the chart. It's useful, but it has its limits. It shows you the total volume traded during a specific time period, like a 5-minute candle, but it doesn't show you at what price that volume actually changed hands. For a day trader, that missing detail is everything.
This is the problem the Volume Profile HD indicator solves so well. Instead of plotting volume against time, it plots it horizontally against price. The result is a histogram right on the side of your chart that instantly shows you where the real action—and lack of action—has been happening.
To really get the most out of this tool, you need to understand its key components. It all boils down to two main areas of interest:
A breakout on high volume tells you institutions are committed. It's a move with power. A breakout on low volume? That's often a trap, signaling that there's no real interest to sustain the push.
For a day trader, this context is pure gold. Volume Profile HD is a go-to tool on TradingView for a reason—it gives you a precise map of the market's structure. In fact, traders report that pinpointing HVNs can improve their entry and exit timing by up to 20% because these volume-based levels often hold up better than traditional lines on a chart.
Just keep in mind that to unlock all the features of Volume Profile HD, you'll likely need a TradingView Premium subscription. If you want to dive deeper, you can find a lot of analysis from trading professionals who have studied its impact.
Look, classic indicators like MACD and Volume Profile have their place. They’re powerful, but let’s be honest—they demand constant interpretation. That manual analysis is where the trouble starts. It’s a breeding ground for emotional mistakes and, frankly, a ton of chart clutter. This is where modern all-in-one systems come in, packaging multiple data points into a single, clean tool.
These systems are designed to do the heavy lifting for you. Instead of staring at charts trying to connect the dots between crossovers, divergences, and volume nodes, an algorithm handles it. The result? Clear buy and sell signals printed directly on your chart. For a day trader, this cuts down the mental gymnastics and lets you act quickly and decisively.
An integrated system like EzAlgo takes it a step further than just basic alerts, offering a more complete picture of what the market is actually doing.
The biggest win with an all-in-one indicator is simply cleaning up your screen. You can stop stacking three, four, or even five separate indicators—each with its own quirks and settings—and get one unified view. In day trading, where every second counts, that clarity is everything.
Think about a typical traditional setup. You might have:
An all-in-one system takes all that information and processes it behind the scenes. It might flash a "buy" signal only when the trend is up, momentum is building, and the price just bounced off a high-volume support area. The signal isn't based on one thing; it's the product of confluence.
The real goal of an all-in-one system isn't just to make your chart look prettier—it's to simplify your decision-making. By automating the hunt for confluence, it helps you sidestep low-probability trades and avoid getting stuck in analysis paralysis.
Beyond simple signals, the best TradingView indicators for day trading that come in an "all-in-one" package often have unique, algorithm-driven features. These are the tools designed to give you an edge that you just can't get from standard indicators.
EzAlgo’s Approach:
In the end, the choice between a classic multi-indicator setup and an all-in-one system comes down to your personal trading style. If you love digging into the weeds, doing deep manual analysis, and building a strategy from the ground up, the classic tools are your best bet. But if you value speed, clarity, and data-driven signals that help keep your emotions in check, an integrated system can be a game-changer.
Having the right tools is half the battle. Knowing how to combine them into a strategy that actually works is where the real trading begins. Your goal should be to find confluence—where several different indicators all point to the same conclusion—without cluttering your chart so much that you can't think straight.
A solid strategy is more than just a couple of indicators. It's a full-blown plan that dictates every move you make, from entry to exit. This is what separates consistent, disciplined trading from emotional guesswork.
Let's walk through a couple of practical ways you can combine some of the best TradingView indicators for day trading into a system you can actually use.
This is a classic for a reason. It's a straightforward approach for traders who want to catch and ride a strong market trend. The logic is simple: you use a long-term moving average to tell you the overall direction and a faster indicator like the MACD to pinpoint your entry.
This one is for traders who like to catch tops and bottoms. It’s built on identifying when a trend is running out of steam by combining RSI divergence with the institutional-level insights you get from the Volume Profile.
The real magic here is finding where momentum is dying out at a price level that big players have historically shown interest in. It gives you an extra layer of confidence that a simple overbought or oversold signal just can't provide on its own.
Before you ever risk real money on a strategy, you have to test it. You can learn exactly how to backtest on TradingView to see how your system would have performed in the past. This crucial step is what turns a good idea into a plan you can truly trust.
If you're diving into the world of technical indicators, you're bound to have questions. It's totally normal. Precision is everything in day trading, so let's clear up a few common things people ask about using indicators on TradingView.
There isn't a single right answer, but most seasoned traders I know stick to just two to four indicators. The real aim is to find confluence, which is just a fancy way of saying you have multiple tools pointing to the same conclusion.
Piling on more indicators usually just creates conflicting signals and a messy chart. This can lead to "analysis paralysis," where you're so overwhelmed with information that you can't make a decision.
A clean chart is a clear mind. Focus on mastering a few select indicators that complement your strategy rather than adding noise. Your system should simplify your process, not complicate it.
Technically, yes, but I wouldn't recommend it. If you rely solely on one signal, like the RSI, you're missing the bigger picture. You have no context on the underlying trend or the volume behind a move.
A much safer and more reliable approach is to combine indicators that measure different things—like momentum, trend, and volume. This gives you a more complete view of what the market is actually doing.
Finding the best TradingView indicators for day trading isn’t about chasing a single, magical tool that never fails. Let’s be real—that doesn’t exist. It’s about building a small, effective toolkit that gives you a clear and repeatable edge.
You've seen how trend, momentum, and volume indicators each tell a different part of the story. Think of them as members of a team. A moving average can point out the general direction, but volume is what tells you if there's real conviction behind the move. Meanwhile, an oscillator like the RSI can give you a heads-up that the trend might be running out of gas.
More indicators don't equal more profits. In fact, cluttering your charts is one of the fastest ways to get analysis paralysis, leading to missed opportunities or hesitant trades. Success comes from mastering a handful of tools that actually click with your personality and trading style.
And please, don't skip the backtesting. It's not the most glamorous part of trading, but it’s absolutely essential. This is how you build unshakable confidence in your signals, so when the pressure is on and real money is at stake, you can execute your plan without second-guessing every move.
The real secret is finding confluence—that sweet spot where multiple, independent indicators all point to the same conclusion. That’s the foundation of any high-probability trade.
Whether you decide to mix and match classics like the MACD and Volume Profile or go with an all-in-one system, the core idea is the same. Aim for clarity, confirmation, and consistency. Your indicators should make trading simpler, not more complicated.
Pick your tools carefully, learn their quirks, and stick to your strategy. That discipline is what truly sets profitable traders apart.
Ready to cut through the noise with clear, automated signals? EzAlgo combines multiple analytical layers into a single, powerful indicator to give you a definitive edge. Explore EzAlgo and simplify your trading strategy today.


%201.svg)