


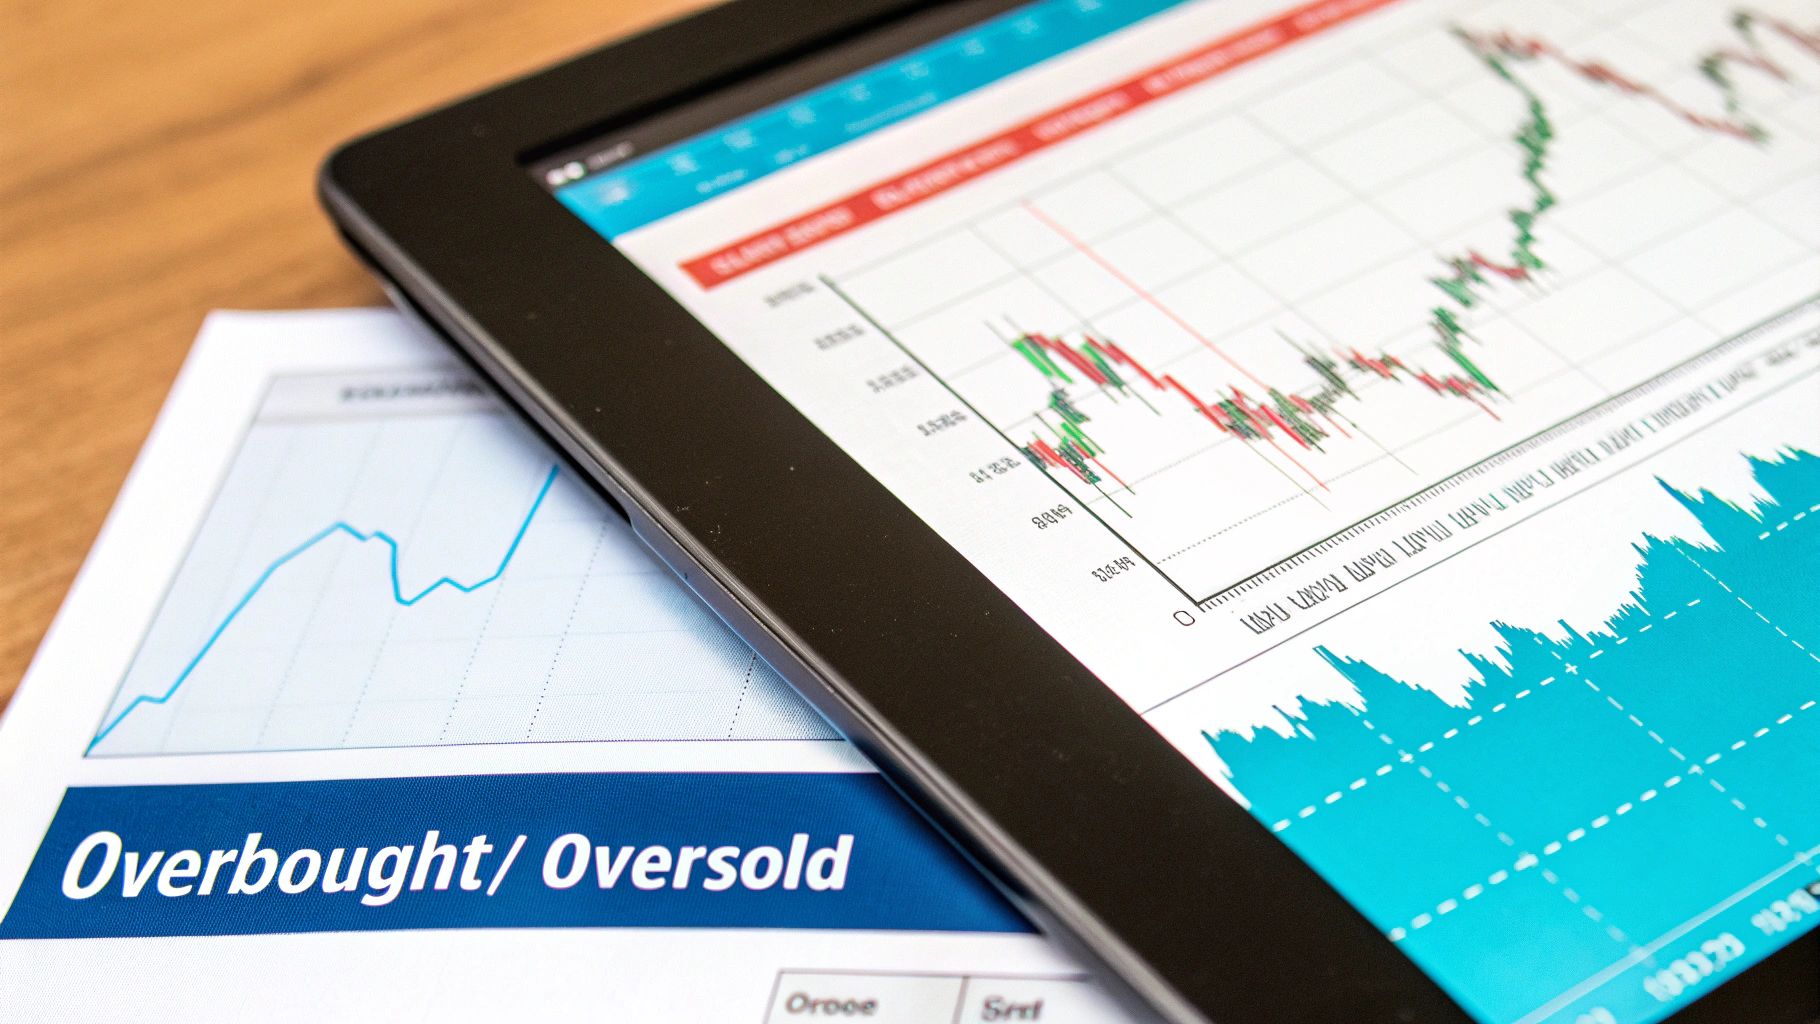
The Relative Strength Index, or RSI, is a classic momentum tool for a reason. It cuts through the noise of price action to measure how quickly—and with how much force—a market is moving. It’s designed to tell you if an asset is getting a bit too hot (overbought, typically above 70) or has been beaten down too far (oversold, usually below 30).
But just knowing those two numbers isn't enough. Truly skilled traders learn to read the RSI for what it really is: a gauge of market momentum that can hint at trend reversals before they happen.
Developed way back in 1978 by J. Welles Wilder, the RSI acts like a speedometer for an asset's price. It doesn't track the price itself but focuses on the strength of the moves. The indicator works on a simple 0 to 100 scale, calculated by comparing average gains to average losses over a specific period, most commonly the last 14 trading sessions.
Think of it like this: if a stock's price rockets up for several days straight, the RSI will climb with it. Once it pushes past that 70 mark, it's a signal that the buying frenzy might be getting out of hand. While it's not a direct order to sell, it's a serious heads-up that the trend could be running out of gas and might be ready for a pullback or a complete reversal.
On the flip side, when a price plummets, the RSI will follow it down. A reading below 30 signals an "oversold" condition. This suggests sellers have been in firm control, and the asset could be due for a bounce. These levels aren't just random lines on a chart; they are your first clue to identifying potential turning points.
Here’s a look at the RSI in action on a TradingView chart, plotted right below the price with the 70 and 30 levels clearly marked.

Notice how the RSI line reacts when the price makes a sharp move, pushing toward or crossing those key thresholds.
The RSI is more than just a simple overbought/oversold indicator. It has proven its worth over decades of market history. For example, one backtest on the S&P 500 dating back to 1993 showed that an RSI strategy on short timeframes (2-6 periods) hit a 91% success rate. That strategy turned a hypothetical $100,000 into more than $860,000. You can dig into the details of this RSI trading strategy analysis yourself.
The RSI helps you quantify market momentum. Instead of just guessing if a trend is losing steam, the indicator gives you a hard number to back up your read on the market.
To get the most out of the RSI, you need to internalize a few key ideas.
For a quick reference, here's a breakdown of what the different RSI levels are generally telling you.
This table gives you a solid starting point, but always remember to look for confirmation from other signals before making any moves. The RSI is a guide, not a crystal ball.
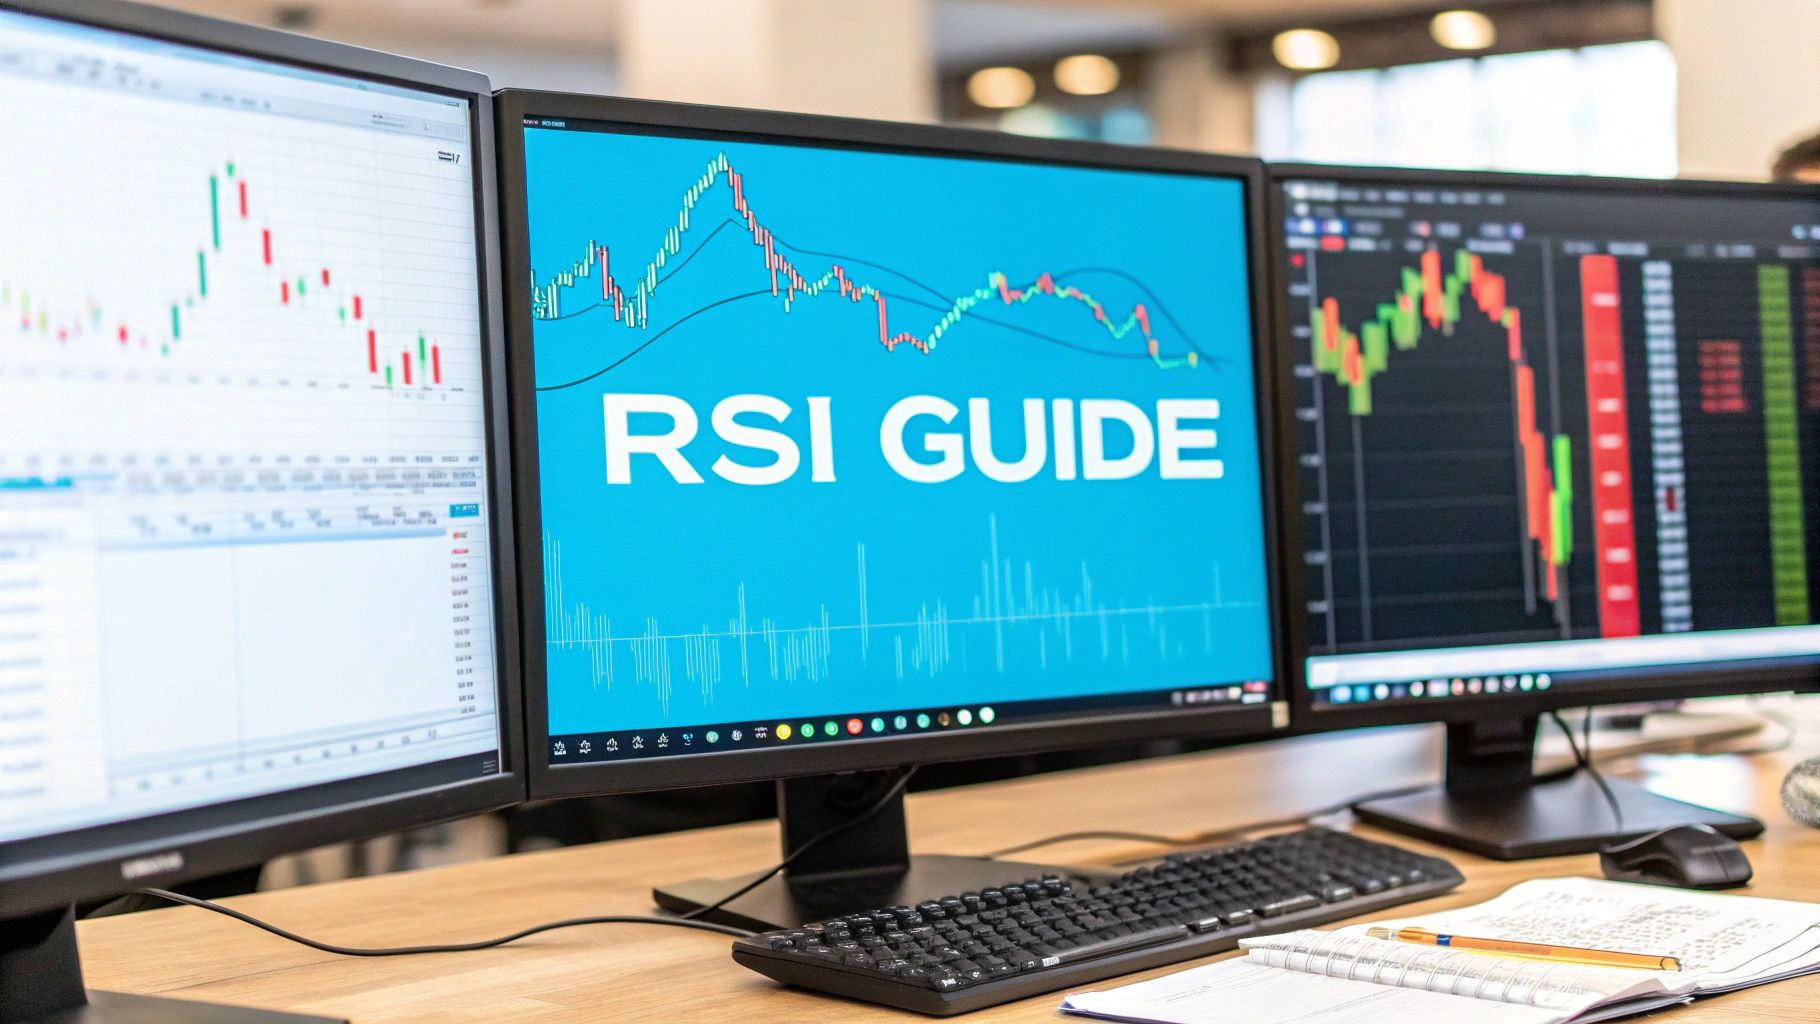
Alright, let's get down to business and put the RSI indicator on your chart. Theory is great, but seeing it in action is what really matters. Thankfully, platforms like TradingView make this incredibly simple. In just a few clicks, you can move from reading about RSI to actually using it to analyze your favorite assets.
First thing's first: pull up a chart for whatever you're trading, whether it's a stock, crypto, or forex pair. Look for the “Indicators” button at the top of your screen. Clicking it opens up a new window, which is basically a treasure trove of technical tools.
Once you have the indicators window open, just type "Relative Strength Index" into the search bar. You'll see it pop up under the built-in options. Give it a click, and like magic, the RSI will appear in its own panel right below your price chart.
Out of the box, it comes with a 14-period length. This is the classic setting from its creator, J. Welles Wilder, and honestly, it’s a solid starting point for most people. It gives a well-balanced look at momentum, making it useful for everything from daily charts to swing trading.
But the real advantage comes when you start tweaking it to fit your style. To do that, find the gear icon next to the RSI's name on your chart and click it to open the “Settings” menu. This is where you can dial it in perfectly.
The RSI works by comparing the average size of recent up-moves to the average size of recent down-moves. This calculation transforms complex price action into a single, easy-to-read momentum line.
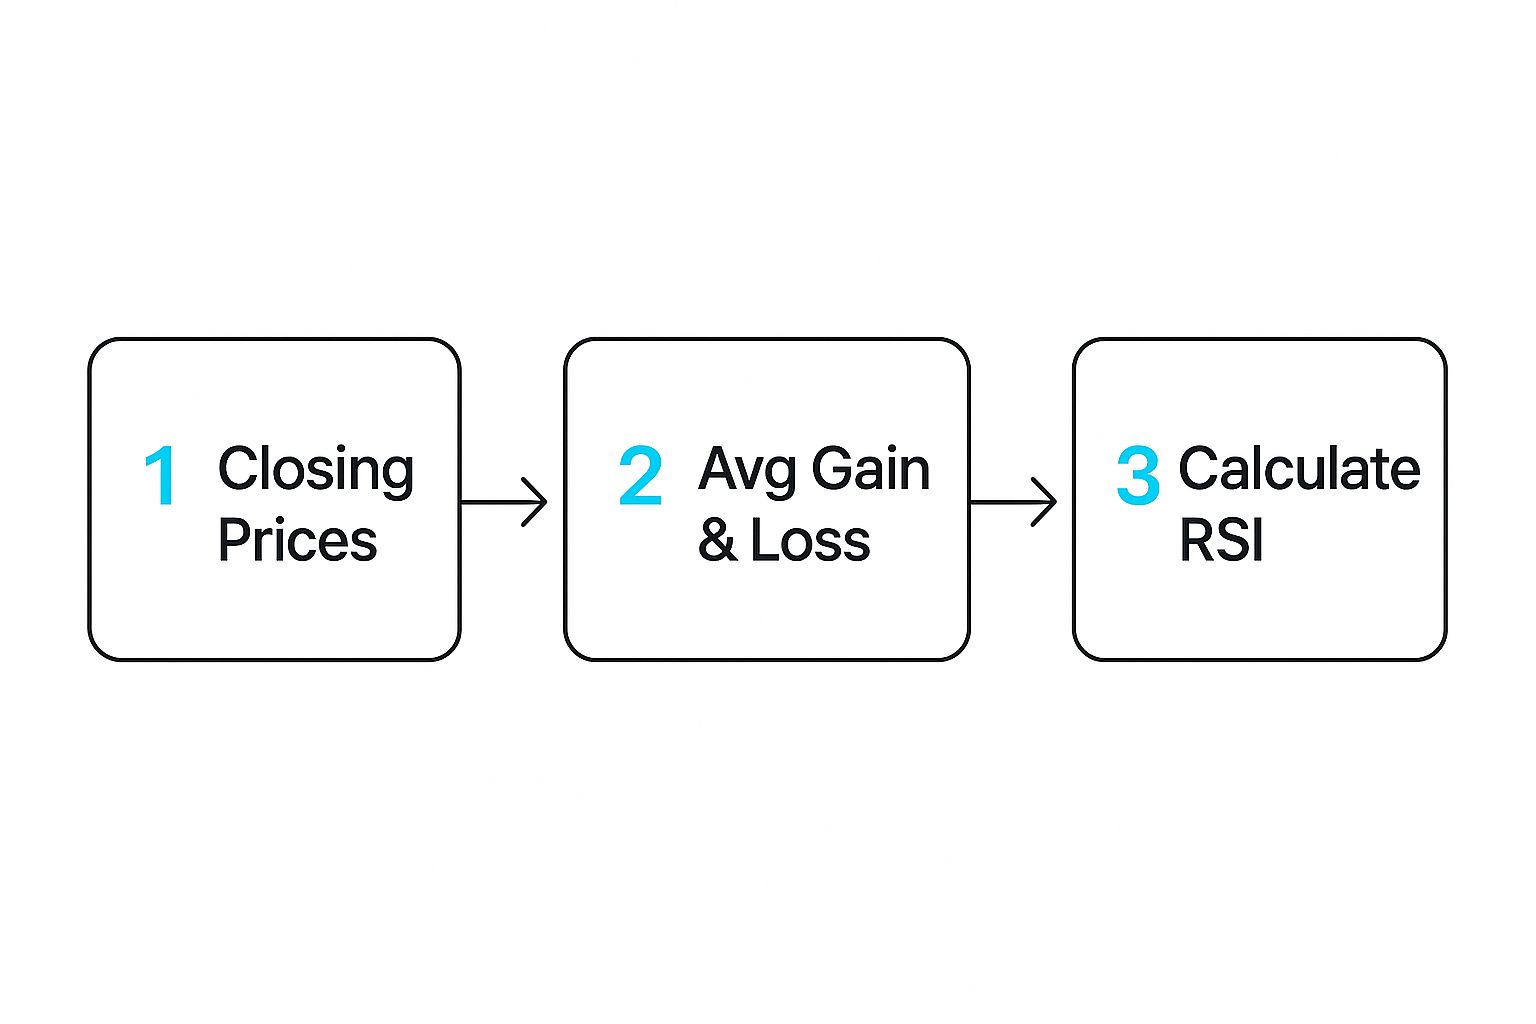
As you can see, it's all about the ratio between recent gains and losses over a set period.
In the settings menu, you'll find two main tabs: "Inputs" and "Style."
The "Inputs" tab is the engine room. This is where you control how the RSI is calculated, and the most important setting here is the "Length."
A huge mistake I see traders make is using the same RSI length for every single asset. You have to experiment! See how the indicator reacts to the unique volatility of what you're trading and adjust accordingly.
Over in the "Style" tab, you can customize the look and feel. Change the color of the RSI line, make it thicker, and adjust the 70 and 30 overbought/oversold levels. Making your chart visually clear helps you spot signals instantly without having to squint at the screen. Once you have it set up just right, you’re ready to start reading the signals.
Alright, you've got the RSI indicator loaded up on your chart. Now for the fun part: making sense of that squiggly line and using it to make actual trading decisions. A lot of new traders make the mistake of thinking it's as simple as buying when the RSI dips below 30 and selling when it pops above 70. If only it were that easy! Honestly, treating those levels as automatic buy/sell buttons is a fast track to getting chopped up by false signals.
A much better way to think about it is using the RSI as a heads-up. It's a prompt to pay closer attention to what the price itself is doing. Just because the RSI is "oversold" doesn't mean a stock is about to launch into orbit; it just means the downward momentum has been really strong. In a heavy downtrend, an asset can stay oversold for a surprisingly long time.
One of the most powerful, yet often overlooked, ways to use the RSI is by focusing on the 50-level. I like to think of this line as momentum's center of gravity. It's the battle line that separates the bulls from the bears.
RSI Above 50: When the RSI is living above the 50 line, it’s a strong sign that the bulls are in charge. The average gains are simply bigger than the average losses. In a healthy uptrend, a pullback that brings the RSI down toward the 50-level can be a fantastic buying opportunity—long before it ever gets near the 30 "oversold" mark.
RSI Below 50: On the flip side, if the RSI can't seem to break and hold above 50, you know the bears are running the show. In this kind of market, any rallies that push the RSI up towards 50 often run out of steam and get sold off, creating potential shorting setups.
The 50-level is your trend filter. It helps keep you on the right side of the market's main direction, which is where the highest probability trades are always found. Don't fight the trend.
Let's walk through a practical example. Say a stock is in a beautiful uptrend, making a clear series of higher highs and higher lows. The RSI is humming along nicely above 50, confirming all that bullish energy. Then, the price takes a breather and pulls back, causing the RSI to dip from around 70 down to, say, 45.
An inexperienced trader might panic. But a seasoned trader sees a potential setup brewing. They don't just jump in; they wait for the price action to give them the green light. Maybe that comes as a big bullish engulfing candle or a breakout above a small, recent resistance level. Once the price confirms it wants to head higher and the RSI starts ticking back up above 50, that's a high-confidence entry. You're combining momentum (RSI) with price structure for a much stronger signal.
This is the real work of using the RSI—finding those high-probability entry and exit points. Historically, an RSI crossing above 70 often flags overbought conditions that precede a pullback, while a drop below 30 signals oversold conditions that can lead to a bounce. Large-scale stock screening tools consistently show that assets stuck above RSI 70 tend to underperform in the near term, whereas those below 30 often show significant outperformance. It's a core principle used in markets everywhere, from the NYSE to the FTSE.
Once you get comfortable with the basic overbought and oversold signals, you're ready for the real magic of the RSI: divergence.
Divergence is like a quiet disagreement between what the price is doing and what the momentum is doing. It’s an early whisper that a trend is losing steam, often showing up just before a major reversal. When you learn to spot it, you gain a massive edge.
Essentially, divergence happens when the price of an asset zigs, but the RSI zags. This mismatch tells you the underlying momentum isn't backing up the price move, which is a huge tell for what might happen next.
You'll mainly encounter two types of divergence. Let's get them dialed in.
A bullish divergence is your clue that a downtrend might be hitting the brakes. You'll see it when the price chart carves out a new lower low, but the RSI actually prints a higher low. This is a classic sign that the sellers are getting exhausted.
Here's the play-by-play:
This conflict suggests that even though the price is lower, the selling pressure is actually fading. It’s a strong hint that the downtrend is running out of fuel and a reversal might be just around the corner.
It's like a car rolling down a hill. The car (the price) is still moving lower, but its speed (the RSI) is slowing. Sooner or later, you expect it to stop and maybe even start rolling back up.
On the flip side, a bearish divergence is an early warning that an uptrend is getting tired. This occurs when the price pushes to a fresh higher high, but the RSI forms a lower high.
Let’s break that down:
Even as the price climbs, the oomph behind the move is fading. This is often the first sign that the bulls are losing control and the bears are about to step in. Catching this can help you lock in profits on a long trade before a reversal or even scout for a potential short entry.
If you really want to master this, diving into a complete RSI divergence trading strategy can give you a clear, step-by-step plan for finding and trading these powerful signals.
Let's say a stock has been in a monster uptrend for weeks. It hits a new high of $100, and the RSI is way up at 85. After a brief dip, the stock rallies again, this time to $105.
But when you check the RSI, you see it only managed to reach 78. That’s a textbook bearish divergence. While the price made a higher high ($100 to $105), the RSI made a lower high (85 to 78). This is a flashing red light that the trend is losing its power and a reversal or a deep pullback is very likely.

Let's be clear: no single indicator is a magic bullet, and the RSI is certainly no exception. One of the biggest mistakes I see traders make is using it all by itself. This almost always leads to frustration and a chart full of false signals.
The secret to using RSI effectively is to look for confluence. This is just a fancy way of saying you need multiple, separate signals all telling you the same story. When your RSI reading lines up with other evidence on the chart, your confidence in a potential trade skyrockets.
Think of it like building a case for a trade. An overbought RSI signal by itself is just one weak clue. But what if that overbought reading happens right as the price smacks into a major resistance level? Now you’ve got a much stronger argument for a potential reversal. This simple mindset shift helps you cut through the market noise and avoid jumping on weak setups.
One of the most powerful ways to filter your RSI signals is to make sure you're trading in the same direction as the main market trend. A simple moving average, like the 50-day or 200-day SMA, is perfect for this.
Here’s how it works in practice:
This one tweak alone makes your trading far more intelligent and context-aware.
A trader’s goal is to stack the probabilities in their favor. Combining an oversold RSI with a price bouncing off a key moving average in an uptrend is a classic example of stacking confirmations for a high-quality setup.
Another fantastic partner for the RSI is good old support and resistance. These are the zones on your chart where price has turned around in the past. When an RSI signal pops up at one of these critical levels, it adds a ton of weight to the potential trade.
Let’s walk through a scenario. Imagine a stock is in a downtrend and is now approaching a well-established support level at $50, a price where you know buyers have shown up before. Right as it gets there, you see the RSI drop to 28, deep into oversold territory.
This is the confluence we’re looking for. The oversold reading at a major support zone gives you a compelling, evidence-based reason to start looking for a long entry.
By using this approach, the RSI becomes more than just a momentum oscillator—it becomes a precision timing tool. You're no longer just blindly reacting to a number. Instead, you're confirming that number with real, historical price action. For anyone serious about building a solid trading strategy, learning to pair tools is a must. You can explore more combinations by checking out the best indicators for swing trading. Seeking this kind of confirmation is how you graduate from basic analysis to trading with a true strategic edge.
Once you start using the RSI, you'll quickly run into some real-world questions. I've been there. Getting these sorted out early on is the difference between building confidence and making frustrating mistakes. Let's walk through the things most traders ask.
One of the very first things you'll wonder is what number to plug into the RSI settings. The truth is, there's no magic number that works for everyone.
The classic 14-period RSI is the standard for a reason. It's a fantastic starting point, especially if you're swing trading on a daily chart. It does a great job of filtering out market noise while still being responsive enough to catch major moves.
But your trading style dictates everything. If you're a scalper or day trader, you'll need something faster.
My best advice? Try a few out. A setting that works perfectly for a volatile crypto pair will likely be way too noisy for a slow-moving blue-chip stock.
Yes, you absolutely can. From a chaotic 1-minute chart to a calm monthly chart, the RSI is one of the most flexible indicators out there. The core concepts—overbought, oversold, and divergence—apply universally.
The key is matching the settings to the timeframe. A 14-period RSI on a weekly chart is looking back at 14 weeks of price action. That's a completely different story from a 14-period RSI on a 5-minute chart, which is only analyzing the last 70 minutes. Keep that context in mind.
The biggest mistake I see traders make is blindly selling at 70 and buying at 30. An asset in a powerful uptrend can stay "overbought" for weeks, steamrolling anyone who tried to short it. Always, always wait for the price itself to confirm a reversal before you act on an RSI signal.
Think of the RSI as a momentum gauge, not a crystal ball. Its signals become incredibly powerful when you use them alongside other analysis, like support and resistance or chart patterns.
Ready to stop guessing and start trading with precision? EzAlgo provides AI-powered buy and sell signals, real-time momentum alerts, and dynamic support and resistance levels directly on your TradingView chart. Eliminate emotional trading and gain an institutional-grade edge by visiting EzAlgo to see how our tools can transform your strategy.


%201.svg)