


Swing trading offers a powerful way to capitalize on short-to-medium-term market movements, but success hinges on one critical element: a clear view of what's happening beneath the surface. The right tools don't just show you the current price; they reveal underlying momentum, track volatility, and help you pinpoint potential turning points before they become obvious to the crowd. This guide cuts through the noise to focus on the best indicators for swing trading that consistently provide traders with a reliable edge.
We will move beyond basic definitions to provide practical strategies, real-world examples, and actionable tips for each of the top 7 indicators. You will learn how to interpret their signals, from identifying overbought and oversold conditions with the RSI to spotting momentum shifts with the MACD.
By understanding how to properly use and combine these tools, you can build a robust framework to identify high-probability setups, manage risk effectively, and trade with greater confidence. Whether you're analyzing stocks, crypto, or forex, mastering these indicators is the first step toward transforming your trading approach from guesswork into a repeatable, data-driven strategy. Let's explore the tools that will help you navigate the markets with precision.
The Relative Strength Index, or RSI, is a cornerstone for many swing traders and is often considered one of the best indicators for swing trading due to its simplicity and effectiveness. Developed by J. Welles Wilder Jr., this momentum oscillator measures the speed and magnitude of price changes, helping traders identify potentially overbought or oversold conditions. It plots these values on a scale of 0 to 100.
The core idea is to compare the strength of price on up-days versus down-days over a specific period, typically 14 days. This calculation provides a clear visual gauge of an asset's recent momentum. When the RSI moves above 70, the asset is often considered overbought and may be due for a pullback. Conversely, when it drops below 30, it's considered oversold and could be poised for a rebound.
For swing traders, RSI isn't just about buying at 30 and selling at 70. The real power comes from its nuanced signals.
Pro Tip: Look for RSI divergence. This occurs when the price makes a new high, but the RSI makes a lower high (bearish divergence), or when the price makes a new low, but the RSI makes a higher low (bullish divergence). These are powerful reversal signals. For instance, Apple (AAPL) showed significant bearish divergence before major corrections in 2022, warning traders of an impending drop despite a rising price.
This infographic summarizes the standard parameters for the RSI, which serve as a starting point for any analysis.
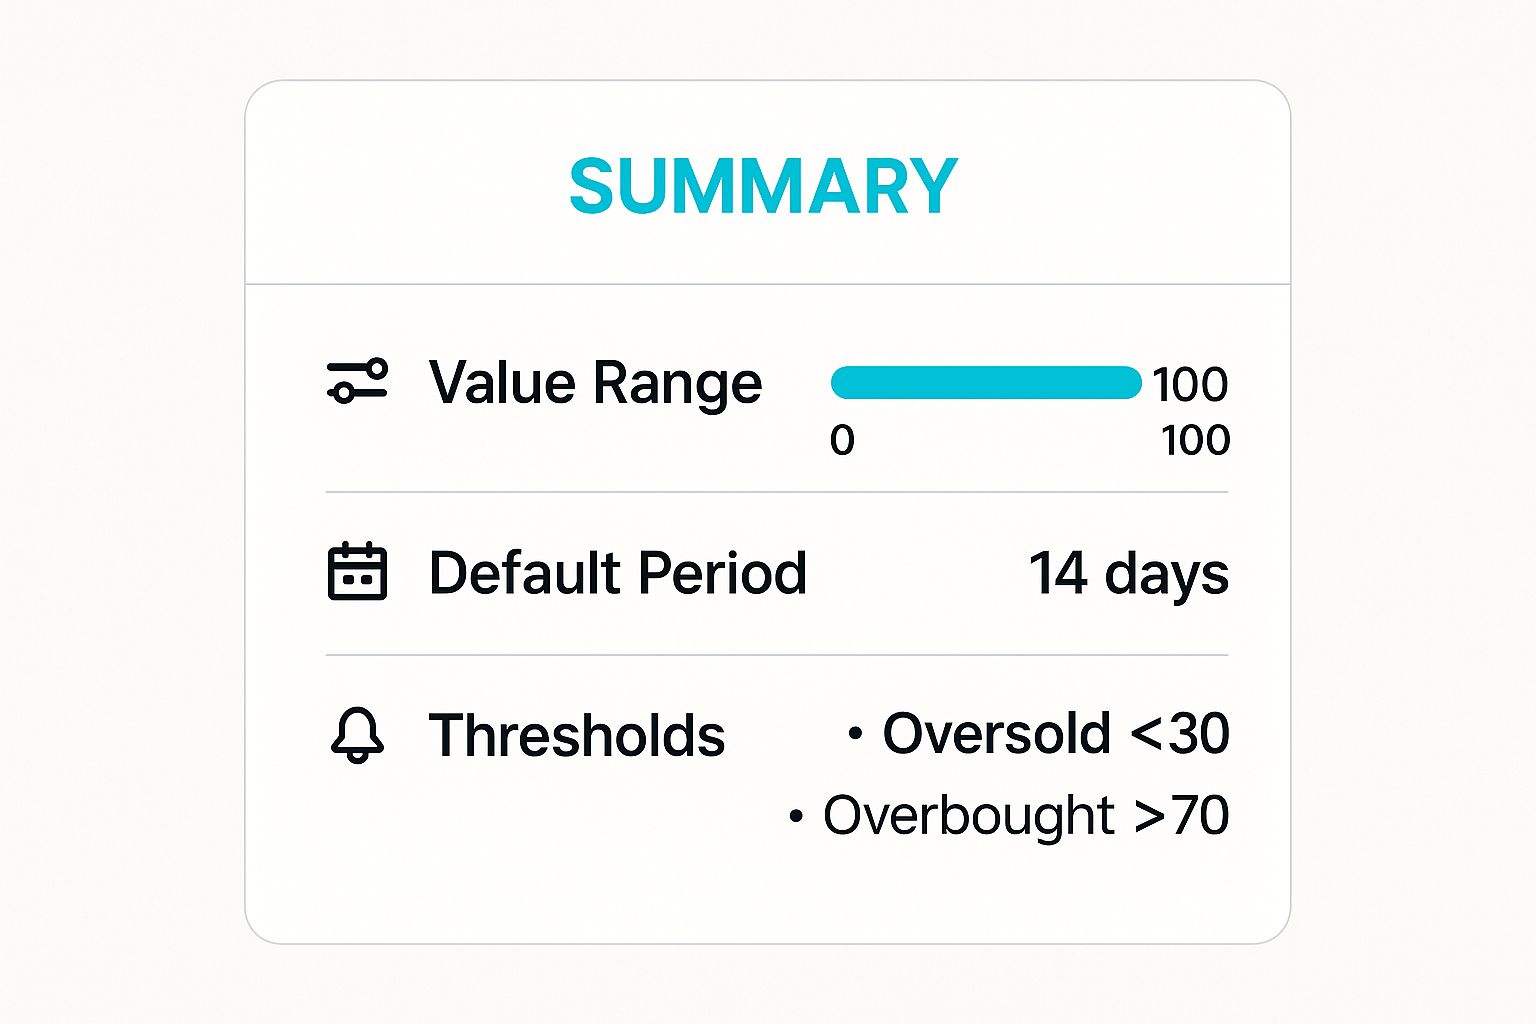
These default settings are effective, but tailoring them to market conditions-such as using 80/20 thresholds in strong trends-can significantly enhance signal accuracy. For more robust strategies, combine RSI signals with a trend-confirming indicator like a moving average to avoid trading against the primary market direction.
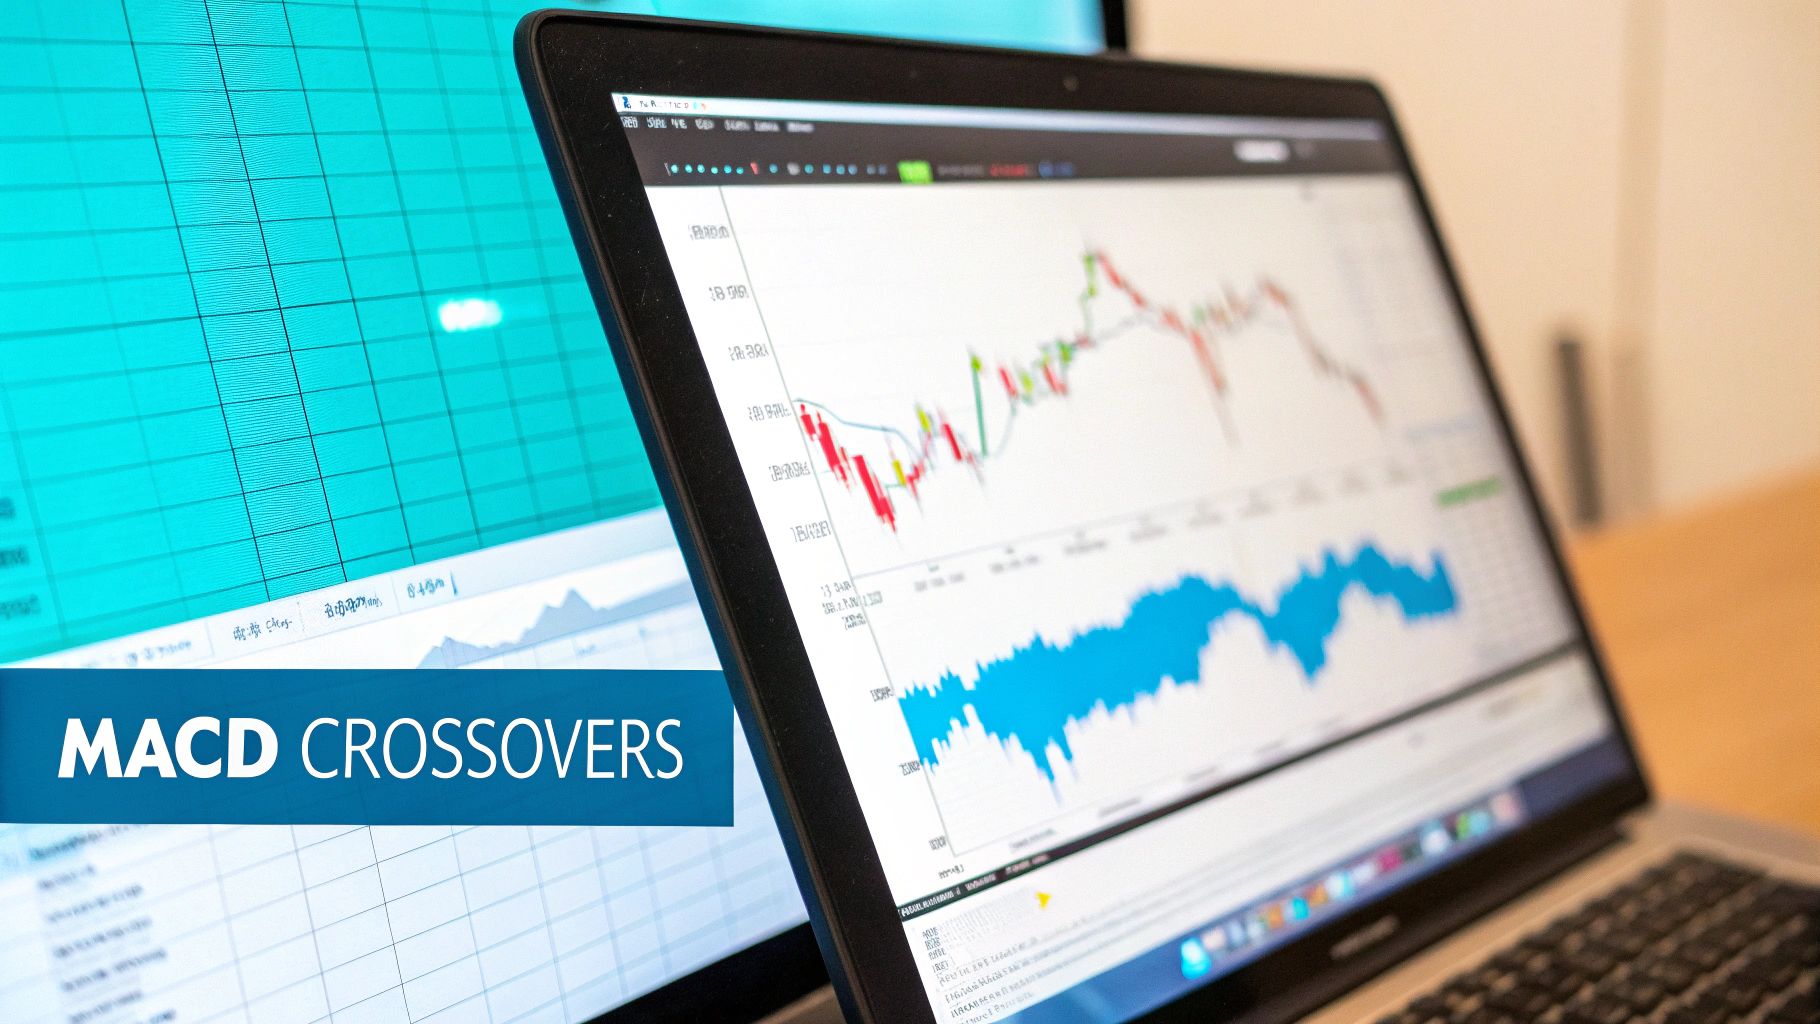
The Moving Average Convergence Divergence, known as MACD, is a powerhouse indicator for swing traders. Created by Gerald Appel, it's a trend-following momentum indicator that clarifies the relationship between two exponential moving averages (EMAs) of a security’s price. Its ability to highlight changes in trend strength, direction, and momentum makes it one of the best indicators for swing trading.
The MACD is composed of three key elements: the MACD line (the 12-period EMA minus the 26-period EMA), the signal line (a 9-period EMA of the MACD line), and the histogram (the difference between the MACD and signal lines). This setup provides a multi-faceted view of market momentum, allowing traders to spot potential trend shifts before they become obvious on the price chart.
Swing traders leverage MACD to capture medium-term price moves by pinpointing ideal entry and exit points. The interaction between its components generates clear, actionable signals.
Pro Tip: Pay close attention to the MACD histogram. It often signals momentum shifts earlier than the MACD/signal line crossover. When the histogram bars start shrinking towards the zero line, it means momentum is slowing down, providing an early warning. Similarly, watch for divergences. Bitcoin has repeatedly shown bearish divergence, with price hitting new highs while the MACD fails to do so, preceding major corrections.
Traders can also adjust MACD's parameters, such as trying a 5,35,5 setting, to better suit different market volatilities or asset classes. However, it's crucial to validate any changes. You can learn more about how to evaluate these adjustments through a trading strategy backtesting process. Combining MACD with other indicators, like the RSI or volume analysis, can further increase the reliability of your trading signals.
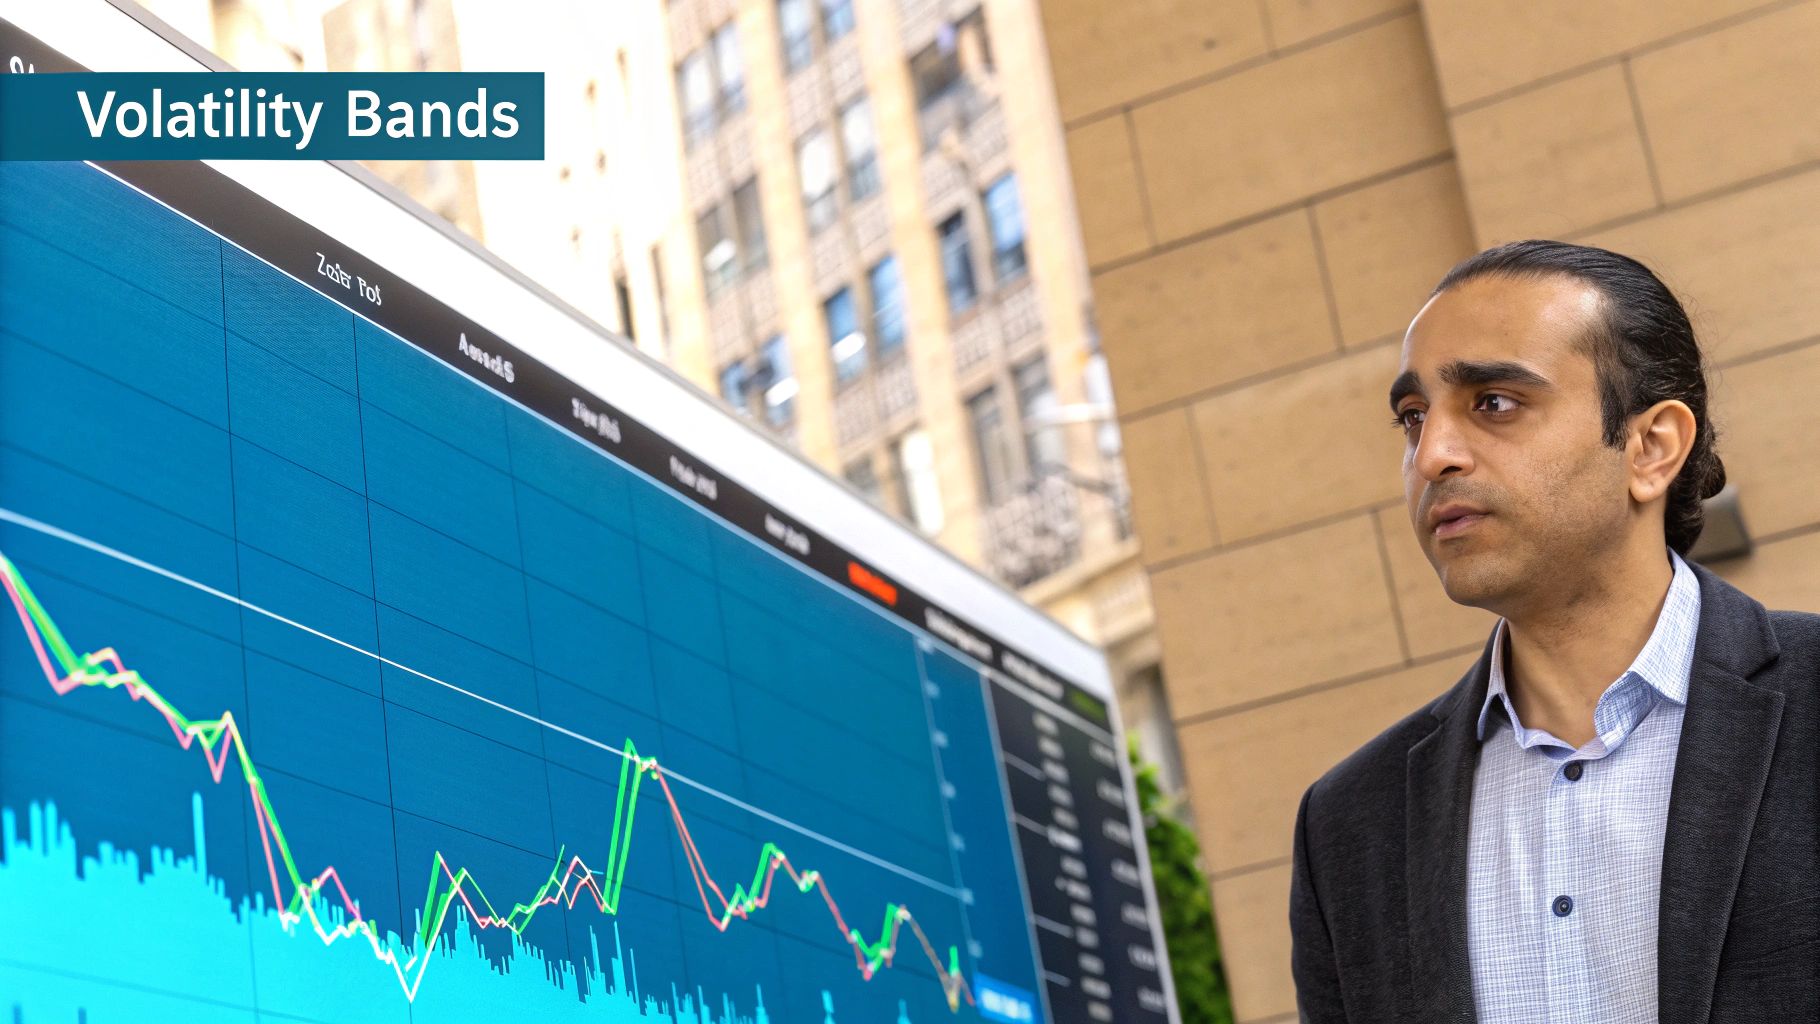
Bollinger Bands are a volatility-based indicator that ranks among the best indicators for swing trading because of their dynamic nature. Developed by John Bollinger, this tool consists of three lines plotted over a price chart: a simple moving average (SMA) in the middle, an upper band, and a lower band. The upper and lower bands are typically set at two standard deviations above and below the middle SMA.
This setup creates a flexible channel around the price. The bands expand when market volatility increases and contract when volatility decreases, providing a clear visual representation of the current market state. For swing traders, this means Bollinger Bands offer dynamic support and resistance levels that adapt to price action in real time, making them invaluable for identifying potential entry and exit points in both trending and range-bound markets.
Effective swing trading with Bollinger Bands goes beyond simply buying at the lower band and selling at the upper one. Nuanced interpretation is key to unlocking their potential.
Pro Tip: Watch for the Bollinger Band Squeeze. This occurs when the bands contract tightly, signaling a period of low volatility. A squeeze often precedes a significant breakout. For instance, Microsoft (MSFT) has shown major band squeezes that were followed by powerful, sustained price moves, giving traders an early warning of an impending high-volatility period.
To increase the reliability of these signals, combine Bollinger Bands with a momentum oscillator like the RSI. If the price touches the lower band while the RSI is also in oversold territory (below 30), the confirmation strengthens the case for a long entry. Similarly, a touch of the upper band with an overbought RSI reading provides a more robust exit signal.
The Stochastic Oscillator is a classic momentum indicator developed by George Lane that has remained a favorite among swing traders for decades. Its enduring popularity makes it one of the best indicators for swing trading because it excels at pinpointing potential turning points in the market. The indicator compares a security's closing price to its price range over a set period, typically 14 bars, and plots the result on a scale of 0 to 100.
The indicator consists of two lines: the %K line (the fast stochastic) and the %D line (the slow stochastic, which is a moving average of %K). When the %K line crosses above the %D line, it signals potential upward momentum. The key zones to watch are above 80, which suggests an overbought market, and below 20, which suggests an oversold market. This provides a clear, visual cue for when a price swing might be exhausted and ready to reverse.
The true value of the Stochastic Oscillator for swing traders lies in its timing signals, especially when filtered for quality.
Pro Tip: For higher-probability trades, focus on stochastic divergence. A bullish divergence happens when the price makes a new low, but the Stochastic Oscillator forms a higher low, signaling underlying strength. For instance, Apple (AAPL) has historically shown bearish divergence, where the price hits a new high while the stochastic makes a lower high, often preceding a significant pullback.
Using the "slow" stochastic setting, often configured as (14, 3, 3), can help filter out market noise and reduce the number of false signals. For maximum effectiveness, always use the Stochastic Oscillator in conjunction with a trend-following indicator, like a moving average, to ensure you are trading with the market's primary momentum and not just catching a temporary counter-trend bounce.
Fibonacci Retracement is a powerful tool used by traders to pinpoint potential reversal zones. It stands out as one of the best indicators for swing trading because it projects probable support and resistance levels where a price correction might end. Based on the mathematical sequence discovered by Leonardo Fibonacci, this indicator uses horizontal lines to mark key percentages: 23.6%, 38.2%, 50%, 61.8%, and 78.6%.
The concept is that after a significant price move in one direction, the price will often retrace or pull back a predictable portion of that move before continuing in the original direction. By drawing the retracement levels between a major swing high and swing low, traders can anticipate where buying or selling pressure may emerge, creating clear opportunities for entry.
For swing traders, Fibonacci levels are not just lines on a chart; they are dynamic zones for action. The goal is to enter a trade during a pullback in the direction of the primary trend.
Pro Tip: The 38.2% and 61.8% levels are often considered the most significant. Confluence is key-look for a Fibonacci level that lines up with other technical signals, like a moving average or a previous support/resistance zone, to increase the probability of a successful trade.
These levels provide a framework for anticipating market movements, but they should be confirmed with other forms of analysis. To master its application, you can explore a comprehensive Fibonacci trading strategy on ezaigo.ai for more advanced techniques.
Always wait for price action to confirm the level, such as a bullish candlestick pattern forming at a support level, before entering a trade. This confirmation helps filter out false signals and improves the reliability of your trading decisions.
The Volume Weighted Average Price, or VWAP, has long been a staple for institutional traders and is increasingly recognized as one of the best indicators for swing trading. It calculates the average price of a security throughout the day, weighted by trading volume. This gives a true picture of the asset’s "fair value" based on actual trading activity, providing a dynamic benchmark that is far more insightful than a simple moving average.
VWAP essentially reveals where the bulk of the day's trading has occurred, making it a powerful magnet for price. Because large institutions often use VWAP to execute orders without significantly impacting the market, retail traders can use it to track where this "smart money" is positioned. It plots as a single line on the chart, typically resetting at the start of each new trading session.
For swing traders, VWAP acts as a dynamic level of support or resistance, offering clear reference points for entries and exits.
Pro Tip: For swing trading over multiple days, use the Anchored VWAP. Instead of resetting daily, you can anchor the VWAP calculation to a specific event, like a major earnings announcement, a previous high/low, or the start of a new trend. For instance, anchoring VWAP to a low on Amazon (AMZN) can show you the average price paid since that bottom, providing a highly relevant support level for the entire subsequent trend.
While the standard daily VWAP is excellent for day trading, the anchored version elevates its utility for swing traders, allowing for analysis across longer timeframes. Combining VWAP with volume profile or other momentum indicators can further validate trade signals, confirming that significant volume is supporting your desired move.
The Average Directional Index, or ADX, is a unique but powerful tool that earns its spot among the best indicators for swing trading by answering a crucial question: is the market trending or not? Developed by the legendary J. Welles Wilder Jr., the ADX measures the strength of a trend, not its direction. It plots this strength on a scale from 0 to 100.
Unlike oscillators that signal overbought or oversold levels, the ADX’s sole purpose is to quantify trend momentum. A rising ADX signifies a strengthening trend (either up or down), while a falling ADX suggests a weakening trend or a ranging market. Generally, an ADX reading above 25 indicates a strong trend is in place, whereas a reading below 20 suggests a weak, non-trending market.
For swing traders, the ADX is an excellent "trend filter." It helps you decide which strategy to deploy: trend-following or range-bound.
Pro Tip: Combine ADX with its companion lines, the Positive Directional Indicator (+DI) and the Negative Directional Indicator (-DI). A common entry signal is when the +DI crosses above the -DI while the ADX is above 25, confirming a strong uptrend. Conversely, a -DI cross above the +DI with ADX over 25 confirms a strong downtrend.
Using ADX to gauge trend strength before committing to a trade is a disciplined approach that helps filter out false signals. During strong trending moves in assets like Gold futures, the ADX often remains above 30, giving traders the confidence to hold their positions through minor pullbacks and capture the larger price swing.
We've journeyed through some of the most powerful and widely-used tools in the swing trader's arsenal. From the momentum-gauging power of the RSI and Stochastic Oscillator to the trend-confirming insights of the MACD and ADX, each indicator offers a unique lens through which to view market dynamics. Bollinger Bands help us contextualize volatility, Fibonacci Retracement maps out potential support and resistance zones, and VWAP gives us a crucial benchmark for institutional activity.
The central lesson is clear: no single indicator is a magic bullet. The true path to proficiency in swing trading lies not in finding one perfect tool, but in building a cohesive system. The goal is to achieve confluence, where multiple, non-correlated indicators point to the same conclusion, significantly strengthening the probability of a successful trade.
Think of these indicators as individual instruments in an orchestra. The MACD might be your steady drumbeat, setting the rhythm of the trend. The RSI could be the violin section, signaling the emotional highs and lows of market sentiment. Your job as the conductor is to make them play in harmony.
A robust strategy often involves combining different types of indicators to cover your bases:
While mastering these indicators is a crucial step, it's important to acknowledge the limitations of manual analysis. Emotional decision-making, like fear of missing out or closing a winning trade too early, can sabotage even the most well-designed strategy. This is where modern technology offers a decisive edge.
The best indicators for swing trading are ultimately the ones you can execute with discipline and precision. This is why many successful traders are turning to advanced, automated tools. These platforms take the foundational principles we've discussed and elevate them by removing emotional guesswork and performing complex calculations in real-time. They can scan for signals across multiple timeframes and assets, something a human trader simply cannot do.
By combining your hard-earned knowledge of these classic indicators with the power of intelligent automation, you transition from simply analyzing charts to executing a high-performance trading system. This synergy allows you to trade with greater confidence, discipline, and efficiency, freeing you from the constant stress of chart-watching and helping you focus on strategic decision-making.
Ready to elevate your swing trading with professional-grade signals and automated analysis? EzAlgo integrates the principles of these core indicators into an all-in-one toolkit for TradingView, providing AI-driven buy/sell signals, automatic support/resistance levels, and real-time momentum alerts. Stop guessing and start trading with data-driven confidence by visiting EzAlgo to see how it can transform your strategy today.


%201.svg)