


At its core, algorithmic trading on TradingView means using its unique programming language, Pine Script, to build, test, and run your own trading strategies. You're essentially taking the rules you use for manual trading—like "buy when the RSI crosses below 30"—and turning them into code.
This lets you rigorously backtest your ideas on historical data and then set up alerts to automatically trigger trades through another service. It’s a powerful middle ground, blending the precision of automation with the oversight of a human trader.
So, why has TradingView become such a popular hub for traders dipping their toes into automation? It really boils down to accessibility. The platform's intuitive design removes many of the traditional barriers, opening up algorithmic trading to people who aren't hardcore programmers. Everything you need is in one place, so you can dream up a strategy, code it, test it, and set it live without bouncing between different, clunky applications.
This self-contained environment is what makes it so appealing. You have all the essential tools right at your fingertips to manage the entire process from start to finish.
Before we dive deeper, let's break down the key pieces of the puzzle you'll be working with. Understanding how these components fit together is the first step toward building a successful automated system on the platform.
These three tools form the foundation of your entire automated workflow on TradingView, from initial idea to live execution.
It’s a common misconception that TradingView executes trades directly on an exchange. It doesn't. Think of it as an incredibly sophisticated signal generator. Your Pine Script strategy is constantly watching the market for you, looking for the exact entry and exit conditions you've defined.
When your strategy's conditions are met, it fires off an alert. That alert sends a specially formatted message, called a webhook, to an outside service or bot. It’s that service that connects to your brokerage account and places the order.
This setup gives you a fantastic amount of control. You can see your strategy's logic playing out directly on the charts, tweak it based on solid backtesting results, and still keep a close watch on the whole operation.
This isn't just a niche hobby, either. It’s part of a huge shift in the financial world. Projections show that by 2025, algorithmic trading could be responsible for around 92% of all forex trades. The speed and emotionless discipline of automation are becoming undeniable advantages, and you can learn more by checking out some of the top algo strategies being used today.
Alright, let's move from theory to practice. This is where the rubber meets the road—turning a trading idea into actual, working code in the Pine Script editor. We're going to build a complete strategy from the ground up, so you can see not just what each piece of code does, but why it's there.
We'll start with a classic: the Moving Average Crossover. It's a simple, trend-following system that's perfect for getting your feet wet with TradingView algorithmic trading. The logic is straightforward: we get a buy signal when a short-term moving average crosses above a long-term one, and a sell signal when it crosses below.
First things first, pull up any chart on TradingView. Look at the bottom of your screen for a tab labeled "Pine Editor." Go ahead and click that to open up your coding workspace. This is home base for writing, testing, and tweaking all your custom scripts.
To kick things off, click "Open" and then select "New strategy." TradingView will give you a basic boilerplate template, which is helpful, but we're going to replace it with our own code step-by-step.
The very first line of any script is non-negotiable; it tells TradingView what you're trying to build. For our project, it needs to be a strategy.
//@version=5
strategy("My First MA Crossover Strategy", overlay=true)
So, what does this little block do?
//@version=5: This just tells the editor we're using Pine Script Version 5, which is the latest and most powerful version. Always start with this.strategy(...): This function is the key. It enables all the backtesting and performance-tracking features we'll need later."My First MA Crossover Strategy": This is just the name you'll see on the chart. Feel free to call it whatever you want.overlay=true: This is a big one. It ensures our strategy's plots (like the moving average lines) appear directly on the price chart, not in a separate box below it.A rigid strategy is a brittle strategy. Instead of locking in specific lengths for our moving averages, let's make them adjustable. The input() function lets us create settings that can be easily changed right from the chart, no code-diving required.
We'll create two inputs: one for a fast Exponential Moving Average (EMA) and one for a slow one.
// Get user inputs for moving average lengths
fastLength = input.int(9, title="Fast EMA Length")
slowLength = input.int(21, title="Slow EMA Length")
Now that we have our lengths, we can calculate the EMAs themselves. We'll use the built-in ta.ema() function. It just needs to know what data to use (the closing price of each bar, or close) and the length we just defined.
// Calculate the moving averages
fastMA = ta.ema(close, fastLength)
slowMA = ta.ema(close, slowLength)
It’s always a good idea to see what you’re doing. We can use the plot() function to draw these MAs right on the chart. It's a simple but effective way to make sure your calculations are doing what you expect.
// Plot the MAs on the chart for visual confirmation
plot(fastMA, title="Fast EMA", color=color.blue)
plot(slowMA, title="Slow EMA", color=color.orange)
This is the brain of our operation—the logic that dictates when to buy and when to sell. We need to tell the script exactly what conditions to look for.
Our entire strategy hinges on the crossover event. Thankfully, Pine Script has a function for that. The ta.crossover() function is smart; it only returns true on the single bar where the crossover actually happens. Its counterpart, ta.crossunder(), does the same for downward crosses.
// Define the entry and exit conditions
longCondition = ta.crossover(fastMA, slowMA)
exitCondition = ta.crossunder(fastMA, slowMA)
Pro Tip: Using the built-in
ta.crossover()andta.crossunder()functions is much safer than trying to build this logic yourself (e.g.,fastMA > slowMA). These functions prevent your strategy from trying to open a new trade on every single candle after the initial cross, which is a common beginner mistake. They pinpoint the event itself.
We've defined our conditions. Now we just need to tell the strategy what to do when they're met. This is where strategy.entry() and strategy.close() come in.
The strategy.entry() function is what opens a trade. You give it a unique name for the trade (an "ID" like "Enter Long"), specify the direction (strategy.long for a buy), and tell it when to fire (when = longCondition).
// Execute the long entry when our condition is met
if (longCondition)
strategy.entry("Enter Long", strategy.long)
To get out of the trade, strategy.close() is the perfect tool. It closes a trade based on the ID we gave it. This is a clean and explicit way to manage your exits, making sure you’re always closing the intended position.
// Close the long position when our exit condition is met
if (exitCondition)
strategy.close("Enter Long", comment="Exit Long")
And that’s it! With all this code in your Pine Editor, click "Add to Chart." You'll see your two EMAs appear, and more importantly, the "Strategy Tester" tab at the bottom will spring to life with a full performance report based on historical data.
You’ve just built your first piece of TradingView algorithmic trading software. Now you can start the real fun: backtesting, tweaking the inputs, and seeing how it performs.
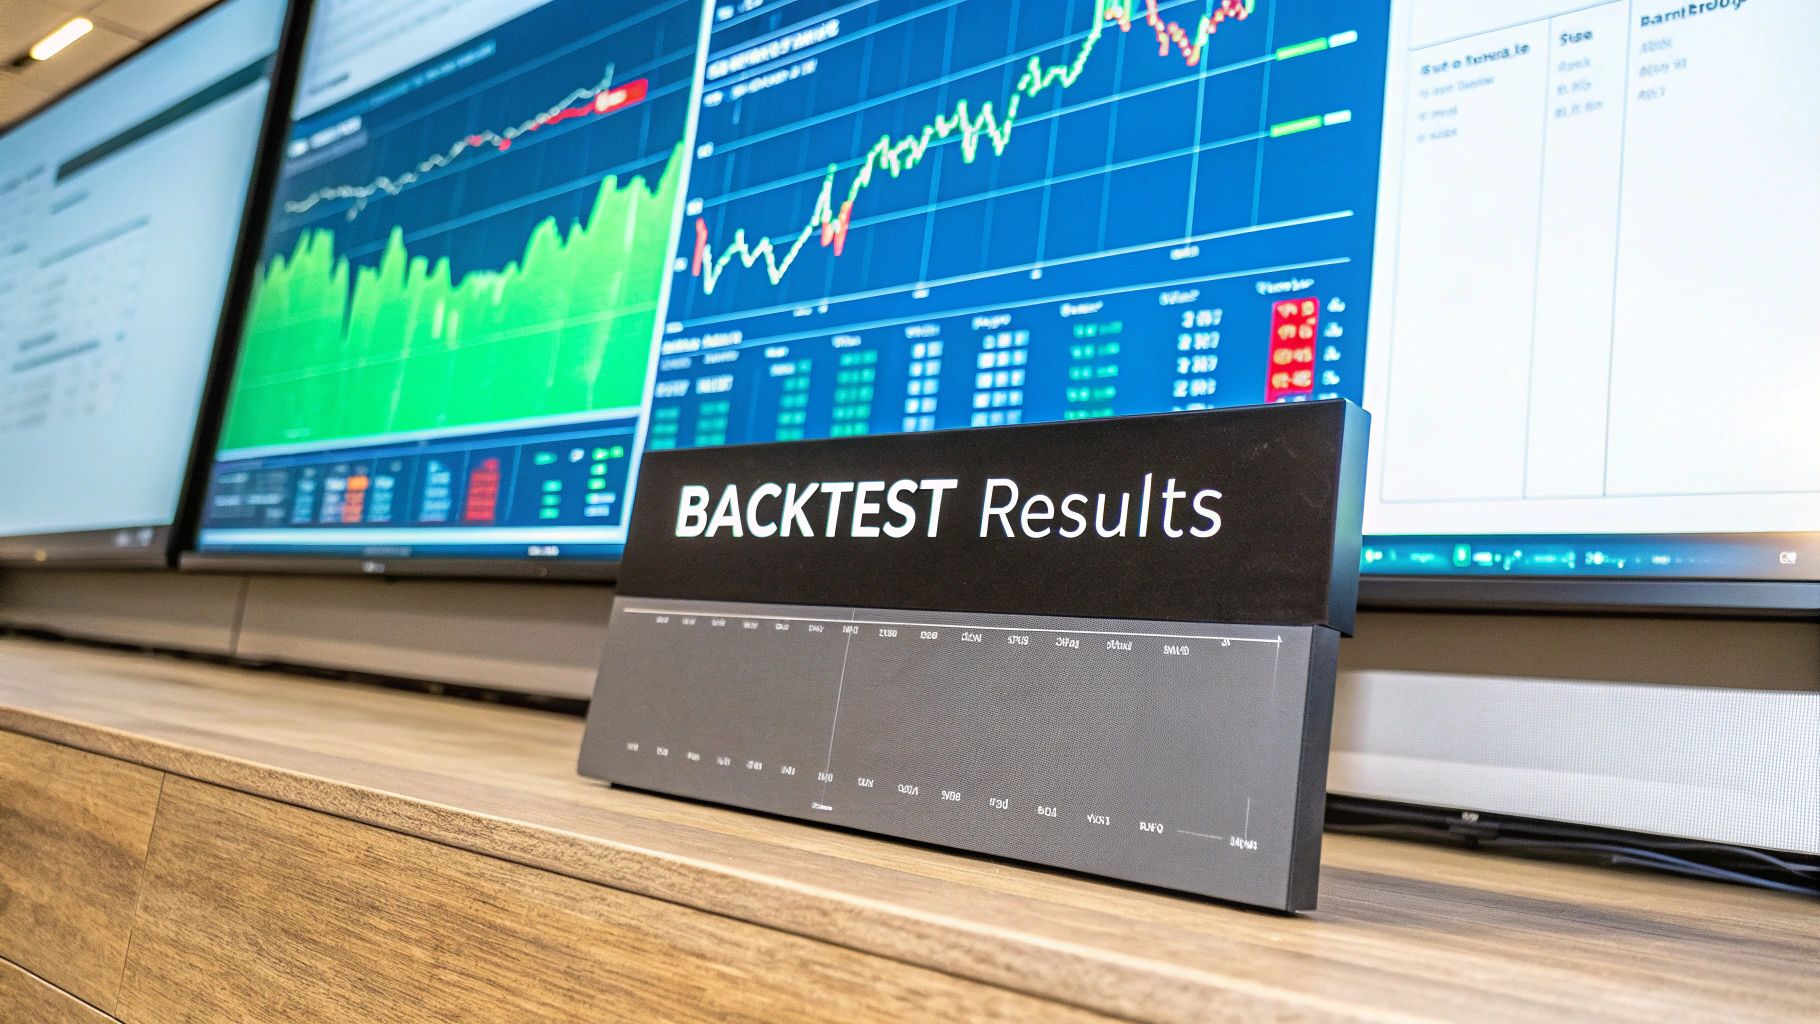
Alright, so you’ve written the code for your strategy. That’s a huge step, but honestly, it’s only half the battle. Right now, all you have is a hypothesis. To see if it holds any water, you need to backtest it, and TradingView's Strategy Tester is the perfect place to do it.
This is your chance to unleash your code on months, or even years, of historical data to see how it would have actually performed.
This part of the process is non-negotiable. It’s where you uncover fatal flaws, tweak your logic, and build real confidence in your system before a single dollar is on the line. Skipping this is like trying to sail across the ocean without a map—you might get lucky, but chances are you’re heading for trouble.
Once you add your strategy to a chart, the Strategy Tester panel at the bottom will come to life with a ton of data. It can look a bit overwhelming at first, but you really only need to focus on a few key metrics to get a solid read on your strategy's health.
These numbers tell a story about risk, efficiency, and consistency that goes way beyond a simple profit figure. For a much deeper look into the nitty-gritty, check out our complete guide on https://www.ezalgo.ai/blog/how-to-backtest-on-tradingview.
For now, let's focus on the essentials:
While metrics give you a great snapshot, they don't tell the whole story. I've seen countless strategies that look incredible on paper but are actually a disaster waiting to happen. This is usually the result of over-optimization, or "curve fitting," where the strategy is so perfectly tuned to past data that it completely falls apart in a live market.
The goal of backtesting isn't to find a strategy that never loses. It's to understand how and when your strategy loses, so you can determine if the risk is acceptable.
To avoid this trap, you have to get your hands dirty and look at the actual trades. The "List of Trades" tab in the Strategy Tester is your new best friend. It gives you a play-by-play log of every single entry and exit.
By digging into that "List of Trades," you can start asking the right questions. When you click on any trade in the list, TradingView will instantly zap your chart to that exact moment in time. This is where the real insights come from, as you can see precisely what the market was doing when your signal fired.
As you review the trades, ask yourself these questions:
This kind of qualitative review is just as crucial as the hard numbers. It helps you learn your strategy's personality—its strengths and, more importantly, its weaknesses. You might find that your moving average crossover gets chopped to bits in ranging markets but is a rockstar in clear trends. That's a priceless piece of information, helping you refine your rules or even decide when to turn the bot off entirely. A proper backtest validates the trading idea, not just the code.
You’ve backtested your strategy, tweaked the parameters, and confirmed it has an edge. So, what’s next? This is where the real magic happens: connecting your carefully crafted logic to the live market. We're about to turn that digital blueprint into an active trading system that can execute orders on its own.
The key to making this happen is a nifty tool called a webhook. Just think of it as a specialized messenger. When your strategy spots a valid trade, TradingView fires off an automated, coded message—the webhook—to a specific URL. This URL is provided by a third-party automation service that you've linked to your exchange account.
This whole setup exists because TradingView itself doesn't place orders. As of 2025, the platform is purely a world-class signal generator, not a direct broker. A whole ecosystem has sprung up to fill that gap, with traders using webhook URLs to bridge their TradingView alerts with external bots that do the heavy lifting of placing orders. In fact, over 75% of algorithmic traders on TradingView use these kinds of integrations to run their systems.
First things first, you'll need to pick a third-party service to catch your webhook alerts. There are plenty of great options out there, like 3Commas or PineConnector, but you could even build a custom solution if you're so inclined. Whatever you choose, the service will give you a unique webhook URL—this is the destination address for all your trading signals.
With that URL in hand, it's time to set up an alert in TradingView. But instead of a simple pop-up, you'll configure this alert to fire based on your strategy's conditions.
Here’s a simple way to visualize how this all connects and flows.
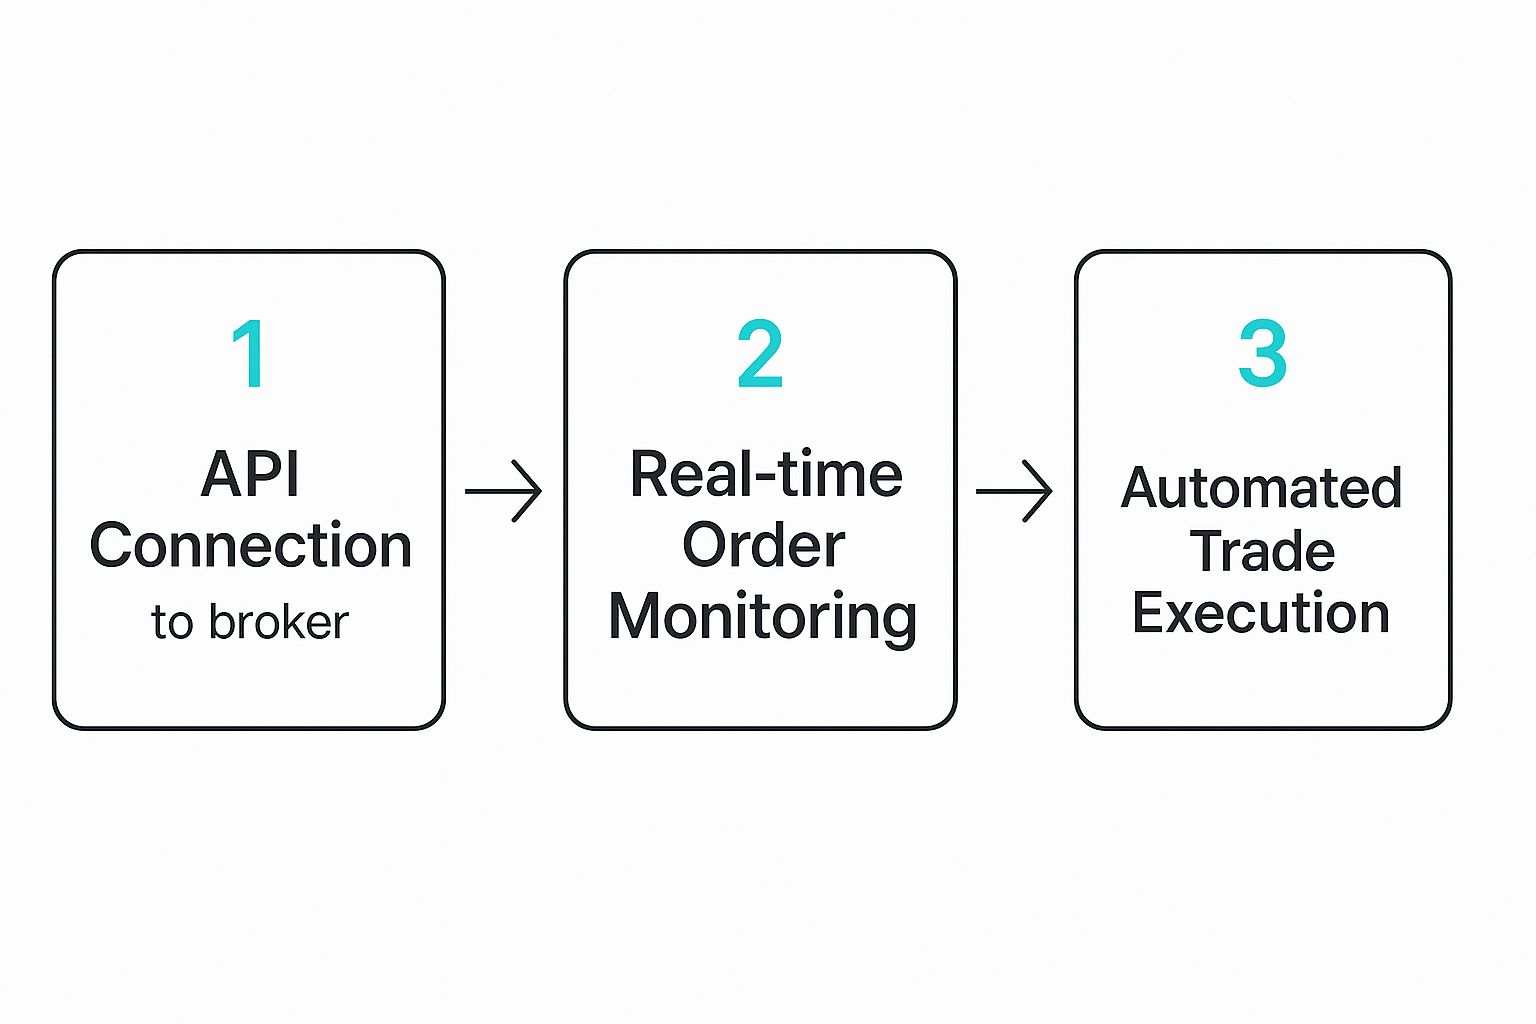
As you can see, your strategy's signal kicks off a chain reaction that goes from the API connection right through to the final trade execution, all without you having to lift a finger.
Inside the alert configuration window, head over to the "Notifications" tab. This is where you'll check the "Webhook URL" box and paste in that unique address from your automation service.
A Quick Word of Caution: That webhook URL is the critical link in your automation chain. Guard it carefully. Anyone with that URL could potentially send signals to your trading bot, so always copy it precisely from your chosen platform and keep it private.
Just sending a ping isn't enough. Your trading bot needs clear instructions: what to buy or sell, how much, and on which market. That's what the alert message is for. You have to format this message in a way the bot can understand, which is almost always JSON (JavaScript Object Notation).
Your automation service will tell you the exact JSON structure it needs. For example, a service might be waiting for a message that looks something like this:
{ "ticker": "{{ticker}}", "action": "{{strategy.order.action}}", "quantity": "1", "passphrase": "YOUR_SECRET_PASSPHRASE" }
This might look a bit technical, but the real power lies in those placeholders wrapped in double curly braces {{...}}. These are dynamic variables that TradingView automatically fills in for you when the alert triggers.
{{ticker}}: This gets replaced with the symbol from your chart (like BTCUSD or AAPL).{{strategy.order.action}}: This is the coolest part. It automatically inserts "buy" or "sell" depending on what your Pine Script strategy just signaled.{{strategy.order.contracts}}: This placeholder pulls in the order quantity you defined in your strategy.Using these placeholders is a game-changer. It means you don't need separate alerts for longs and shorts. One smart, well-written alert can handle all your strategy's signals, keeping your whole setup clean and easy to manage. You can dive deeper into all the available placeholders in our detailed guide on how to set up fully automated trading on TradingView.
Different automation platforms speak slightly different dialects of JSON. Getting the structure right is non-negotiable for a successful setup. Below is a quick comparison to show you how alert messages might differ between services.
See how they both convey the same core information—what to trade, which direction, and how much—but use different keywords ("pair" vs. "symbol")? This is why you must always check the documentation for your specific automation service. One misplaced comma or a wrong keyword can cause the whole trade to fail.
Once you’ve got this configured and tested, your TradingView algorithmic trading setup is officially live and ready to go.

Instead of just using static, unchanging values for your indicators, the next step is to write scripts with logic that adjusts to volatility or momentum. This adaptability is what really separates a decent strategy from a great one. It's the key to performing more consistently across different market environments.
A powerful way to start building adaptive logic into your scripts is by using volatility-based indicators like Bollinger Bands or the Average True Range (ATR). These tools are brilliant because they naturally expand and contract with market chop and strong trends, making them perfect for smarter algorithms.
Here are a few ways to think about this:
The whole point of adaptive logic is to make your strategy less rigid. When you program your system to react to the market's current "personality"—whether it's trending, ranging, or just plain volatile—you give it a much better chance of surviving long-term.
While Pine Script is great, it wasn't built for heavy-duty machine learning. But that doesn't mean you can't use advanced analytics. A lot of traders run complex models on external servers and simply feed the resulting signals into TradingView to be executed. We're even seeing integrations with machine learning models like LSTM and CNN networks, which are showing some incredible directional accuracy on lower timeframes. You can actually see this approach in action to get a better feel for it.
Another technique you'll see the pros use is multi-timeframe confirmation. This is all about writing a script that checks for agreement across different chart periods before it pulls the trigger on a trade.
For example, your strategy might spot a buy signal on the 15-minute chart, but it won't actually execute the trade unless the trend on the 1-hour chart is also pointing up. This simple check helps ensure you're always trading in the direction of the larger, dominant momentum, which can seriously improve the quality of your entries. It definitely requires more complex Pine Script code, but it’s a standard feature in many institutional-grade algorithms for a reason.
Jumping into TradingView algorithmic trading can feel like a lot at first. A few key questions pop up for just about everyone, and getting them sorted out early will save you a ton of headaches down the road. Let's clear up some of the most common ones.
The first thing most people wonder is how a trade actually gets placed. This is probably the most important concept to nail down.
Simply put, no. Think of TradingView as your brain—it's a phenomenal platform for analysis and generating trade signals, but it doesn't have the hands to actually place an order with your broker.
So how do you connect the dots? You need a third-party automation service to act as the middleman. When your Pine Script strategy flags a trade, TradingView fires off an alert with a webhook. This webhook is just a specially formatted message sent to your automation bot, which then connects to your exchange account and executes the trade for you. It's a powerful setup, but it means getting your alert messages just right is absolutely critical.
This is another one that trips people up all the time. On a chart, they can look almost identical, but under the hood, they're built for completely different jobs.
indicator() in Pine Script) is purely for visual analysis. It draws things on your chart like moving averages or an RSI to help you make decisions. It can't run a backtest or show you a P&L report.strategy()) is your backtesting workhorse. It uses commands like strategy.entry() and strategy.close() to simulate how your logic would have performed on historical data. This is where you get the detailed performance reports from the Strategy Tester pane.My typical workflow looks like this: I develop and test my idea using a
strategyscript. Once I'm happy with the backtest results, I convert that logic into anindicatorso I can set up the live alerts needed for automation.
For any kind of real automation, yes, a paid plan is non-negotiable. The free plan just doesn't have the tools you need.
The absolute must-have feature you unlock with a paid plan (Pro, Pro+, or Premium) is webhook notifications. Without webhooks, there’s no way to send your trade signals out of TradingView to your execution bot. Paid plans also give you more alerts, let you use more indicators on a single chart, and remove other limitations that you'll hit almost immediately.
You can't run a heavy-duty Python machine learning model directly inside Pine Script—it just wasn't built for that kind of number crunching. But that doesn't mean you can't incorporate AI into your system.
The standard approach is to run your advanced model on an external server. That server does the complex work and then sends its conclusions—like a simple "buy" or "sell" signal—into TradingView through a webhook. From there, your script can plot the signal on your chart or use it to trigger your automation alerts. It's a clever workaround that lets you combine the best of both worlds.
Ready to skip the complex coding and get straight to actionable insights? EzAlgo provides a suite of advanced, AI-driven indicators that deliver clear buy/sell signals, dynamic support/resistance levels, and momentum shift alerts directly on your TradingView charts. Empower your trading with institutional-grade tools at https://www.ezalgo.ai.


%201.svg)