


Trading supply and demand is all about pinpointing areas on your chart where the big players—the banks and hedge funds—have left their mark. These aren't just random price levels. They are specific zones where a flood of buy or sell orders created a massive market imbalance, causing price to shoot off in one direction.
Learning to see these zones is like learning to read the market's secret language. It lets you trade with the institutions, not against them.

Take a look at the chart above. Those sharp, explosive moves away from a tight price range? That’s what we’re looking for. That’s the direct result of an overwhelming imbalance between buyers and sellers.
At its heart, this strategy is about understanding how the institutional players operate. They can't just dump millions of dollars into a trade without sending the price haywire. So instead, their massive orders build up in specific areas, creating a temporary balance before the market makes a powerful, decisive move.
This process leaves behind two types of zones:
The logic is beautifully simple. When the price returns to one of these "fresh" zones, the remaining institutional orders are likely to get filled, sparking a predictable reaction. This is what makes these zones far more reliable than old-school support and resistance lines, which are often just historical price points with less conviction behind them.
I like to think of these zones as the "footprints" of smart money. They show you exactly where the big institutions have tipped their hand. Once you can spot them, you're no longer just guessing where the market might turn. You're following a clear trail left by the very traders who move prices. That’s a real edge.
Supply and demand zones reveal a fundamental market truth: prices move because of imbalances. By finding where these imbalances started, you can position yourself to catch the powerful reactions that happen when price returns.
Imagine you see a sharp drop after price has been stuck in a range. That’s a huge signal that sellers have seized control. The small consolidation area right before the drop? That’s your high-probability supply zone. When the price eventually climbs back to that level, all the sellers who missed out—plus the institutions with orders still waiting—are ready to jump in and push the price back down.
A critical point to remember is that supply and demand are zones, not single, precise lines. They represent a range where orders were clustered. This gives you a much more practical and forgiving area for your entries and stop losses, unlike a razor-thin support or resistance level that can easily get pierced by normal market noise.
In fact, the strongest zones have very specific characteristics. You're looking for areas with a surge in volume, often 3 to 5 times the average. The price move itself is also important—look for a rally or drop of 2 to 3 percent over just 4 to 8 candles. This confirms a real dominance by either buyers or sellers. For a deeper dive, you can learn more about how to understand these market imbalances on TradeFundrr.com.
Getting a firm grasp on this principle is the first real step. It sets the foundation for everything that follows: spotting the zones, drawing them correctly, and ultimately, executing trades with much higher confidence.

Spotting the right supply and demand zones is what separates a high-probability setup from a costly mistake. The thing is, not all zones are created equal. Some are powerful magnets for price, while others are just market noise that will get you into trouble.
The real skill is training your eye to see the explosive, impulsive moves that signal a genuine imbalance left by institutional players. This is where you move from theory to practical application. You're hunting for areas where price didn't just meander away—it shot away. A demand zone is born from a sharp, aggressive rally, and a supply zone is created by a sudden, powerful drop. That initial move is your biggest clue.
So, what makes a zone strong? To find them consistently, you need a mental checklist. It really boils down to the strength of the move away from the zone, which I like to call the Explosive Price Candle (EPC). A solid zone usually has long-bodied candles breaking away from a tight, small base.
Here are the key things I look for when I’m sizing up a potential zone:
When you find a zone that checks all three of these boxes, you’ve found something with a much higher chance of causing a reaction when price returns. This is a fundamental concept for trading supply and demand zones that you just can't skip.
As you scan your charts, you'll see dozens of areas that could be zones. The art is learning to filter out the weak ones. A weak zone might have a lazy departure, a wide and messy base, or it might have been tested multiple times already. These are low-probability areas that are far more likely to fail.
Let's say you're looking at a 1-hour chart of EUR/USD. You see an area where the price consolidated for ten candles and then just slowly drifted up. That's probably a weak demand zone. But then you spot another area where price based for just two small candles before launching upward with three massive green candles. That is the A+ setup you should be marking on your chart.
A huge mistake I see traders make is treating every consolidation area as a potential zone. The real power is in the imbalance that happens right after the consolidation. If there's no explosive move, there's no real imbalance to trade.
Getting this distinction right is crucial. After a while, you learn to just ignore the mediocre setups and wait patiently for the ones where the evidence of big money is undeniable.
To get even more confidence in your zones, always check them against the higher timeframes. It's a game-changer. A demand zone on a 15-minute chart becomes so much more powerful if it’s sitting right inside a larger demand zone on a 4-hour or daily chart. This alignment, or confluence, stacks the odds in your favor.
Here’s how I do it in practice:
This top-down approach stops you from taking trades against the bigger market flow. For example, trying to short a 15-minute supply zone right as price is hitting a fresh daily demand zone is a recipe for disaster. The buying pressure from that daily chart will almost always win.
By combining a solid read on a zone's strength with its freshness and its alignment on higher timeframes, you create a powerful filtering process. This disciplined approach is the cornerstone of consistent profits when trading supply and demand zones.
Once you've got a feel for spotting these zones, the next step is to draw them accurately on your chart. This is more than just a technicality—it's crucial. Drawing a zone just a little bit off can be the difference between a perfect entry and getting stopped out before the real move even starts. Precision matters.
A common question I get is whether to use the candle bodies or the wicks when drawing the zones. After spending thousands of hours staring at charts, I’ve found the most reliable method is to capture the entire price action that forms the base.
Here’s how I do it in TradingView:
Marking a zone on your chart is just step one. The real skill is in validating its strength. A box on a screen means nothing on its own. But a zone that’s backed up by other technical signals? Now that’s a high-probability setup.
This is where the idea of confluence comes in. It's just a fancy word for multiple, independent trading signals all pointing to the same conclusion at the same price level.
When a supply or demand zone lines up with something else—like a key moving average (50 or 200 EMA) or a major Fibonacci level (61.8% is a classic)—its power multiplies. This is how you stack the odds in your favor.
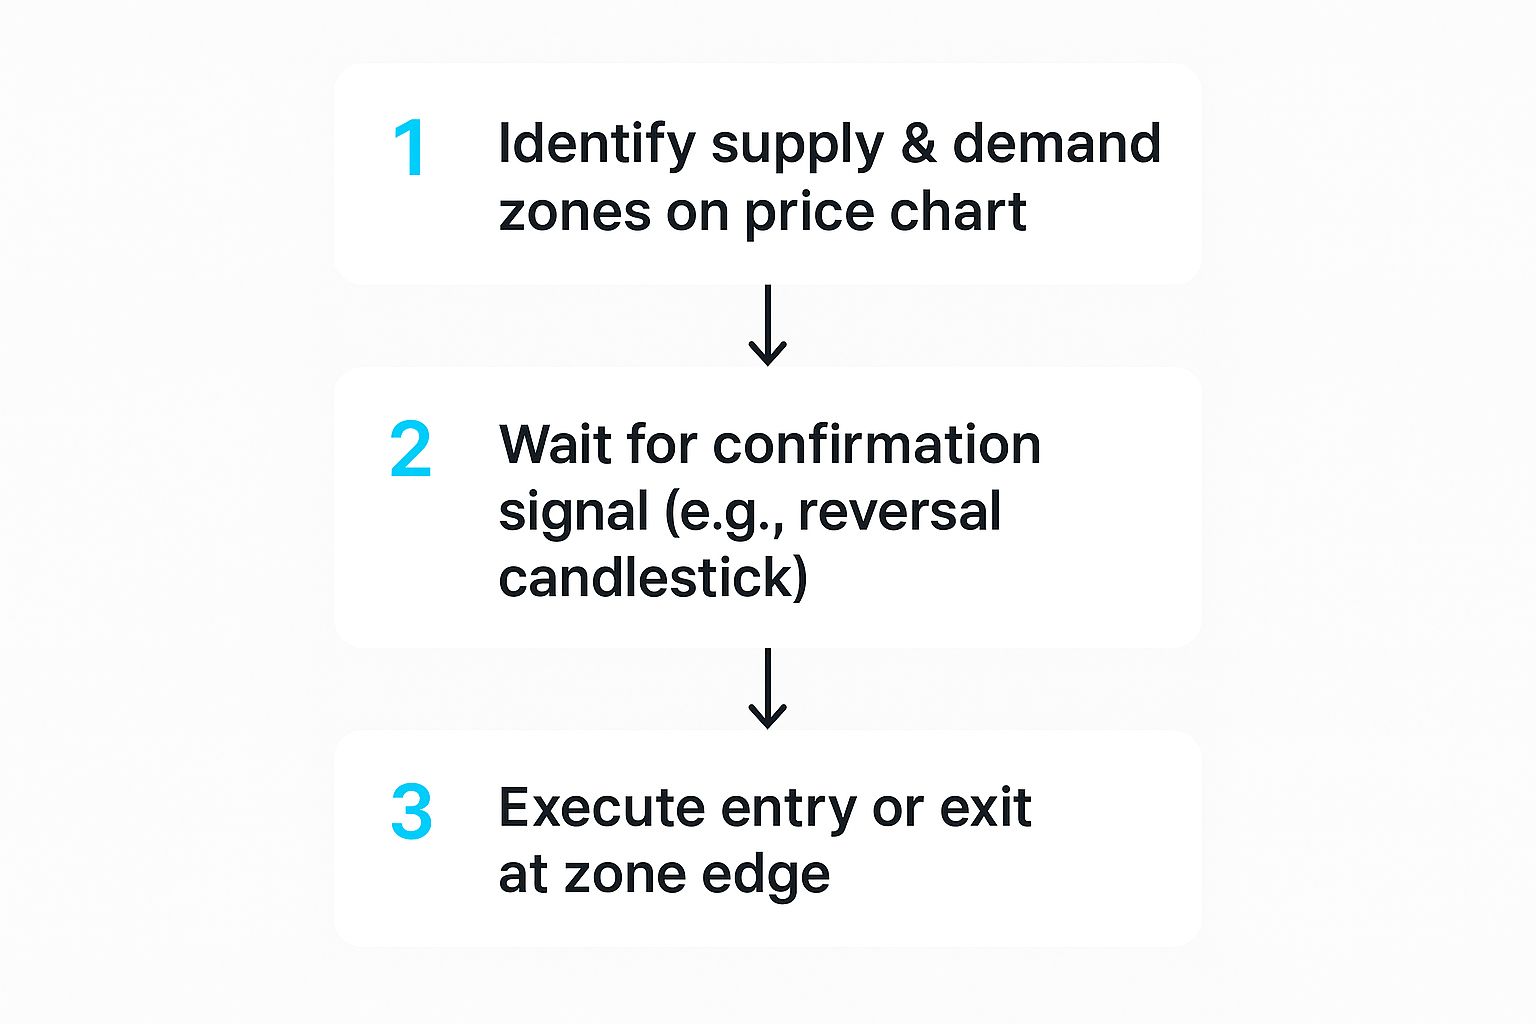
This simple flow reminds us that it's a two-part process: first, you find and draw the zone correctly. Then, you wait for confirmation before you even think about placing a trade.
To keep my analysis consistent and emotion-free, I run every potential zone through a mental checklist. It’s a simple scoring system—the more boxes a zone ticks, the more confident I am in the trade, and the more I’m willing to risk.
Use this checklist to score the strength of a supply or demand zone. The more checks, the higher the probability.
This checklist forces you to build a strong case for every trade you take. You’re not just hoping; you're operating based on evidence.
You won't always find a setup that ticks every single box. That's not the point. The goal is to be selective and wait for the A+ opportunities—the ones that check at least three or four of these boxes.
This disciplined approach is what separates consistently profitable traders from the rest. It removes the guesswork and forces you to wait for the market to hand you a high-quality setup.
Of course, before you risk real capital, you need to prove to yourself that your strategy works. The best way to do that is through backtesting. For a detailed walkthrough, check out our complete guide on how to backtest effectively on TradingView.
Spotting a great supply or demand zone is a huge win, but it’s really only half the battle. The real money isn't made by just finding zones; it's made by how you act on them. This is where a rock-solid plan for your entry, stop-loss, and take-profit turns good analysis into a repeatable, profitable process.
Without a clear execution strategy, even the most perfect-looking zones can end in losses. You absolutely have to know precisely when to get in, where to cut your losses, and when to cash in your profits.
Let's break down how to build that framework.
How you enter a trade directly shapes your risk and your potential reward. There's no single "best" way to do it; the right method comes down to your personal risk tolerance and trading style. Most entries, however, fall into two camps: aggressive or conservative.
An aggressive entry is pretty straightforward: you set a limit order right at the edge of the zone and wait for the price to hit it. You're basically betting that the zone will act as a wall the second price makes contact.
A conservative entry, on the other hand, is all about patience. You wait for the price to actually enter the zone and then look for a specific price action signal before you pull the trigger.
This signal could be anything from a bullish engulfing candle in a demand zone to a bearish pin bar at a supply level. You might give up a few pips on your entry, but you gain a much higher degree of confidence that the zone is holding.
Think of your stop-loss as your safety net. It's the most critical order you'll place because it caps your maximum risk and saves your account from a disaster. When you're trading supply and demand zones, where you place your stop-loss isn't a guessing game.
A classic mistake is setting stops too tight, often placing them inside the zone itself. This is a surefire way to get stopped out by normal market noise right before the price moves in your favor.
A proper stop-loss should always be placed just beyond the outer edge of the zone. This gives the trade room to breathe and confirms the zone has truly failed if your stop gets hit.
For a demand zone, your stop should be a few pips or ticks below the lowest wick of the zone's base. For a supply zone, it goes just above the highest wick. This simple rule is key to staying in trades that work and getting out of those that don't.
Knowing when to exit a winning trade is just as crucial as knowing when to enter. Greed has a nasty habit of turning a great trade into a break-even or even a losing one. Having a pre-planned exit strategy is how you keep emotion out of the equation.
Here are two of the most effective ways to take profits:
For traders looking to get more advanced with their exits, our guide on how to set a take-profit and stop-loss dives into more detailed techniques.
Let's walk through what this looks like in practice.
Let's say you've spotted a fresh, high-probability demand zone on the 4-hour chart of BTC/USD between $60,000 and $60,500. The absolute lowest wick in that zone is at $59,950. You see the next major supply zone sitting up at $62,500.
This systematic approach—entry trigger, logical stop, and clear target—is what separates professional trading from gambling. It provides structure, manages risk, and builds the discipline you need for long-term success in the markets.
Alright, so you've learned how to spot high-probability zones and you have a plan for how to trade them. That's a huge step. But even the sharpest analysis can fall apart if you stumble into a few common, costly traps.
Frankly, learning what not to do is one of the fastest ways to protect your trading account and build the kind of discipline that leads to real consistency. I’ve seen countless traders, especially early on, make the same predictable mistakes. Let's walk through them so you can sidestep these issues from the get-go.
This is probably the biggest one. It’s easy to treat all zones as if they have the same potential, but they absolutely don't. A "fresh" zone—one that price hasn't revisited since it was formed—is where the real magic happens. It has the most pent-up order flow.
Every time price dips back into a zone, it eats away at those orders. Think of it this way:
A zone that’s been hit multiple times is what we call "stale." It's a low-probability play.
A huge part of this game is knowing when to sit on your hands. Trying to force a trade from a weak, over-tested zone is just gambling. Patience pays the bills.
Here's another classic blunder: trying to short a little supply zone in the middle of a screaming bull market. Or going long on a demand zone when the chart is in a nosedive. It might feel like you're catching a reversal, but in reality, you're standing in front of a freight train.
The best, highest-probability trades are the ones that flow with the current. In a clear uptrend, you should be looking for pullbacks into demand zones to get long. In a downtrend, you hunt for rallies into supply zones to go short. Aligning with the bigger picture dramatically tilts the odds in your favor.
We all want to protect our capital, but putting your stop-loss way too close to your entry is a surefire way to get knocked out of good trades. This is usually driven by fear—the fear of taking a bigger loss.
Here's the key: a proper stop-loss needs to be placed just beyond the outer boundary of the zone itself. That little bit of extra room gives the trade space to breathe. It accounts for the market "noise" and the tendency for price to poke just outside the zone before it turns. If you place your stop inside the zone, you're just asking to get stopped out moments before the move happens.
And finally, we have the purely mental trap. You've been watching the charts for hours, nothing is happening, and you feel that itch to "just do something." So, you jump into a mediocre setup that doesn't really meet your criteria.
I've learned this the hard way: successful trading is about 80% waiting and 20% executing. If a zone doesn't look perfect, if the risk-to-reward is off, or if it doesn't align with your plan, the right move is to do nothing at all. Sidestepping these common errors is just as crucial as finding the perfect entry point.
It's natural to have questions when you start putting a new strategy into practice. Let's tackle some of the most common ones that come up when traders first start working with supply and demand zones. I want to give you clear, no-nonsense answers to help you get the hang of it.
You'll spot these zones on every chart, from the 1-minute all the way up to the monthly. But the real magic happens on the higher timeframes—think the 4-hour, daily, and weekly charts.
Why? Because these charts cut through the day-to-day market noise. They give you a much cleaner view of where the big institutions are really placing their bets, and that's the core of this whole strategy.
A great approach many pros use is to combine timeframes:
This way, you’re not just taking a random trade; you're aligning your move with the powerful, underlying market trend, which stacks the odds in your favor.
That's a fantastic question, and it gets to the heart of what makes this strategy different. Standard support and resistance are just lines on a chart. They show you where the price has turned around in the past.
Supply and demand zones tell you why the price turned around. These are not just lines; they are areas packed with unfilled orders left behind by big market players right before a sharp, explosive move. It's this imbalance that gives them their predictive power.
Simply put, you're not just trading a historical line in the sand. You're trading from the very origin point of a significant market move.
Think of a zone's power like a battery—it drains a little every time it's used. A "fresh" zone that price hasn't revisited is always the strongest because it's full of those original, untouched orders.
A zone is usually considered "broken" once the price smashes through it with a strong, confident candle and closes on the other side. Another red flag is when price keeps tapping the zone but the bounces get weaker and weaker. That's a sign the orders are getting used up, and the zone is about to fail.
The trick is to watch how the price behaves when it returns to a zone. A sharp, violent rejection tells you the zone is still very much alive. A weak, hesitant reaction? That’s your cue to be careful, as the zone might not hold.
Ready to stop guessing and start seeing the market like the pros? EzAlgo equips you with AI-driven tools that automatically identify high-probability supply and demand zones, giving you a clear edge.
Elevate Your Trading Strategy with EzAlgo Today!


%201.svg)