


When you're staring at a price chart, reversal patterns are like visual warnings that the market's direction might be about to do a complete 180. Picture a tug-of-war where one side is clearly winning, but suddenly they start to lose their grip. These patterns capture that exact moment when momentum is about to shift from the buyers to the sellers, or vice versa.
Learning to spot them is one of the most fundamental skills you can develop for timing your entries and exits with more confidence.
Think about a strong trend playing out on your screen—maybe a stock is in a powerful uptrend, making higher highs, or it's in a steep downtrend, constantly pushing lower. Eventually, that energy has to run out. This is where reversal patterns become your best friend. They are distinct formations that show the current trend is losing steam and a new one could be just around the corner.
This is different from a continuation pattern, which is more like the market taking a quick breather before continuing in the same direction. A reversal pattern is a much stronger signal, warning you that the dominant players—whether buyers or sellers—are getting tired. It’s this change in market psychology that carves out these recognizable shapes on the chart.
At their heart, every reversal pattern tells the story of a battle between the bulls (buyers) and the bears (sellers). A bearish reversal pattern, which shows up at the peak of an uptrend, reveals that buyers are struggling to push prices any higher. They're running out of steam, and sellers are starting to take control, eventually forcing the price back down.
On the flip side, a bullish reversal pattern forms at the bottom of a downtrend. This shows that the sellers are exhausted. They’ve been pushing prices down, but they can’t keep it up forever. Buyers see this weakness as a great opportunity to jump in at a bargain price, which starts driving the market up again.
Being able to read these psychological turning points on a chart is what separates reactive traders from proactive ones. These patterns give you a peek into the market’s collective mindset before the new trend is obvious to everyone else.
Getting a handle on these formations is a game-changer for a few key reasons. They're especially useful in volatile markets where sharp turnarounds happen all the time. For example, a bullish reversal day in the stock market is when a stock opens low but then rallies hard to close above the previous day's high—a powerful sign that sentiment has flipped from bearish to bullish.
You can learn more about how these daily moves work by exploring some trading reversal day strategies.
To help you get started, here is a quick guide to some of the most common reversal patterns you'll come across.
This table summarizes some of the most frequent bullish and bearish reversal patterns. Think of it as a cheat sheet to help you quickly identify what the market might be telling you.
Familiarizing yourself with these shapes will make it much easier to spot potential turning points as they happen in real-time.
You know how a long, steady climb can leave you feeling exhausted at the top? Markets feel that way, too. After a strong run-up, buying pressure can start to fizzle out, and the momentum that carried prices higher begins to shift. Spotting these moments—these bearish reversals—is a crucial skill for protecting your gains and even finding new opportunities on the downside.
Bullish patterns signal that a market might be bottoming out, but trading reversal patterns do the opposite. They pop up at the peak of an uptrend, serving as a warning that the buying frenzy is losing steam. Let's walk through three of the most common and reliable bearish patterns you'll see on the charts: the Head and Shoulders, the Double Top, and the Rising Wedge.
This image shows a textbook example of a Head and Shoulders pattern, one of the most recognized bearish formations, right on a trading chart.
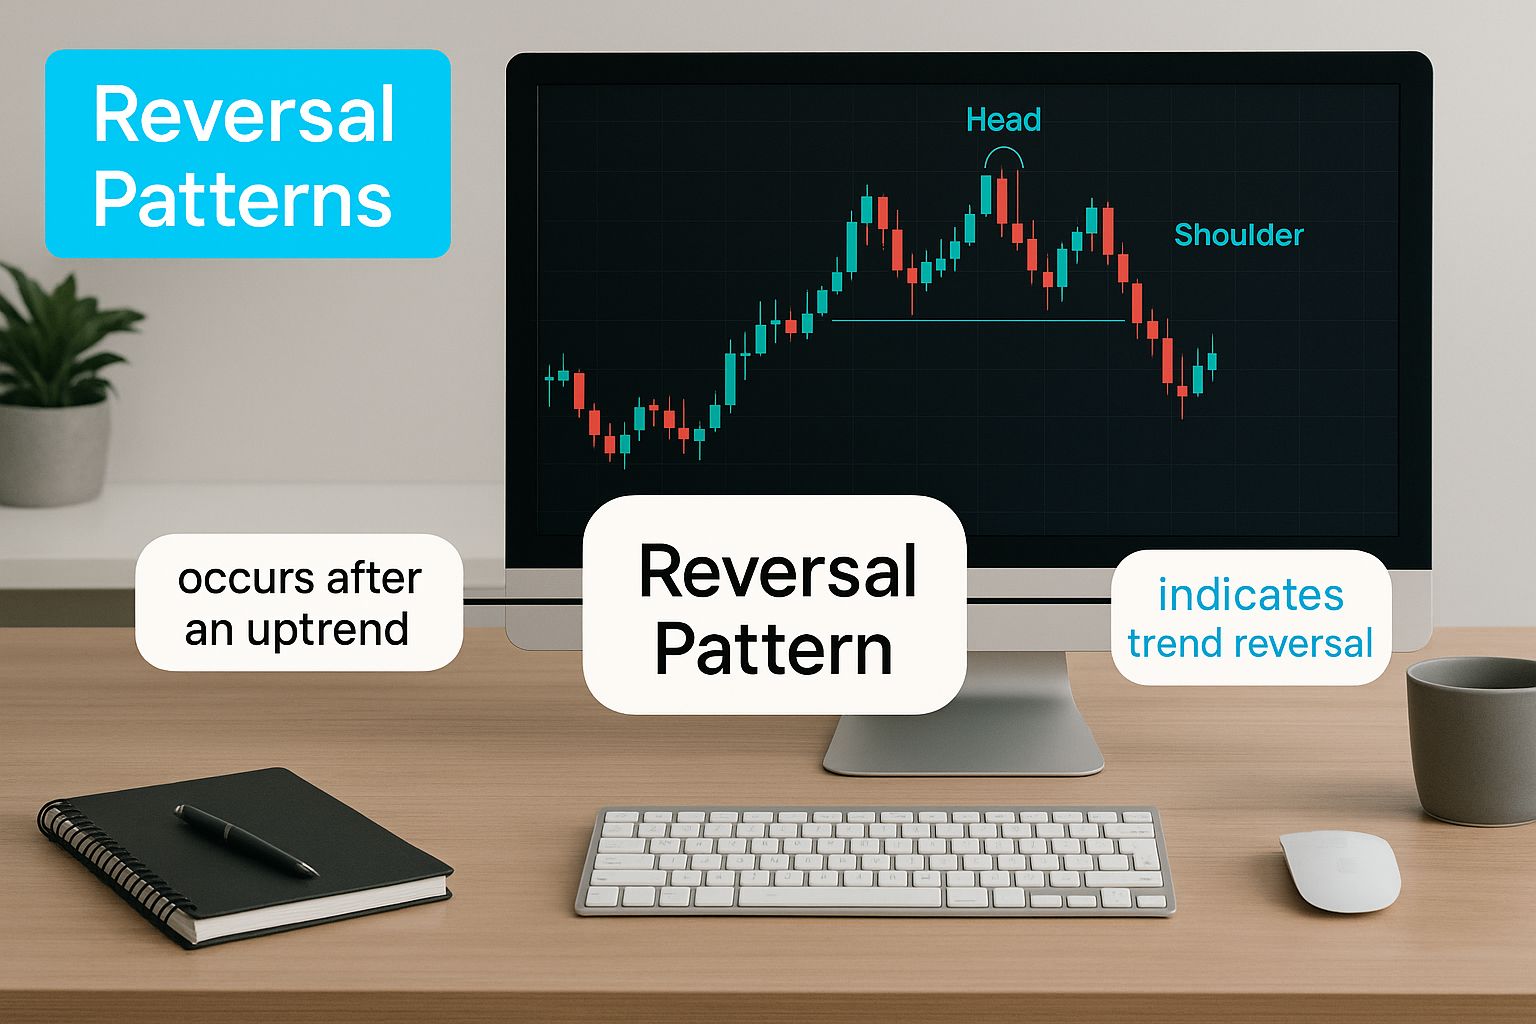
You can clearly see the three distinct peaks that give the pattern its name, offering a perfect real-world illustration of how these formations take shape.
The Head and Shoulders is probably the most famous bearish reversal pattern out there, and for good reason. It gets its name from its distinct shape: three peaks, where the middle one (the head) is the highest, and the two on either side (the shoulders) are lower. It tells a very clear story of an uptrend running out of gas.
Here’s the play-by-play:
The key to this whole setup is the neckline—a support line drawn by connecting the low points of the pullbacks. The pattern is officially confirmed when the price breaks below this neckline, ideally with more trading volume. That breakdown is your signal that the sellers have wrestled control away from the buyers.
A Head and Shoulders pattern is like the final, tired gasp of a bull run. The right shoulder's failure to make a new high is the first sign of weakness; the neckline break is the starting gun for a new downtrend.
Think of the Double Top as the Head and Shoulders' simpler, but just as potent, cousin. It looks just like a capital "M" on the chart. It forms when the price hits a high, pulls back, and then rallies to that exact same high again, only to be rejected. This failure to push higher is a huge red flag.
The psychology is pretty simple. Buyers tried to break through a resistance level and failed. They regrouped and tried again, but the sellers at that level were just too strong. This second failure shows that buying power has been completely absorbed.
Confirmation Checklist for a Double Top:
The Rising Wedge is a bit more subtle, but it's a powerful bearish signal. You'll see it when the price is getting squeezed between two upward-sloping trend lines that are moving closer together. Even though the price is technically still making higher highs and higher lows, the narrowing range shows that momentum is fading fast.
Imagine trying to push a boulder up a hill that keeps getting steeper. You're still moving up, but each push gets harder and covers less ground. Eventually, you run out of energy, and the boulder rolls back down. That's the Rising Wedge in a nutshell.
The pattern completes when the price finally breaks below the lower support trend line, often leading to a sharp drop. In fact, studies show the Rising Wedge has a downside breakout over 60% of the time, making it an essential pattern to have in your toolkit for catching reversals before everyone else does.
After a long, punishing downtrend, the market often gets tired. Think of it like a marathon runner finally hitting the wall. The sellers who have been in charge start running out of steam, and savvy buyers, smelling a bargain, begin to creep back in. This subtle shift in momentum carves out some very specific trading reversal patterns on the charts, giving us a heads-up that the trend might be about to flip from down to up.
We just looked at bearish patterns, so now let's flip the script and dive into three of the most reliable bullish formations: the Inverse Head and Shoulders, the Double Bottom, and the Falling Wedge. Spotting these patterns can help you identify when a market is "bottoming out," offering great potential entry points for new long positions.
This chart shows a classic Double Bottom, a textbook signal that selling pressure is fading and buyers are muscling their way back in.
You can't miss that distinctive "W" shape. It’s a visual story of sellers trying—and failing—twice to push the price to new lows.
Just as the classic Head and Shoulders pattern can signal a market top, its mirror image—the Inverse Head and Shoulders—is a strong indicator of a potential market bottom. It tells a story of sellers making three attempts to shove the price down, but with each push, they lose a bit more of their power.
Here’s how the pattern typically plays out:
The key to this pattern is the neckline, which is a resistance line you can draw by connecting the high points of the two rallies. The bullish reversal is confirmed once the price breaks above this neckline, especially if it happens on a surge of trading volume.
The Double Bottom is one of the easiest bullish reversal patterns to spot and one of the most dependable. It forms a clear "W" on the chart and tells a simple but compelling story: a downtrend is hitting a wall at a major support level.
The pattern takes shape when the price drops to a low, bounces, and then falls back to test that exact same low again before rallying strongly. That second failure by the sellers to break through support is a huge sign of their exhaustion. Buyers see this as a solid floor and step in with more confidence, stopping the price from falling any further.
A Double Bottom is like testing the foundation of a building. The first low is an initial test. The second, successful defense of that level proves the support is solid and a rally is probably on the way.
The pattern is considered complete, or validated, once the price breaks above the resistance level formed by the peak between the two bottoms. That breakout is your signal that the bulls are officially back in charge.
The Falling Wedge is a more subtle but equally powerful bullish reversal pattern. It shows up when the price gets squeezed between two downward-sloping trend lines that are moving closer together. Even though the price is still making lower highs and lower lows, the moves are getting shorter and less aggressive.
Imagine a bouncing ball that's losing momentum. Each bounce is a little lower than the last, but the distance it falls also shrinks, until it finally settles and changes direction. The contracting price action inside the wedge signals that the sellers are simply running out of gas.
The real fireworks start when the price breaks out decisively above the upper resistance trendline. This breakout often triggers a quick and explosive move upward as all that pent-up energy is released. In fact, technical analysis studies have shown the Falling Wedge has an upside breakout rate of over 68%, making it a fantastic pattern for spotting potential bottoms.
These patterns aren't just squiggles on a chart; they're visual clues about timing. Interestingly, some reversals happen on surprisingly short timeframes. For example, end-of-day (EOD) reversal patterns are a well-documented phenomenon where stocks that have dropped sharply during the day often rebound in the final 30 minutes of trading. You can explore the research on these asymmetric EOD reversals to see the data behind this effect.
Seeing a reversal pattern form on your chart is one thing. Knowing exactly what to do with it is another game entirely. It's the difference between spotting a storm cloud and having a solid plan to stay dry.
To trade reversals effectively, you can't just jump in and hope for the best. You need a simple, repeatable framework. This plan rests on three critical decisions you must make before you ever place a trade: your entry point, your stop loss, and your profit target. Get these right, and you're trading with a clear head. Get them wrong, and you're just gambling.
Let's walk through how to build this framework so you can act on these signals with confidence.
Okay, so you’ve spotted a Head and Shoulders pattern taking shape. Now what? The big question is when to pull the trigger. Your entry point sets the stage for the entire trade, and you generally have two ways to play it.
The Aggressive Entry: This means you get in before the pattern officially confirms. For a bearish Head and Shoulders, you might short the market as the right shoulder starts to roll over, failing to push higher. The upside? You get a fantastic entry price and a bigger potential profit. The risk, of course, is that the pattern fizzles out, and you get caught in a false signal.
The Conservative Entry: This is for the patient trader. You wait for clear confirmation. With a Head and Shoulders, that means waiting for the price to decisively break below the neckline. For a Double Bottom, you'd wait for it to break above the resistance line. Many traders take it a step further and wait for a breakout and retest—where the price breaks the key level, pulls back to touch it, and then continues in the new direction. This provides the strongest validation, but your entry price won't be as good.
Your choice here really comes down to your personality and risk tolerance. There isn't a "right" or "wrong" answer. The best approach is the one that lets you sleep at night.
Let's be clear: no pattern is a guarantee. Reversals fail. That's why your stop loss isn't optional—it's your safety net. It's the one thing that protects your capital when you're wrong.
Placing it correctly is an art. Too tight, and normal market "noise" will knock you out of a good trade. Too wide, and you're risking more than you should. The trick is to place your stop loss at the exact price level that proves your trading idea was wrong.
Where to Place Your Stop Loss:
The final piece of the puzzle is knowing when to take your profits and walk away. One of the most classic and reliable ways to set targets for trading reversal patterns is the measured move technique. This simple method uses the size of the pattern itself to project how far the price might go.
Here’s how it works: you measure the vertical distance from the pattern's highest point (the head in a Head and Shoulders) down to its breakout level (the neckline). Then, you project that exact same distance down from the point where the price broke the neckline.
This gives you a logical, data-driven target. It takes the emotion out of the exit, so you aren't closing the trade too early out of fear or holding on too long out of greed. You have a plan, and you just have to follow it.

Spotting a classic trading reversal pattern on your chart can get your heart racing. But trading on that pattern alone is a bit like trying to find your way in a new city with just one landmark. You might get lucky, but you could also end up completely lost.
Real confidence in a trade comes from confluence—that sweet spot where several different signals all point in the same direction.
This is where technical indicators become your best friends. They help you filter the good setups from the bad, separating the real opportunities from the market noise. Let's look at three powerful tools that can help you confirm what you're seeing.
Momentum almost always leads price. Think of it like a heavy train; it starts to slow down long before it actually comes to a stop. A momentum indicator, like the Relative Strength Index (RSI), can show you this subtle shift in strength or weakness before it's obvious on the price chart.
One of the most reliable signals you can get from the RSI is divergence. This is when the price and the indicator start telling you two different things.
A divergence is the market's way of whispering that the current trend is on borrowed time. It's an early warning that gives you a heads-up before the reversal becomes obvious to everyone else.
If divergence is a whisper, then volume is a shout. Volume shows you the conviction behind a move. A breakout from a reversal pattern is only as good as the volume that backs it up.
Think about pushing a boulder. A light tap won't do much. But a powerful, committed shove will get it rolling. It's the exact same principle with chart patterns.
For a closer look at this, our guide on trend reversal indicators offers even more tools to build a solid confirmation checklist.
Finally, think of a simple moving average (MA) as a dynamic line in the sand. It can give you that last piece of the puzzle. Many traders rely on the 50-period or 200-period MA to quickly tell them if the market is generally bullish or bearish.
When a bullish reversal pattern forms and the price then decisively breaks above a key moving average, it's a strong sign the bigger trend is shifting in your favor. On the flip side, if a bearish pattern is followed by a break below the MA, it adds another layer of proof that the sellers are taking over.
Trading reversal patterns can feel like you've been handed a secret map to the market's next move. But for every trader who follows that map to profit, another falls into a predictable trap. Simply spotting a pattern is the easy part; it's avoiding the common blunders that truly separates the consistently profitable from the rest.
One of the biggest mistakes is jumping the gun. You see what looks like a textbook Inverse Head and Shoulders, so you rush into a long position while the right shoulder is still forming. The problem is, that pattern isn't real—it isn't confirmed—until the price decisively breaks above the neckline. Entering early isn't a strategy; it's a bet that the pattern will play out, and that's a gamble that rarely pays off.
Another classic pitfall is developing tunnel vision. It's easy to get so focused on a pattern that you completely miss the bigger picture. A gorgeous Double Bottom pattern doesn't mean much if it's forming right in the middle of a brutal, news-fueled downtrend. Context is everything. Is that pattern appearing at a major, historically significant support or resistance level? If so, its potential is far greater.
Along the same lines, ignoring trading volume is a rookie move. A breakout from any reversal pattern on weak, unconvincing volume is a giant red flag.
A breakout without volume is like a car trying to accelerate without gas—it might lurch forward for a moment, but it’s not going far. Real conviction is backed by a surge in trading activity, confirming that big money is making the same move you are.
Even with a perfectly confirmed pattern, sloppy risk management can turn a winning trade into a loser. Setting a stop-loss order too tightly is a prime example. You place it just a few ticks below the breakout point, only to get stopped out by normal market noise right before the price takes off in your intended direction. Your stop-loss needs room to breathe. For a deeper dive, check out our guide on the best stop loss strategy to really nail this down.
Finally, confirmation bias is the silent killer of trading accounts. This is our natural tendency to see what we want to see, not what the chart is actually telling us. If you're dead set on finding a bullish signal, you'll start seeing Double Bottoms in every minor dip and rally, conveniently ignoring all the evidence that points the other way.
This is exactly why a rigid, non-negotiable trading checklist is so important—it forces you to stay objective. Remember that broader market cycles can also play a role. For instance, extensive studies of the S&P 500 have shown a consistent 1-month aggregate market reversal tendency over a 45-year period, where one month's performance often has an inverse relationship with the next. You can discover more about these S&P 500 findings to better understand these macro-level currents.
When you're new to using reversal patterns in your trading, a lot of questions pop up. That's completely normal. Let's walk through some of the most common ones to clear things up and help you trade with more confidence.
Think of reversal patterns less like a crystal ball and more like a weather forecast—they give you probabilities, not guarantees. Their true power comes from confluence, which is just a fancy way of saying multiple signals are all pointing in the same direction.
A reversal pattern popping up at a price level that has been important in the past is a much stronger signal than one that forms in the middle of a random price swing. Context is everything.
Imagine you spot a Double Top. On its own, it's interesting. But if you also see bearish RSI divergence and a spike in selling volume as the price breaks down? Now you're looking at a high-probability setup. Without that extra evidence, it's just a shape on a chart.
The cool thing about reversal patterns is that they're fractal—they show up everywhere, from the tiny one-minute charts all the way up to the weekly ones. The "best" timeframe isn't a one-size-fits-all answer; it depends entirely on your trading style.
The most important thing is to pick a lane and stick to it. If you do your analysis on one timeframe and execute on another, you're bound to get mixed signals. Consistency is key.
This is like asking if a hammer is better than a screwdriver. Neither is "better"—they’re just different tools for different jobs. Continuation patterns, like flags or pennants, signal that the current trend is probably going to keep going. Trading with the trend is often seen as a safer, higher-probability bet.
Reversal patterns, on the other hand, signal that the trend might be about to make a U-turn. Catching one of these can lead to a huge win, but it’s also riskier because you're fighting against the market's current momentum. A smart trader knows how to spot and use both.
Ready to stop guessing and start trading with precision? EzAlgo gives you AI-powered buy and sell signals, real-time momentum alerts, and automatically drawn key levels right on your TradingView chart. It helps take the emotion out of your trading and gives you an edge with tools built for clarity and confidence. Get EzAlgo today and transform your trading approach.


%201.svg)