Placing a trade is easy; knowing when to exit is what separates consistently profitable traders from the rest. The single most critical decision you'll make after entering a position is not where to take profits, but where to cut losses. A well-defined exit plan, or stop loss, is your primary defense against catastrophic account damage. It’s the business plan for your trade, enforcing discipline when emotions like hope and fear try to take over. Without one, you're not trading, you're gambling.
Finding the best stop loss strategy isn't about picking a random percentage or a price that "feels" right. It's about aligning your exit tactic with the market's behavior, your risk tolerance, and the specific asset you're trading. A strategy that works for a low-volatility stock will fail spectacularly in crypto or forex markets. This guide moves beyond generic advice to give you a tactical playbook of proven stop loss methods.
Here, you will learn how to implement several powerful strategies, from simple percentage-based stops to dynamic, volatility-adjusted techniques like the ATR and Chandelier Exit. We'll break down the specific setup for each, its ideal market conditions, and its distinct pros and cons, so you can stop guessing and start protecting your capital with precision.
1. The Percentage-Based Stop Loss: Your Foundation for Discipline
The percentage-based stop loss is arguably the most straightforward and widely used risk management technique, making it an essential tool for traders at all levels. This method involves setting a stop-loss order at a predetermined percentage below your entry price. It’s a simple rule-based system that removes emotion from the exit decision.
The core principle is to decide in advance the maximum percentage of your capital you are willing to risk on a single trade. For instance, a common rule is the "2% rule," where a trader risks no more than 2% of their total account value on any given position. This approach provides a solid foundation for capital preservation.
How It Works: A Practical Example
Imagine you have a $10,000 trading account and decide to risk 2% per trade. Your maximum acceptable loss is $200 ($10,000 x 0.02).
- Scenario: You buy 100 shares of a stock at $50 per share (a $5,000 position).
- Stop-Loss Calculation: You need to set a stop price that limits your loss to $200. To find the price per share, divide the total risk ($200) by the number of shares (100), which equals $2.
- Placement: You would set your stop-loss order at $48 ($50 entry price - $2). If the stock drops to $48, your order triggers automatically, selling your shares and capping your loss near the $200 mark.
Key Advantages and Disadvantages
Pros:
- Simplicity: Easy to calculate and implement, perfect for beginners.
- Discipline: Enforces a strict risk management rule, preventing emotional decisions.
- Consistency: Applies a uniform risk parameter across all trades.
Cons:
- Ignores Volatility: A fixed percentage doesn’t account for a stock's typical price swings. A volatile stock might hit a 5% stop loss during normal daily movement, while a stable stock might never come close.
- Arbitrary Nature: The chosen percentage can feel random and may not align with the asset's specific technical structure, like support or resistance levels.
This method is an excellent starting point and a core component of many successful trading plans. While more advanced traders often combine it with other techniques, its power lies in its simplicity and ability to enforce disciplined risk management, making it one of the best stop loss strategy foundations to build upon.
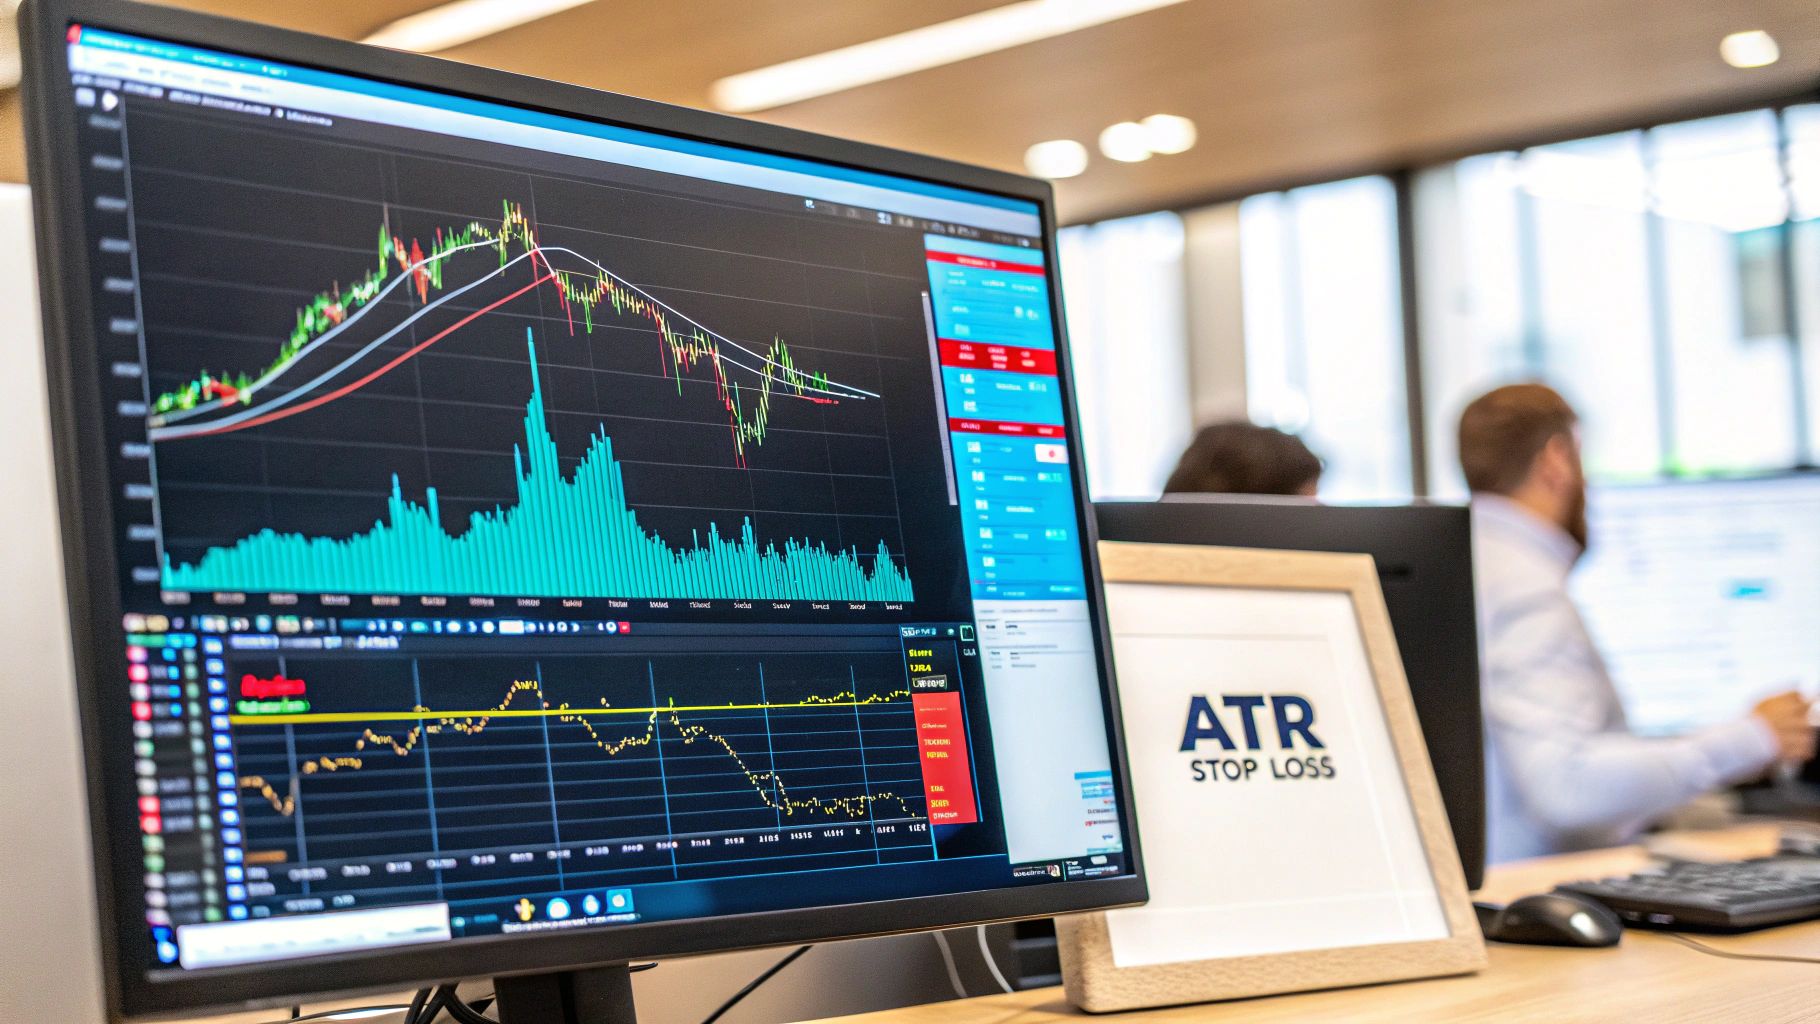
2. The ATR-Based Stop Loss: Adapting to Market Volatility
For traders seeking a more dynamic approach than a fixed percentage, the Average True Range (ATR) based stop loss is a superior method. This technique uses the ATR indicator, a measure of market volatility, to set stop-loss orders that automatically adjust to the asset's recent price behavior. It provides more room for price fluctuations in volatile markets and tightens stops when the market is calm.
This strategy was built upon the work of J. Welles Wilder Jr., the creator of the ATR, and popularized by trading coaches like Van Tharp. The core idea is to place your stop at a multiple of the current ATR value, making it a highly responsive and logical tool for risk management.
How It Works: A Practical Example
Imagine you want to buy a stock that is currently trading at $100. You look at the ATR indicator (typically on a 14-day period) and see its current value is $1.50. You decide to use a common 2x ATR multiplier for your stop loss.
- Scenario: You buy shares of a stock at an entry price of $100.
- Stop-Loss Calculation: You multiply the ATR value by your chosen multiplier: $1.50 (ATR) x 2 = $3.00. This $3.00 represents the "noise" or normal volatility you are willing to accept.
- Placement: You set your stop-loss order at $97 ($100 entry price - $3.00). If the price drops by more than its typical volatility range, your position is closed, protecting you from a significant downturn. This makes it one of the best stop loss strategy options for adapting to real-time conditions.
Key Advantages and Disadvantages
Pros:
- Adapts to Volatility: The stop loss automatically widens or tightens based on current market conditions, preventing premature exits in choppy markets.
- Objective Placement: It removes guesswork by providing a data-driven level for your stop loss based on an asset’s true range.
- Versatility: Works effectively across different markets (stocks, forex, commodities) and timeframes.
Cons:
- Can Be Wide: In extremely volatile markets, the ATR can expand significantly, leading to a wider stop loss and requiring a smaller position size to maintain proper risk.
- Requires an Indicator: Traders must be comfortable using and interpreting the ATR indicator on their charting platform.
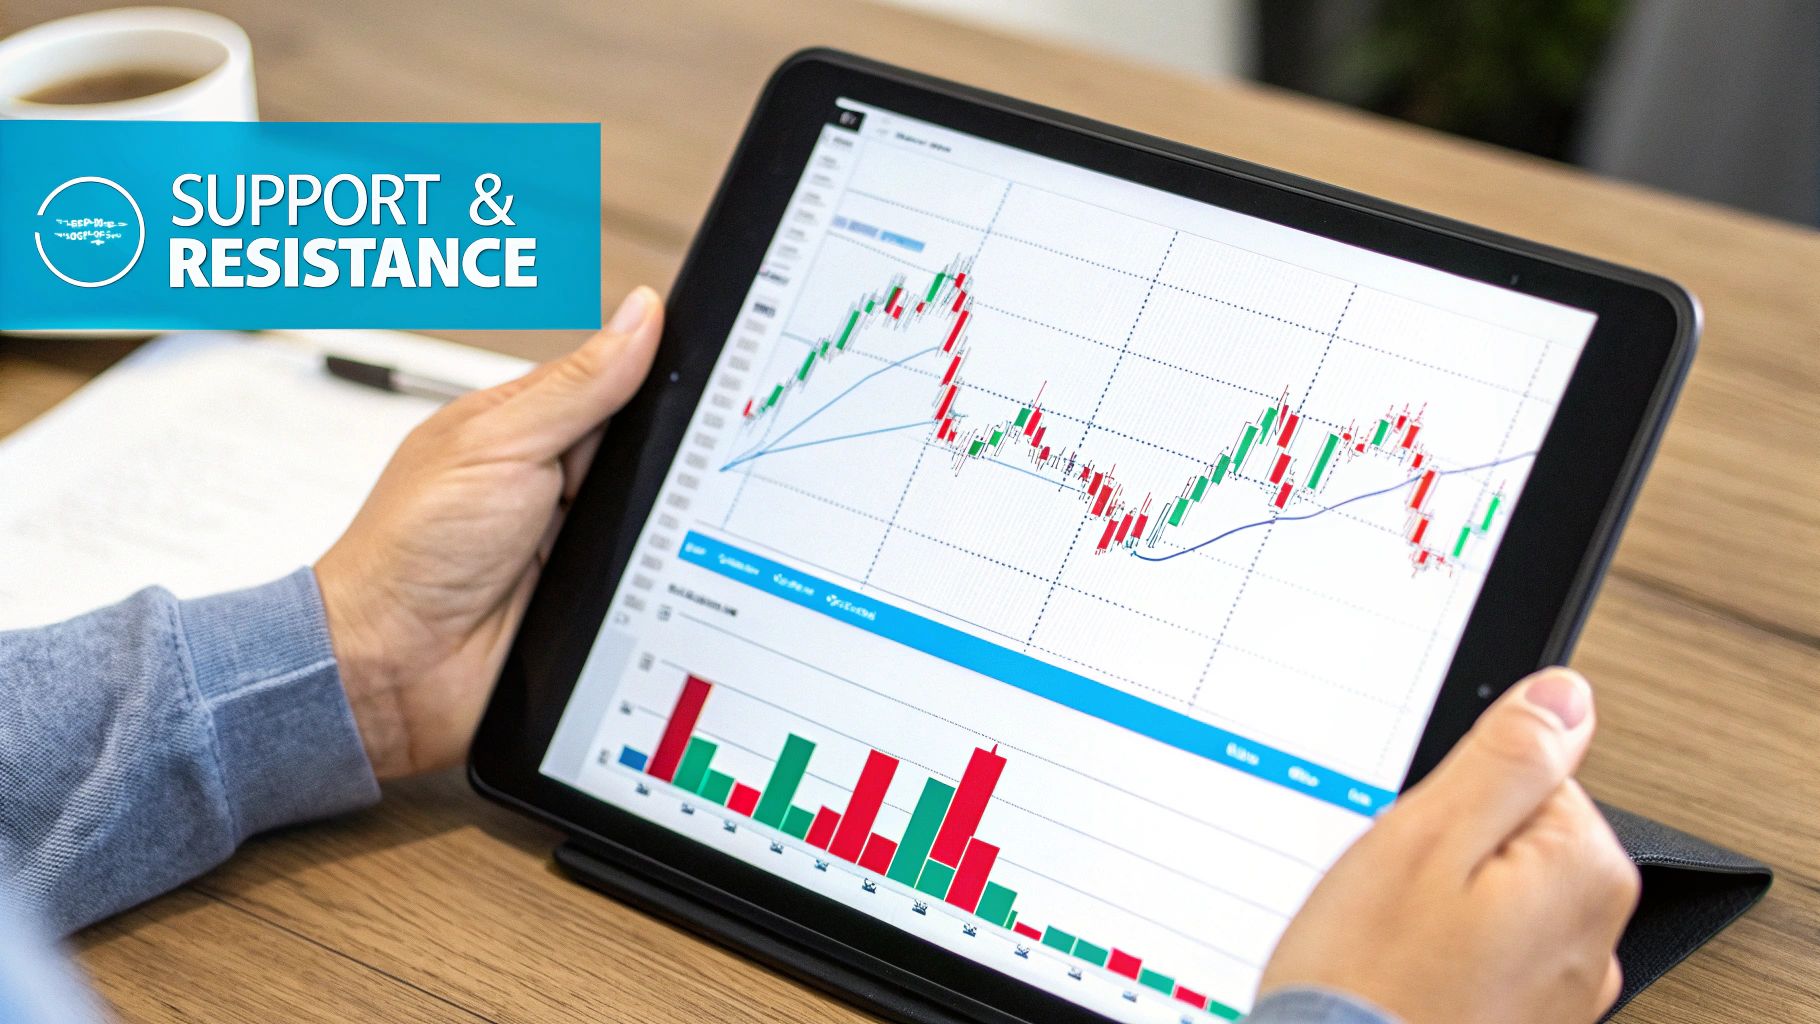
3. The Support and Resistance Stop Loss: Trading with Market Structure
The support and resistance stop loss aligns your risk management with the market's natural structure. Instead of relying on an arbitrary percentage, this technique uses key technical levels where price has historically reversed or stalled. Placing your stop loss based on these proven zones provides a more logical and context-aware exit point.
This method is rooted in the foundational principles of technical analysis, popularized by pioneers like Charles Dow. It assumes that if a significant support level is broken, the underlying bullish thesis is likely invalidated, making it the ideal place to exit a long position. The same logic applies to resistance levels for short positions.
How It Works: A Practical Example
Imagine you identify a strong support level for a stock at $95, formed by a previous swing low and a key moving average. The stock is currently trading at $100.
- Scenario: You decide to go long, buying the stock at $100 because you believe it will bounce off the $95 support area.
- Stop-Loss Placement: You would set your stop-loss order slightly below the support level to avoid getting stopped out by minor fluctuations or "stop hunts." A logical placement would be at $94.50.
- Execution: If the price drops and breaks decisively through the $95 support, your stop at $94.50 will trigger. This signals that the market structure has changed and your original trade idea is no longer valid. For more advanced tools to identify these zones automatically, you can find the best support and resistance indicator on ezalgo.ai.
Key Advantages and Disadvantages
Pros:
- Logical Placement: Stops are based on market behavior, not arbitrary numbers.
- Context-Aware: Adapts to the specific technical landscape of the asset you are trading.
- Clear Invalidation: A break of a key level provides a clear, objective reason to exit the trade.
Cons:
- Subjectivity: Identifying "strong" support and resistance levels can be subjective and requires practice.
- Well-Known Levels: Major support/resistance zones are obvious to all market participants, making them targets for institutional stop hunting.
- Requires Technical Skill: Less suitable for absolute beginners who are not yet comfortable with chart analysis.
This method is a cornerstone of professional trading and a crucial step up from basic percentage stops. It forces you to analyze the chart and make decisions based on evidence, making it one of the best stop loss strategy options for those looking to trade in sync with market dynamics.
4. The Trailing Stop Loss: Protecting Profits as You Win
The trailing stop loss is a dynamic and powerful risk management tool designed not just to limit losses, but to lock in profits as a trade moves in your favor. Unlike a static stop loss that remains fixed, a trailing stop automatically adjusts upward with a rising price, allowing you to let your winners run while protecting your accumulated gains.
This method is a core component of many trend-following systems, popularized by traders like William O'Neil. It offers a systematic way to stay in a winning trade without manually moving your stop, effectively balancing the goals of profit maximization and risk mitigation. It’s an essential technique for any trader looking to capture the majority of a trend.

How It Works: A Practical Example
A trailing stop is set at a specific percentage or dollar amount below the current market price. As the price increases, the stop level rises with it, maintaining the same trailing distance. However, if the price falls, the stop level remains in place, creating a floor to protect your profits.
- Scenario: You buy a growth stock at $100 per share and set a 15% trailing stop.
- Initial Stop Placement: Your initial stop-loss is set at $85 ($100 - 15%).
- Price Moves Up: The stock rises to $120. Your trailing stop automatically moves up to $102 ($120 - 15% of $120). You have now locked in a guaranteed profit of $2 per share.
- Price Pulls Back: The stock then drops. Your stop remains at $102. If the price hits this level, your position is sold automatically, securing your profit and preventing further loss.
Key Advantages and Disadvantages
Pros:
- Profit Protection: Its primary benefit is locking in gains as a trade becomes profitable.
- Emotion-Free Exits: Automates the exit process, preventing the emotional mistake of selling too early or holding on too long.
- Maximizes Trends: Allows you to ride a strong trend for as long as possible without getting shaken out by minor corrections.
Cons:
- Whipsaw Risk: In choppy, non-trending markets, normal price fluctuations can trigger the stop prematurely, causing you to exit a potentially good trade.
- Trail Distance Dilemma: Setting the trail distance too tight can lead to premature exits, while setting it too wide can give back too much profit before triggering.
The trailing stop is a cornerstone of the best stop loss strategy for trend followers. It provides a disciplined, automated approach to let profits run, turning good trades into great ones by systematically capturing the bulk of a market move.
5. The Volatility-Based Stop Loss: Adapting to Market Rhythm
Moving beyond fixed percentages, the volatility-based stop loss is a dynamic approach that tailors your risk to an asset's unique price behavior. This sophisticated method sets your stop-loss order based on the typical price fluctuations of the security, often measured by indicators like the Average True Range (ATR) or Bollinger Bands. It’s a smarter way to avoid getting stopped out by normal market "noise."
The core principle is that volatile assets need wider stops, while stable assets require tighter ones. A fixed 5% stop might be too tight for a volatile cryptocurrency but too loose for a low-beta utility stock. A volatility-based stop loss strategy automatically adjusts for these differences, giving your trade the appropriate room to breathe.
How It Works: A Practical Example
Imagine you want to trade a stock, but you want to place a stop that respects its recent volatility. You decide to use the Average True Range (ATR), a common volatility indicator.
- Scenario: You buy a stock at $100. You check its 14-day ATR, which is currently $2.50. This means the stock has, on average, moved $2.50 per day over the last 14 days.
- Stop-Loss Calculation: A common practice is to set the stop at a multiple of the ATR, such as 2x ATR. In this case, your risk distance would be 2 * $2.50 = $5.00.
- Placement: You would set your stop-loss order at $95 ($100 entry price - $5.00). This placement ensures your stop is outside the asset's typical daily price movement, reducing the chance of a premature exit.
Key Advantages and Disadvantages
Pros:
- Market-Adaptive: The stop adjusts to the asset's current volatility, making it highly relevant.
- Reduces "Noise" Exits: Helps prevent being stopped out by normal price swings that are not part of a true trend reversal.
- Objective: Based on quantifiable data (like ATR or standard deviation), removing guesswork.
Cons:
- More Complex: Requires an understanding of volatility indicators and can be more difficult for beginners to calculate.
- Can Widen During High Volatility: In a market panic, the ATR can expand rapidly, leading to a much wider (and riskier) stop loss if not managed carefully.
This is considered one of the best stop loss strategy options for traders who want to align their risk management with the actual behavior of the market. It provides a data-driven framework that respects an asset's character. For those looking to dive deeper, you can explore volatility trading strategies and see how they can be integrated into a complete trading plan.
6. The Time-Based Stop Loss: Freeing Up Your Capital
Unlike price-based exits, the time-based stop loss strategy focuses on a different, equally valuable resource: time. This method involves exiting a trade after a predetermined period has passed, regardless of whether the position is profitable or at a loss. Its core principle is that a good trade should work out within a specific timeframe; if it doesn't, the capital is better deployed elsewhere.
This approach is crucial for active traders who need to maintain trading velocity and avoid having their funds locked in stagnant positions. By setting a time limit, you force a decision and ensure your portfolio remains dynamic. It acts as a filter, clearing out trades that are not performing as expected and keeping your focus on high-potential opportunities.
How It Works: A Practical Example
Imagine you are a swing trader who expects a catalyst, like an earnings report, to move a stock within five trading days. Your strategy dictates that if the anticipated move doesn't happen in that window, the trade idea is likely invalid.
- Scenario: You buy shares of a company on Monday, anticipating a breakout by Friday.
- Stop-Loss Condition: You set a time-based rule: "If this position has not hit its profit target by the market close on Friday, exit the trade."
- Placement: On Friday afternoon, you review the position. If it hasn't moved significantly or reached your goal, you manually close the trade. This frees up your capital for a new opportunity the following week, preventing it from sitting idle in a sideways-moving stock.
Key Advantages and Disadvantages
Pros:
- Capital Efficiency: Prevents money from being tied up in underperforming, "dead-money" trades.
- Reduces Opportunity Cost: Frees you to pursue more promising setups instead of waiting indefinitely on a stagnant one.
- Discipline: Excellent for strategies that rely on momentum or specific event timelines, like day trading or options selling.
Cons:
- Ignores Price Action: You might exit a trade just before it makes its intended move, purely because its time was up.
- Can Be Premature: A position may need more time to develop than initially planned, and a rigid time stop can cut a winning trade short.
The time-based stop is a powerful, often overlooked, technique. While it shouldn't always replace a price-based stop, using it as a secondary exit condition is a sophisticated way to optimize performance. For this reason, it is an essential component of any discussion on the best stop loss strategy.
7. The Chandelier Exit: Hanging Your Stop from the Highs
Developed by renowned technical analyst Chuck LeBeau, the Chandelier Exit is a sophisticated trailing stop loss strategy that dynamically adjusts to market volatility. Its name comes from the concept of a chandelier hanging down from the ceiling; similarly, this stop loss "hangs" from the highest peak the price has reached since you entered a long trade.
This technique uses the Average True Range (ATR), a key measure of volatility, to determine the optimal distance for your stop. By doing so, it gives the trade enough room to breathe during normal price fluctuations while still protecting profits as the trend progresses. It is an excellent tool for trend followers who want to ride a winning trade as long as possible.
How It Works: A Practical Example
The Chandelier Exit is calculated by taking the highest high over a specific period (e.g., 22 days) and subtracting a multiple of the ATR (e.g., 3 times the ATR).
- Scenario: You go long on a stock at $100. Over the next month, the stock trends up, reaching a 22-day high of $120. The current 14-day ATR is $2.
- Stop-Loss Calculation: You decide to use a standard 3x ATR multiplier. The stop distance is $6 (3 x $2 ATR).
- Placement: Your trailing stop loss would be placed at $114 ($120 highest high - $6). If the stock continues to make new highs, the stop will move up with it, always maintaining that calculated distance from the peak. If the price falls and hits $114, your position is closed, locking in the profit.
Key Advantages and Disadvantages
Pros:
- Volatility-Aware: It automatically adjusts to changing market conditions, widening during high volatility and tightening during low volatility.
- Maximizes Trend Riding: Designed to keep you in a strong trend for longer, preventing premature exits on minor pullbacks.
- Clear and Objective: The calculation is rule-based, removing guesswork and emotional decision-making from your exit strategy.
Cons:
- Lagging Nature: Because it relies on past data (highest highs and ATR), it can be slow to react to sudden, sharp market reversals.
- Whipsaws in Ranging Markets: It performs poorly in sideways or choppy markets, where it can be triggered frequently, leading to small losses.
The Chandelier Exit is considered one of the best stop loss strategy options for traders focused on capturing the majority of a sustained move. Its dynamic, volatility-based approach offers a significant upgrade over simple percentage or fixed-dollar stops, especially in trending markets.
8. The Parabolic SAR Stop Loss: Riding the Trend’s Momentum
The Parabolic SAR (Stop and Reverse) is a dynamic, indicator-based stop loss designed by the legendary technical analyst J. Welles Wilder Jr. It places a stop loss that moves, or “parabolas,” with the price, offering a built-in trailing stop mechanism that accelerates as a trend strengthens. This makes it an outstanding tool for momentum and trend-following traders.
The indicator appears on a chart as a series of dots either above or below the price candles. When the dots are below the price, it signals an uptrend, and the dots themselves represent the suggested stop-loss level. When the dots flip to be above the price, it signals a potential trend reversal and a new downtrend, providing an exit signal for long positions and an entry signal for short ones.
How It Works: A Practical Example
Imagine you are a forex trader following a strong uptrend in the EUR/USD pair.
- Scenario: You enter a long position as the Parabolic SAR dots flip below the price, confirming an uptrend.
- Initial Placement: You place your initial stop loss exactly where the first SAR dot appears below your entry candle.
- Dynamic Adjustment: With each new candle, the SAR dot moves higher, moving closer to the price. You would manually or automatically trail your stop loss to the level of the new SAR dot. If the trend accelerates, the gap between the dots widens, reflecting the increased momentum.
- Exit Signal: The trend eventually loses steam, and the price falls to touch the SAR dot. This automatically triggers your stop loss, locking in profits. The dot then flips above the price, signaling the trend has reversed.
Key Advantages and Disadvantages
Pros:
- Trend Following: Excellent for capturing the majority of a sustained move in a trending market.
- Dynamic and Adaptive: Automatically adjusts to the speed of the trend, tightening during strong moves.
- Removes Emotion: Provides clear, unemotional exit signals based on indicator logic, making it a reliable part of any best stop loss strategy for trend followers.
Cons:
- Poor in Choppy Markets: Generates frequent false signals and whipsaws in sideways or ranging markets, leading to small, repeated losses.
- Lagging Nature: As a trend-following indicator, it will always exit after a trend has already started to reverse, meaning you never exit at the absolute top.
The Parabolic SAR is a powerful tool when used in the right context, primarily in markets with clear, sustained direction. It’s best combined with other trend-confirming indicators to filter out noise from choppy conditions.
Stop Loss Strategies Comparison Matrix
| Stop Loss Type | Implementation Complexity 🔄 | Resource Requirements ⚡ | Expected Outcomes 📊 | Ideal Use Cases 💡 | Key Advantages ⭐ |
|---|
| Percentage-Based Stop Loss | Low - Simple fixed percentage calculation | Low - Minimal tools needed | Consistent risk limits; may cause premature exits | Beginners, all asset classes | Easy to use; removes emotions; consistent risk |
| ATR-Based Stop Loss | Medium - Requires ATR calculation | Medium - Needs price data and ATR indicator | Adaptive stops matching volatility; fewer false exits | Trending markets, forex, stocks, commodities | Volatility-adjusted; logical stops; reduces noise |
| Support and Resistance Stop Loss | Medium-High - Needs technical analysis skill | Medium - Charting tools, multiple timeframes | Logical stops at key levels; better risk/reward ratio | Technical traders using market structure | Aligns to market behavior; reduces false breakouts |
| Trailing Stop Loss | Medium - Dynamic calculation and adjustment | Medium - Compatible with most platforms | Locks profits; captures trends; may exit on pullbacks | Trend followers wanting to maximize gains | Automatically protects profits; captures trends |
| Volatility-Based Stop Loss | High - Statistical and indicator-based setup | High - Requires volatility measures | Stops adapt to asset's normal fluctuations | Quant, advanced traders focusing on volatility | Customized to asset; reduces noise-triggered stops |
| Time-Based Stop Loss | Low - Simple fixed time exit | Low - Just timing discipline | Ensures exit within fixed time; may cut winners early | Day traders, options traders, algorithmic systems | Enforces discipline; prevents stagnation |
| Chandelier Exit | High - Uses highest highs/lows plus ATR | Medium-High - Needs ATR and price history | Effective trend capturing; can be wide in ranges | Trend followers, stock and commodity traders | Clear exit rules; volatility adjusted; captures trends |
| Parabolic SAR Stop Loss | Medium - Indicator-based, acceleration factor | Medium - Requires SAR indicator | Dynamic stops that follow trends; reversals signaled | Trending markets, momentum traders | Clear visual signals; auto adjusts trend strength |
Choosing Your Strategy: From Theory to a Personalized Action Plan
Navigating the world of trading without a robust exit plan is like sailing in a storm without a rudder. Throughout this guide, we've dissected a powerful arsenal of stop-loss techniques, from the simple logic of the Percentage-Based Stop to the dynamic, market-responsive nature of the ATR-Based Stop and the Chandelier Exit. We have explored how to anchor your decisions to tangible market structures with Support and Resistance Stops and how to let your profits run while protecting gains using Trailing Stops.
The core lesson is clear: there is no single "best stop loss strategy" that universally outperforms all others in every market, for every asset, or for every trader. The true "best" strategy is the one that is meticulously calibrated to your specific trading system, risk tolerance, and the unique personality of the asset you are trading. What works for a low-volatility blue-chip stock will likely be disastrous for a volatile cryptocurrency pair.
Key Takeaways and Your Path Forward
Your journey to mastering risk management doesn't end here; it begins with deliberate practice and personalization. The goal is to move from theoretical knowledge to a concrete, actionable plan that you can execute with confidence, even when market pressure is high.
Here’s how to translate what you’ve learned into a personalized action plan:
- Audit Your Trading Style: Are you a short-term scalper, a swing trader, or a long-term position holder? A scalper might favor a tight, fixed-point stop, while a position trader would benefit more from a wider, volatility-based stop like the ATR or a major support level.
- Analyze the Asset's Behavior: Before placing a trade, study the asset's typical volatility. Use the Average True Range (ATR) indicator to quantify its daily or hourly price movement. This data is invaluable for setting realistic stops that avoid premature exits on normal market noise.
- Backtest, Backtest, Backtest: Don't risk real capital on an unproven strategy. Use a trading simulator or your platform's backtesting features to apply different stop-loss methods to historical data for your chosen assets. See how a 2% stop compares to a 2x ATR stop over hundreds of past trades. The results will often surprise you and provide objective data to guide your choice.
- Create a Rules-Based Checklist: Your stop-loss placement should be a non-negotiable part of your trading plan. Write it down. For example: "For any S&P 500 swing trade, my initial stop will be placed 1.5x the daily ATR below my entry price or 10 points below the most recent major swing low, whichever is wider." This removes emotion and hesitation from the decision-making process.
Mastering your stop-loss strategy is the ultimate act of taking control of your trading destiny. It transforms you from a passive market participant hoping for the best into a disciplined risk manager prepared for the worst. It’s the foundational skill that preserves your capital, allowing you to stay in the game long enough to seize the opportunities that will inevitably come your way.
Ready to automate your technical analysis and get a powerful edge? EzAlgo provides advanced, AI-driven indicators that can help identify optimal entry points and dynamically track support and resistance levels, making it easier to implement a more intelligent and effective stop loss strategy. Visit EzAlgo to see how our tools can integrate directly into your TradingView chart and elevate your risk management game.


%201.svg)