


In the fast-paced world of trading, success often hinges on one critical factor: timing. Knowing precisely when to enter a position and, just as importantly, when to exit, separates profitable traders from the rest. While gut instinct has its place, consistent results are built on data-driven decisions. This is where technical indicators come in, acting as your analytical co-pilot to navigate market volatility.
However, with hundreds of options available, identifying the truly effective tools can be overwhelming. This guide cuts through the noise. We will present a definitive list of the best entry and exit indicators that have stood the test of time, helping retail traders, technical analysts, and crypto enthusiasts alike.
You will learn exactly how each tool functions, its specific strengths, and its potential weaknesses. We will move beyond theory and provide actionable steps for applying them to your charts. More importantly, we'll explore how these classic indicators can be supercharged when integrated with advanced platforms like EzAlgo. Our goal is to give you a clear, practical framework to enhance your trading strategy, save time, and confidently identify high-probability setups in any market. Let's dive in.
The Relative Strength Index (RSI) is a staple for traders seeking the best entry and exit indicators due to its straightforward approach to measuring market momentum. Developed by J. Welles Wilder Jr. in 1978, this momentum oscillator measures the speed and change of price movements on a scale of 0 to 100. It helps identify overbought (typically above 70) and oversold (typically below 30) conditions, providing clear signals for potential market reversals.
At its core, the RSI compares the average size of recent gains to recent losses over a specific time period, most commonly 14 periods. This calculation helps you gauge whether an asset's price action is becoming exhausted, signaling a prime moment to either enter or exit a position. For example, Bitcoin's RSI has historically dipped below 30 during major market crashes, often preceding significant price recoveries.
The most common strategy involves selling when the RSI moves above 70 and buying when it drops below 30. However, a more reliable approach is to wait for confirmation. Instead of buying the moment RSI hits 29, wait for it to cross back above 30. This simple confirmation filter can help you avoid catching a falling knife.
The following infographic summarizes the standard RSI levels for quick reference.
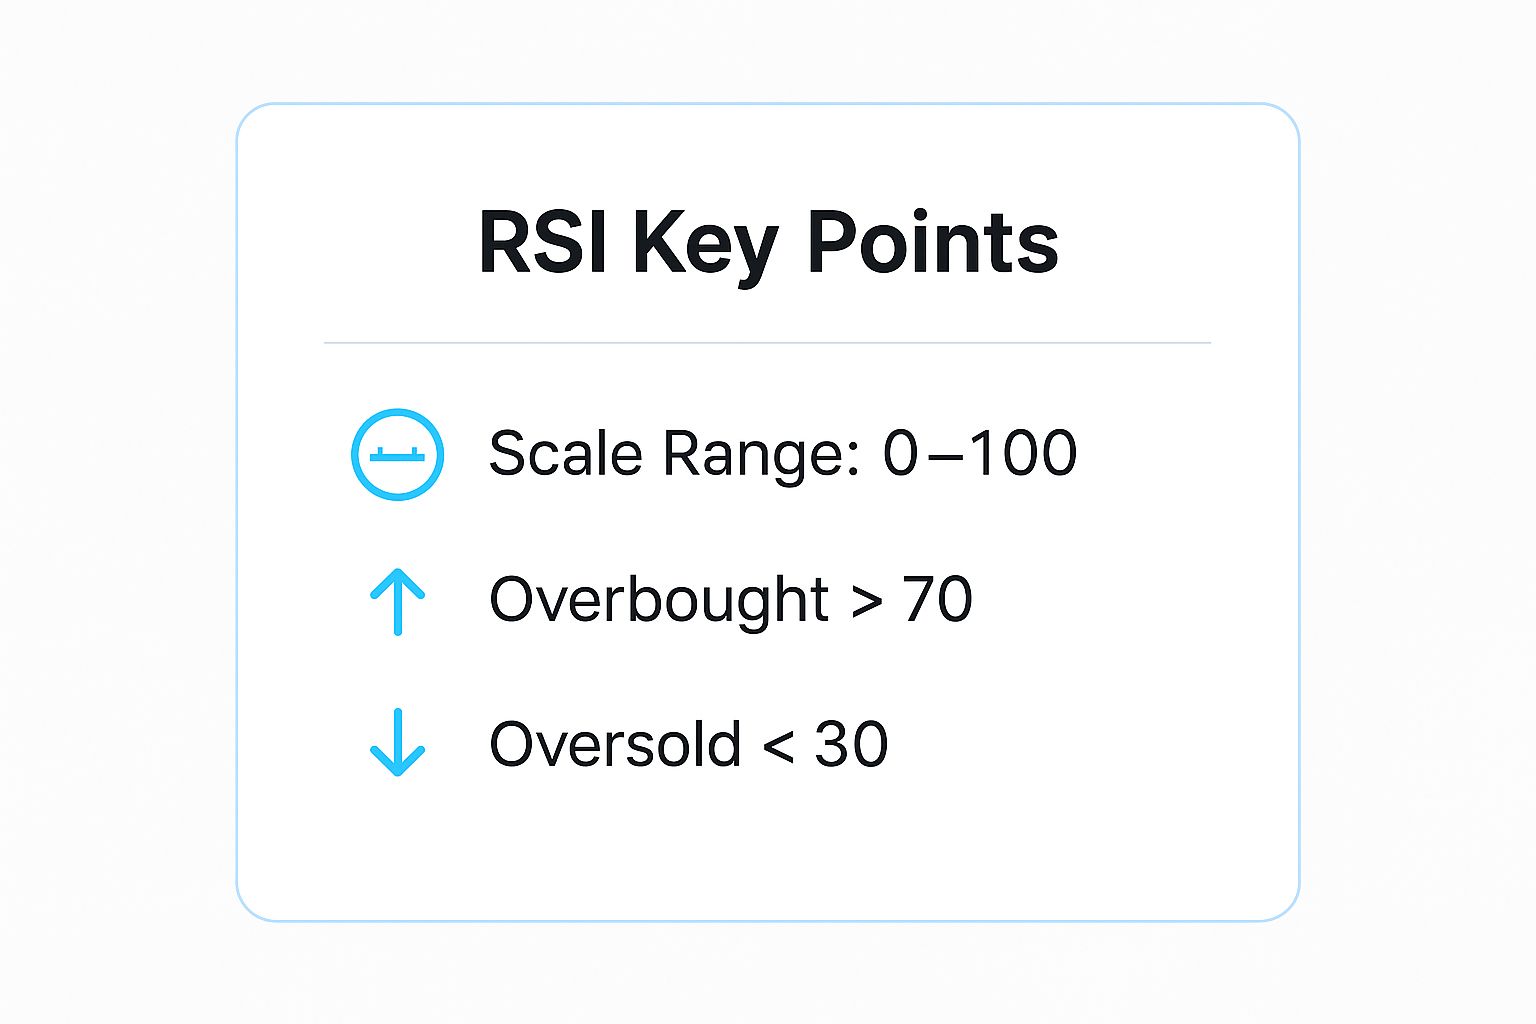
These key levels provide a fundamental framework for identifying potentially overextended price action.
To elevate your RSI strategy, consider these advanced techniques:
The Moving Average Convergence Divergence (MACD) is a cornerstone for traders looking for the best entry and exit indicators, excelling at highlighting trend direction and momentum. Developed by Gerald Appel in the late 1970s, this versatile tool shows the relationship between two exponential moving averages (EMAs) of an asset's price. It helps traders spot potential trend reversals, momentum shifts, and prime entry or exit points long before they become obvious on the price chart.
At its heart, the MACD consists of three components: the MACD line (the 12-period EMA minus the 26-period EMA), the signal line (a 9-period EMA of the MACD line), and the histogram (the difference between the MACD line and the signal line). This combination provides a visual representation of momentum. For instance, when Apple’s MACD line crossed bullishly above its signal line in March 2020, it signaled the beginning of a powerful, long-term uptrend.
These core components work together to paint a clear picture of market momentum and potential shifts.
The most fundamental signals are crossovers. A bullish entry signal occurs when the MACD line crosses above the signal line, suggesting upside momentum is building. Conversely, a bearish exit signal is generated when the MACD line crosses below the signal line, indicating that downside momentum is taking over. For a deeper understanding of exit strategies, you can explore our guide on when to exit a trade.
A zero-line crossover offers another layer of confirmation. When the MACD line crosses above the zero line, it signals a potential shift to an overall uptrend. When it crosses below zero, it can indicate the start of a downtrend.
To refine your MACD analysis, integrate these practical techniques:
Bollinger Bands are a versatile tool and one of the best entry and exit indicators for assessing market volatility and identifying relative price extremes. Developed by John Bollinger in the 1980s, this indicator consists of a middle band, which is a 20-period simple moving average (SMA), and two outer bands set two standard deviations away from it. These bands expand during high volatility and contract during low volatility, creating a dynamic channel around the price.
This unique structure helps traders visually identify overbought and oversold conditions relative to recent price action. When the price touches the upper band, it may be overextended and due for a reversal, while a touch of the lower band can signal an oversold state. For example, Netflix (NFLX) stock has often been observed bouncing between its Bollinger Bands during consolidation phases, providing clear range-trading opportunities.

In ranging markets, a common strategy is to sell when the price hits the upper band and buy when it touches the lower band. For trending markets, traders often use the middle band (20 SMA) as a dynamic support or resistance level. A price pullback to the middle band in a strong uptrend can present a solid buying opportunity.
However, a touch of an outer band is not a signal in itself; it simply indicates that the price is at a relative extreme. Confirmation from price action or another indicator is crucial. For instance, instead of immediately selling when the price of a stock like Microsoft (MSFT) touches the upper band, wait for a bearish candlestick pattern to form before entering a short position.
To get the most out of Bollinger Bands, integrate these advanced tactics into your analysis:
The Stochastic Oscillator is a popular choice for traders searching for the best entry and exit indicators, especially for its ability to pinpoint potential reversals by measuring price momentum. Developed by George Lane in the 1950s, this indicator compares a particular closing price of a security to a range of its prices over a certain period of time. It operates on the principle that momentum often changes direction before price, making it a valuable leading indicator.
Comprised of two lines, %K (the main line) and %D (a moving average of %K), the oscillator moves between 0 and 100. It excels at identifying overbought (typically above 80) and oversold (typically below 20) conditions. For instance, the GBP/JPY currency pair frequently enters range-bound periods where stochastic signals near the 20 and 80 levels have historically provided highly effective entry and exit points.
The classic strategy is to buy when the oscillator falls below 20 and then crosses back above it, and to sell when it rises above 80 and then crosses back below. The crossover of the %K line above the %D line when in oversold territory is a common buy signal, while a crossover below the %D line in overbought territory is a sell signal.
Waiting for the lines to exit the overbought or oversold zones before acting provides confirmation. This helps filter out premature signals in strongly trending markets where the oscillator can remain in extreme territory for extended periods.
To refine your use of the Stochastic Oscillator, apply these practical techniques:
While many indicators provide direct buy or sell signals, the Average True Range (ATR) carves out its place among the best entry and exit indicators by mastering a different, yet crucial, element: volatility. Developed by J. Welles Wilder Jr., the same mind behind the RSI, ATR measures the average range of price movement over a specified period. It does not indicate price direction, but rather how much an asset’s price is moving on average.
ATR gives you a clear, quantitative measure of market volatility. A rising ATR signifies increasing volatility, while a falling ATR suggests the market is calming down. This insight is essential for risk management, allowing you to set intelligent stop-losses and profit targets that are adapted to the current market environment. For instance, a volatile cryptocurrency might have a high ATR, justifying a wider stop-loss to avoid being prematurely stopped out by normal price fluctuations.
ATR is rarely used for generating entry signals on its own. Instead, its power lies in refining the exits and managing the risk of trades initiated by other indicators. A common strategy is to place a stop-loss at a multiple of the ATR value away from your entry price. For example, in a long position, you might set a stop-loss at 2x ATR below your entry price.
This method ensures your risk parameters are dynamic. In a quiet market (low ATR), your stop will be tighter, while in a volatile market (high ATR), it will be wider, giving the trade more room to breathe and adapt to the increased price swings.
To effectively integrate ATR into your trading system, focus on these practical techniques:
Fibonacci Retracement is revered by traders as one of the best entry and exit indicators for its ability to forecast potential support and resistance levels. Derived from the famous number sequence discovered by Leonardo Fibonacci, this tool uses horizontal lines drawn on a chart to highlight areas where a price pullback might end and the primary trend could resume. It is especially effective in trending markets for pinpointing high-probability reversal zones.
The core concept is that after a significant price move (a swing high to a swing low, or vice versa), the price will often retrace or pull back a predictable portion of that move before continuing in the original direction. These retracement levels, based on key Fibonacci ratios like 38.2%, 50%, and 61.8%, act as hidden levels of support or resistance. For instance, it's common to see a stock like Tesla retrace to the 61.8% level during a pullback before launching into its next upward leg.
To use this tool, a trader identifies a recent significant price move, known as a swing high and swing low. By drawing the Fibonacci Retracement tool from the start to the end of this swing, key levels are automatically plotted. Traders then watch for the price to pull back to one of these levels, particularly the 38.2% or 61.8% zones, and show signs of reversal.
An entry is typically planned when the price touches a Fibonacci level and forms a confirmation signal, such as a bullish candlestick pattern. An exit could be placed at a higher Fibonacci extension level or when the price breaks decisively below a key retracement level that was supposed to act as support. For a more detailed guide, you can learn more about developing a Fibonacci trading strategy on ezalgo.ai.
To refine your Fibonacci trading and increase its reliability, apply these advanced techniques:
The Volume Weighted Average Price (VWAP) is a benchmark highly regarded by institutional traders and day traders alike, making it one of the best entry and exit indicators for intraday analysis. Unlike a simple moving average, VWAP incorporates transaction volume into its calculation, offering a true average price an asset has traded at for the day. This provides a crucial reference point for fair value, helping traders determine if they are getting a good price relative to the day's trading activity.
At its core, VWAP is calculated by totaling the dollars traded for every transaction (price multiplied by volume) and then dividing by the total shares traded for the day. This continuous calculation plots a single line on the chart, which acts as a dynamic level. For instance, day traders often watch for a pullback to the VWAP in a trending stock like Apple (AAPL) as a potential entry point, assuming the primary trend will resume.
The primary strategy involves using VWAP as a dynamic area of support or resistance. In an uptrend, traders look to buy as the price dips back to the VWAP line. In a downtrend, they look to sell or short as the price rallies up to touch the VWAP. This approach is based on the principle of mean reversion, where price tends to return to its average.
A confirmation signal is crucial. Instead of buying the moment price touches the VWAP, waiting for a bullish candlestick pattern to form on or near the VWAP line provides a much stronger entry signal. Similarly, a bearish candle forming at VWAP in a downtrend confirms potential resistance.
To effectively integrate VWAP into your trading, consider these advanced techniques:
The Ichimoku Cloud, or Ichimoku Kinko Hyo, is a comprehensive, all-in-one system that stands out as one of the best entry and exit indicators for its ability to define market trend, momentum, and support/resistance levels in a single view. Developed by Goichi Hosoda in the late 1960s, this indicator provides a complete picture of price action, helping traders make more informed decisions.
The system is composed of five lines: the Tenkan-sen (Conversion Line), Kijun-sen (Base Line), Senkou Span A, Senkou Span B, and the Chikou Span (Lagging Span). The area between Senkou Span A and B forms the "Kumo" or cloud, which is the cornerstone of the indicator. When price is above the cloud, the trend is considered bullish; when below, it's bearish. For example, Amazon stock breaking decisively above a thick Ichimoku cloud has often preceded a major, sustained uptrend.
The most fundamental entry signal is a price breakout above the cloud, while an exit or short-entry signal is a breakout below it. A bullish entry is confirmed when the Tenkan-sen crosses above the Kijun-sen, the price is above the cloud, and the Chikou Span is above the price action from 26 periods ago.
The cloud itself acts as dynamic support and resistance. In a strong uptrend, you can use the top of the cloud (Senkou Span A) as an area to add to your position or place a trailing stop. For instance, currency pairs like EUR/JPY often find reliable support at the cloud during strong trending moves.
To get the most out of the Ichimoku Cloud, apply these advanced techniques:
We've journeyed through a powerful lineup of the best entry and exit indicators, each offering a distinct advantage for your trading toolkit. From tracking momentum with the RSI and MACD to gauging market volatility with Bollinger Bands and the Average True Range (ATR), you now have the foundational knowledge to interpret market dynamics with greater precision. We also explored how tools like Fibonacci Retracement, VWAP, and the Ichimoku Cloud provide crucial context on support, resistance, and overall trend health.
However, the most profound takeaway is that no single indicator is a magic bullet. Relying on one tool, like using only the RSI's overbought signal to short a strong uptrend, is a recipe for frustration. The true power emerges from confluence, the art and science of combining these indicators to create a robust, multi-faceted trading system. When the MACD shows a bullish crossover at the same time the price bounces off a key Fibonacci level and the Stochastic Oscillator moves out of oversold territory, your trade signal becomes significantly more reliable.
Building this system is the bridge between theoretical knowledge and consistent profitability. The goal is to move beyond simply knowing what an indicator does and start applying it systematically. This process involves:
Key Insight: A winning strategy isn't about finding the one perfect indicator; it's about making several good indicators work together. This confluence of signals filters out market noise and provides high-probability setups.
This manual process of finding confluence is invaluable, but it's also time-consuming and requires immense discipline. This is precisely where modern trading tools can provide a decisive edge. Instead of manually scanning for these aligned signals across multiple charts, an integrated system can do the heavy lifting for you. This is the core philosophy behind EzAlgo, which synthesizes these classic indicator principles into a single, AI-driven algorithm. It automatically detects momentum shifts, key support and resistance levels, and provides clear, non-repaint buy and sell signals directly on your chart.
By leveraging such a tool, you essentially automate the process of finding confluence, allowing you to focus your mental energy on trade execution, position sizing, and overall strategy management. This transforms your approach from reactive analysis to proactive, disciplined trading.
Ready to stop juggling indicators and start trading with an all-in-one, AI-powered system? EzAlgo integrates the principles of these top indicators into a clear, actionable signal suite on TradingView, doing the complex analysis for you. Discover the power of automated confluence and elevate your trading strategy by visiting EzAlgo today.


%201.svg)