


You've probably heard of the bullish head and shoulders pattern, but many traders know it by its more common name: the inverse head and shoulders. It's a classic chart formation that can signal a major shift in market momentum. Essentially, it tells you that a long-running downtrend might be running out of steam, and buyers are getting ready to take the reins.
Spotting this pattern early can give you a serious edge, helping you get into a new uptrend before the rest of the market catches on.
Imagine a market that's been stuck in a downtrend for a while. Sellers have been in full control, driving prices down. The inverse head and shoulders pattern starts to take shape right when that downward pressure begins to fade. It’s like a story told in three parts, showing the final exhaustion of sellers and the first real push from buyers.
Think of it as the market hitting rock bottom, trying to recover, getting knocked down one last time, and then finally finding the strength for a real, sustained rally.

This pattern isn't just a random squiggle on a chart; it’s a powerful visual of market psychology in action, showing the mood shifting from widespread fear back toward optimism. Whether you trade stocks, forex, or crypto, learning to recognize it can help you get ahead of major trend changes.
To really get a handle on this pattern, you need to understand its structure. It’s made up of three distinct troughs (lows) and a critical resistance line called the "neckline" that connects the peaks between them.
Let's break down each part of the formation so you know exactly what to look for.
Understanding these components is the first step to confidently identifying this powerful reversal signal on your own charts.
The formation is complete once the price forms the right shoulder and then breaks decisively above the neckline. This breakout is your confirmation—it tells you the downtrend is likely finished and a new uptrend is beginning.
It’s considered one of the more dependable reversal indicators out there. In fact, historical analysis suggests the inverse head and shoulders has an accuracy rate of around 75% in predicting when a downtrend is over.
Mastering this pattern gives you a clear signal to act on. It's a cornerstone of technical analysis and just one of several formations every trader should have in their toolkit. You can learn about more in our complete guide to bullish reversal patterns.
Chart patterns aren't just squiggles on a screen; they're a visual story of the tug-of-war between buyers and sellers. The bullish head and shoulders pattern, often called the inverse head and shoulders, tells a classic comeback story: a downtrend runs out of gas, and a powerful new uptrend is born. Learning to read this narrative helps you see market psychology in real-time.
This pattern shows up after sellers have been in charge for a while. The mood is bearish, and prices have been steadily dropping. But just when things look their worst, a critical power shift is quietly getting underway.

The story starts with the left shoulder. After a long slide, buyers finally draw a line in the sand. They see a bargain at these lower prices and start buying, which sparks a small rally.
But the bears aren't ready to give up just yet. Sellers see this bounce as just another chance to short at a better price, and they quickly wrestle back control, shoving the price down to a new low. This first push by the bulls fizzles out, but it’s important—it plants the first seed of doubt that the downtrend might be losing steam.
Next comes the head. This is the point of maximum fear. Sellers go for the knockout punch, driving the price to the absolute lowest point in the pattern. If you didn't know what to look for, you'd think the crash was just getting started.
But looks can be deceiving. This final plunge is often an act of desperation; the sellers are using up the last of their firepower. You might even notice that the volume on this drop is lower than on previous ones, which is a huge clue that the selling pressure is starting to dry up.
The head of the pattern is the climax of selling. It’s that moment when the bears throw everything they have at the market, only to find there’s no one left to follow them down to those new lows.
This exhaustion is the turning point. As selling pressure disappears at the bottom, a new, more confident wave of buyers starts to step in.
The final chapter begins with the right shoulder. After the bounce from the head's low, the remaining sellers try to regain control one last time. They manage to push the price down again, but crucially, they can't even get close to the previous low set by the head.
This failure is a massive red flag for the bears. The right shoulder forms at a higher low, which tells you that buyers are now stepping in much sooner and with more conviction. They're not waiting for rock-bottom prices anymore.
The grand finale is the breakout above the neckline. This is the confirmation. When the price decisively breaks through this resistance level, it signals that the buyers have officially won the battle. The downtrend is over, and a new uptrend is likely beginning.
By understanding this story, you stop seeing a random shape and start seeing a clear signal of a fundamental shift in market sentiment—from fear to optimism.
Let's be honest, a lot of chart formations that look like a bullish head and shoulders are just market noise. Mistaking a random wiggle for a high-probability reversal is a classic way to get into a bad trade. To avoid that trap, you need a mental checklist to separate the real deal from the fakes.
Think of yourself as a detective at a crime scene. Seeing three dips on a chart is just one clue; it’s not enough to solve the case. You need to look at the context—the trend that came before it, the specific structure of the lows, and what the trading volume is telling you. A valid pattern isn't just about the shape; it’s about the story the chart is telling.
Before you even think about placing a trade, the pattern has to tick a few critical boxes. These aren't just suggestions; they are the rules that confirm the market psychology we're looking for is actually happening. They show that sellers are finally running out of steam and buyers are starting to take charge.
Here are the three non-negotiables:
This simple visual breaks down exactly what you're looking for.
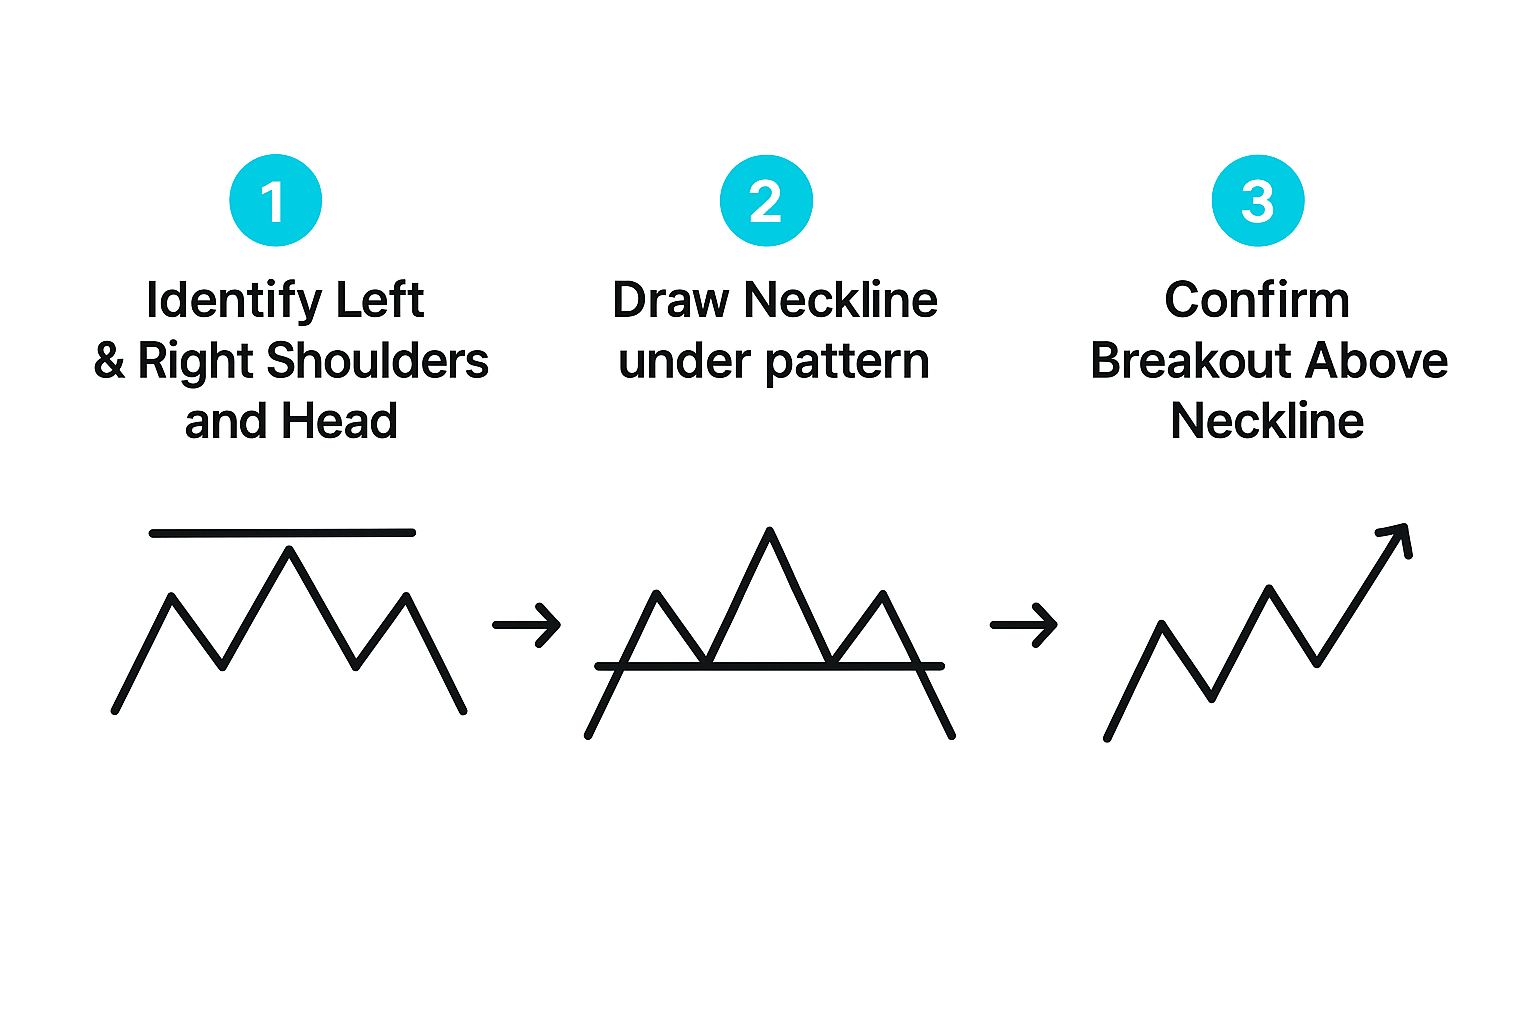
As you can see, it's all about identifying those key components, drawing the neckline, and then waiting for that definitive breakout.
The neckline is the final piece of the puzzle. You draw it by connecting the peaks that form between the left shoulder and the head, and then between the head and the right shoulder. Think of this line as the last line of defense for the sellers.
A breakout above the neckline is the market’s way of shouting that the power has officially shifted from sellers to buyers. It's the green light that confirms the pattern and signals a new uptrend could be starting. Trading before that confirmation is just gambling.
Don't get hung up on the neckline being perfectly flat. An upward-sloping neckline can be an even stronger sign, showing that buyers are getting more aggressive at higher and higher prices. A downward-sloping one is still valid, but it might hint at a less explosive reversal.
The shape of the pattern tells you half the story. The other half? That comes from volume. Volume is like a truth serum for the market—it tells you how much conviction is behind a move. The most reliable patterns have a very specific volume signature.
Here’s what you want to see:
While the classic bearish head and shoulders pattern is well-known for its high success rate—some studies point to an 81% success rate—the bullish version really depends on that volume spike for confirmation. You can learn more about the statistical reliability of chart patterns from deeper market analysis.
Without that surge in volume, a breakout is far more likely to be a "false breakout" or a bull trap, where the price pokes its head above the neckline only to get slammed back down. When you combine the pattern's structure with a close watch on volume, your ability to spot only the A+ setups will improve dramatically.
Spotting a valid bullish head and shoulders pattern is a great first step, but it’s only half the battle. The real skill—and where the money is made or lost—is in how you execute the trade. You need to know exactly when to get in, where to set your safety net, and when to take your profits.
A perfect setup means nothing without a solid game plan. Jumping in too early or hesitating too long can turn a potential winner into a frustrating loss. Let's walk through the practical steps of trading this pattern, starting with how you enter the market.
There’s no single "best" way to enter a trade on this pattern. Your choice really boils down to your personal risk tolerance. Are you aggressive and willing to jump on the first sign of a move, or are you more conservative and need extra confirmation before you commit?
Let’s break down the three most common approaches.
The Aggressive Entry (On the Break): This is for traders who want to get in on the action right away. You place a buy order the moment the price closes above the neckline. The big advantage is you catch the move from the very beginning, maximizing your potential profit. The downside? You're more vulnerable to a "false breakout"—a nasty fake-out where the price pops above the line, only to crash back down.
The Conservative Entry (On the Retest): This is the patient trader's move. You wait for the price to break above the neckline and then pull back to retest it. Once the price bounces off that old resistance line, proving it has become new support, you enter. This approach filters out most false breakouts and often gives you a better risk-to-reward setup, but you do risk the price rocketing up without ever looking back for a retest.
The Secondary Entry (On the First Pullback): What if the breakout is so strong that it doesn't give you a clean retest? You can look for the first small dip or consolidation after the initial surge. Entering here still gets you into the new uptrend relatively early. It requires a good feel for price action, though. If you're new to this, our guide on a complete breakout trading strategy can provide more foundational context.
To help you decide, let's compare the aggressive and conservative approaches side-by-side.
Ultimately, neither is universally better; the right one depends on your trading personality and the specific market conditions you're facing.
No matter how you enter, this next step is non-negotiable. A stop-loss is your shield. It's what protects your capital if the pattern fails and things go south. A failed breakout can reverse hard and fast, so you need your exit plan locked in before you even place the trade.
The most logical place to set your stop-loss is just below the low of the right shoulder. This spot gives the trade enough room to breathe but ensures that if the bullish structure breaks down, you’re out with a small, calculated loss.
Some traders place a tighter stop just below the neckline after a retest. This can work, but it also increases the chance of being shaken out by normal market noise.
Okay, you're in the trade, and your stop-loss is set. Now for the fun part: where do you cash out? The bullish head and shoulders pattern has a handy, built-in tool for this called the measuring objective.
This simple technique gives you a logical price target for the breakout.
This projected level is your minimum profit target. It’s a surprisingly effective way to estimate how far the new uptrend might run. In fact, many breakouts not only hit this target but can lead to impressive gains from 10% to over 30%, depending on the market.
Of course, always watch the trade as it unfolds. If you see momentum fading before the target is hit, don't be afraid to take some profits off the table or tighten your stop-loss to lock in what you've made. Combining the measuring objective with your own analysis is the smartest way to play it.
Even a picture-perfect bullish head and shoulders pattern can cost you money if you fall into a few common traps. Frankly, learning to spot these pitfalls is just as crucial as identifying the pattern itself. If you want to master this setup, you need discipline and a keen eye for the psychological and technical blunders that trip up so many traders.
Once you know what to watch out for, you can trade this powerful pattern with a lot more confidence. Let's dig into the key mistakes you need to sidestep.

One of the biggest mistakes I see is traders seeing what they want to see, not what the chart is actually telling them. It’s easy to try and force a pattern onto price action that just isn’t there, which almost always leads to a failed trade and a lot of frustration.
For instance, you might spot a three-trough formation in a market that's just been chopping sideways. But here’s the thing: this is a reversal pattern. All its predictive power comes from signaling that a downtrend is ending.
If there's no clear, established downtrend leading into the pattern, it’s not a valid bullish head and shoulders. It's just noise, and treating it like a reversal signal is a pure gamble.
Another classic contextual error is trading a breakout that has no volume behind it. Volume is your confirmation. It’s the proof that big money is stepping in to drive the price higher. A breakout on low volume is a massive red flag—it’s often just a bull trap waiting to snap back.
Let's say you've found a perfect pattern in the right context. You can still mess it up with poor trade management. These little tactical mistakes usually boil down to impatience or not having a clear plan for your entry, stop, and target.
Here are a few of the most common ways traders botch the execution:
And now for the biggest sin of all: terrible risk management. This can mean not using a stop-loss at all or betting way too much of your account on a single trade. Remember, no pattern works 100% of the time, and a failed breakout can reverse on you hard and fast.
Your stop-loss isn't optional; it's your lifeline. It defines your maximum pain point before you even get into the trade, ensuring you live to trade another day. A disciplined approach to avoiding these mistakes is what truly separates the pros from the rest.
Even with a great game plan, you're going to have questions as you start seeing the bullish head and shoulders pattern in the wild. That’s perfectly normal. This section is all about tackling the most common things traders wonder about, giving you clear, practical answers so you can trade this setup with a lot more confidence.
Let's dig into the details that really matter.
This is probably the number one question I get. The simple truth is, the bullish head and shoulders is fractal. That's just a fancy way of saying it shows up everywhere—from a buzzing 5-minute chart to a slow-and-steady weekly chart. The basic shape is the same no matter where you look.
What does change, though, is the significance. A pattern on a 15-minute chart might signal a quick pop for a day trader. But find a clean one on a daily or weekly chart? That’s a whole different ballgame. It suggests a major, long-term shift in the market's direction and carries a lot more weight.
As a rule of thumb, the higher the timeframe, the more reliable the pattern. A reversal on a daily chart is far more likely to stick than one on a 5-minute chart, which can get chopped up by market noise.
So, the "best" timeframe really boils down to how you trade.
In a textbook, the neckline is a perfectly straight line. But markets are messy, and real-world charts rarely look like the ones in the books. It's actually very common to see a sloped neckline, and that's perfectly okay. In fact, the slope can give you some extra insight.
An upward-sloping neckline is often a great sign. It tells you buyers are getting antsy and are willing to pay higher and higher prices before the actual breakout. This can often lead to a more explosive move once the price finally clears that line.
On the other hand, a downward-sloping neckline is still valid, but it might hint that the reversal isn't quite as aggressive. The most important thing isn't the exact angle of the neckline. What matters is a clearly defined head and shoulders, followed by a decisive breakout with a nice spike in volume. Don't throw away a great-looking pattern just because its neckline isn't flat.
The bullish head and shoulders is a powerful signal by itself, but why not stack the odds in your favor? Confirming the pattern with another indicator or two can give you a huge confidence boost and help you sidestep weaker setups.
One of my favorite techniques is to look for bullish divergence on an oscillator like the RSI or MACD. This happens when the price makes a new low (the "head" of the pattern), but your indicator makes a higher low. It’s a classic tell that the sellers are running out of steam, and the market is getting ready to turn.
Moving averages are another great confirmation tool. Imagine the price breaks above the neckline and crosses a key moving average like the 50-day or 200-day at the same time. That’s a powerful one-two punch, showing that both the short-term structure and the long-term trend are starting to point in the same direction.
Let's be real: no pattern works 100% of the time. Sometimes, a beautiful bullish head and shoulders will fail. This is often called a "bull trap." The price pokes its head above the neckline, suckering in buyers, only to slam back down below it.
When this happens, it’s a very bearish signal. It shows that the buyers just didn't have the muscle to push the market higher, and the sellers have taken back control with force. These failed breakouts can lead to some seriously fast and nasty sell-offs, as all the trapped buyers rush to sell their positions and limit the damage.
This is exactly why smart risk management is so crucial. Your stop-loss is your best friend here. Placing it just below the low of the right shoulder or neckline acts as your safety net. If the pattern fails, you take a small, manageable loss and live to trade another day.
Ready to stop guessing and start trading with data-driven precision? The EzAlgo indicator suite for TradingView provides clear, real-time buy and sell signals, automatically identifying key levels and momentum shifts so you can trade patterns like the bullish head and shoulders with institutional-grade confidence. Remove the emotion and guesswork from your strategy by visiting the official EzAlgo website to see how our tools can give you the edge you need.


%201.svg)