


Breakout trading is all about timing. It’s a strategy where you jump into a market right when an asset’s price punches through a known support or resistance level. The whole idea is to catch the wave of momentum that usually follows these moves and ride it for a profit.
At its core, breakout trading is a game of patience followed by quick action. Think of a price chart where a stock or currency is just bouncing back and forth between a floor (support) and a ceiling (resistance). We call this a consolidation phase.
During this quiet period, buyers and sellers are basically at a standstill. Nobody has the strength to push the price into a new, clear trend. This stalemate creates a coiled spring—orders start piling up just above the resistance and just below the support, waiting for a trigger.
A breakout happens when that balance of power shatters. A sudden push above resistance means the buyers have finally taken control, soaking up all the sell orders at that level. This can set off a chain reaction of new buy orders, creating a powerful, explosive move as momentum takes over. The same logic applies, just in reverse, for a breakdown below a support level.
This is the real reason breakouts work: they tap directly into market psychology and the mechanics of order flow.
A breakout isn't just a technical event on a chart; it's the financial representation of a shift in collective market sentiment. It signifies the point where conviction finally overpowers indecision.
The basic concept here isn't new. Breakout trading has deep roots in classic trend-following methods, famously put to the test in the Turtle Trading experiment back in the 1980s. Their whole game was buying new highs and selling new lows.
Things got more complex with the rise of algorithmic trading between 2015 and 2018, which made signals more precise but also gave us the headache of algo-driven "false breakouts." More recently, from 2019 to 2021, AI-powered analytics have helped traders get better at telling a real move from a fake-out. If you're curious about the history, TradingCup has a great rundown on how these strategies developed over time.
In the end, this strategy remains popular because it’s based on something you can see and react to. You're not trying to guess the future—you're responding to what the market is doing right now. When managed well, catching the very beginning of a new trend can offer some of the best risk-to-reward opportunities out there.
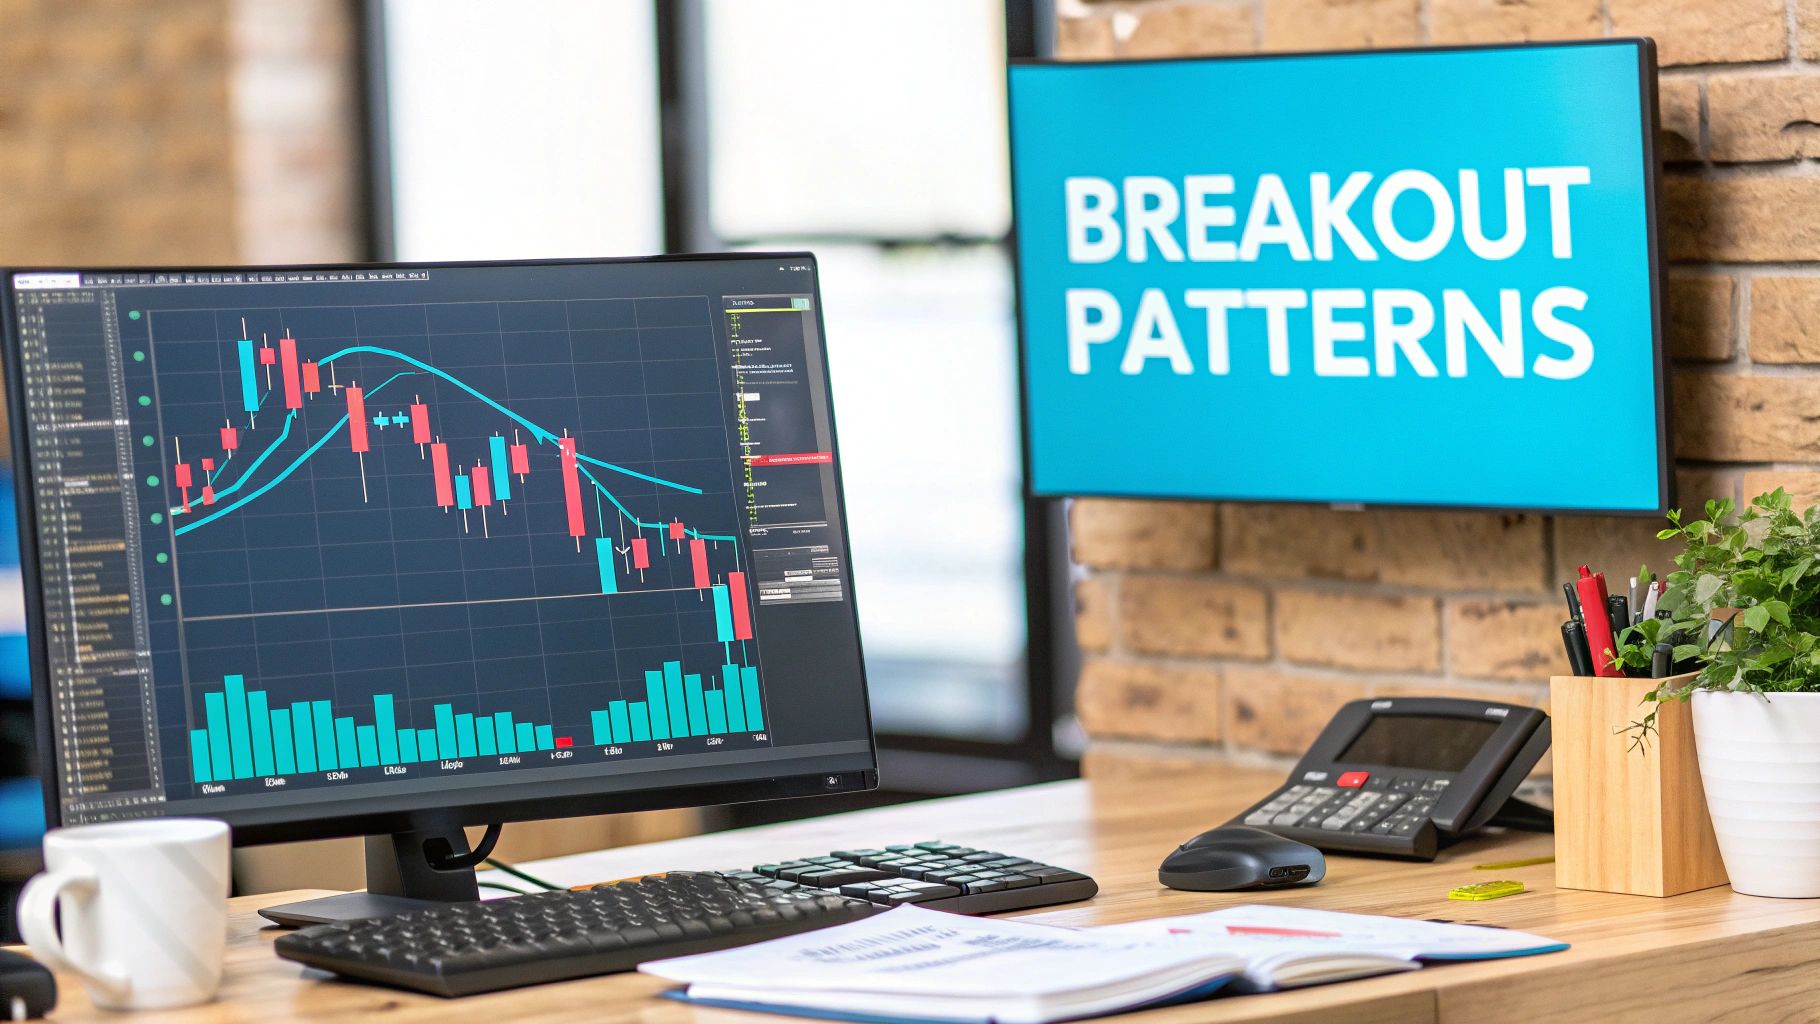
A great breakout strategy all starts with one thing: learning to read the charts. You need to get good at spotting the tell-tale signs that a big move is just around the corner. While you could spend years memorizing dozens of complex formations, I've found that the most successful traders stick to a handful of reliable patterns that show up again and again.
The trick isn't just pattern recognition; it's about understanding the story the chart is telling. These patterns are a visual representation of a consolidation phase—a tug-of-war between buyers and sellers where pressure is building up. When the price finally breaks out of that pattern, it's a clear signal that one side has overpowered the other.
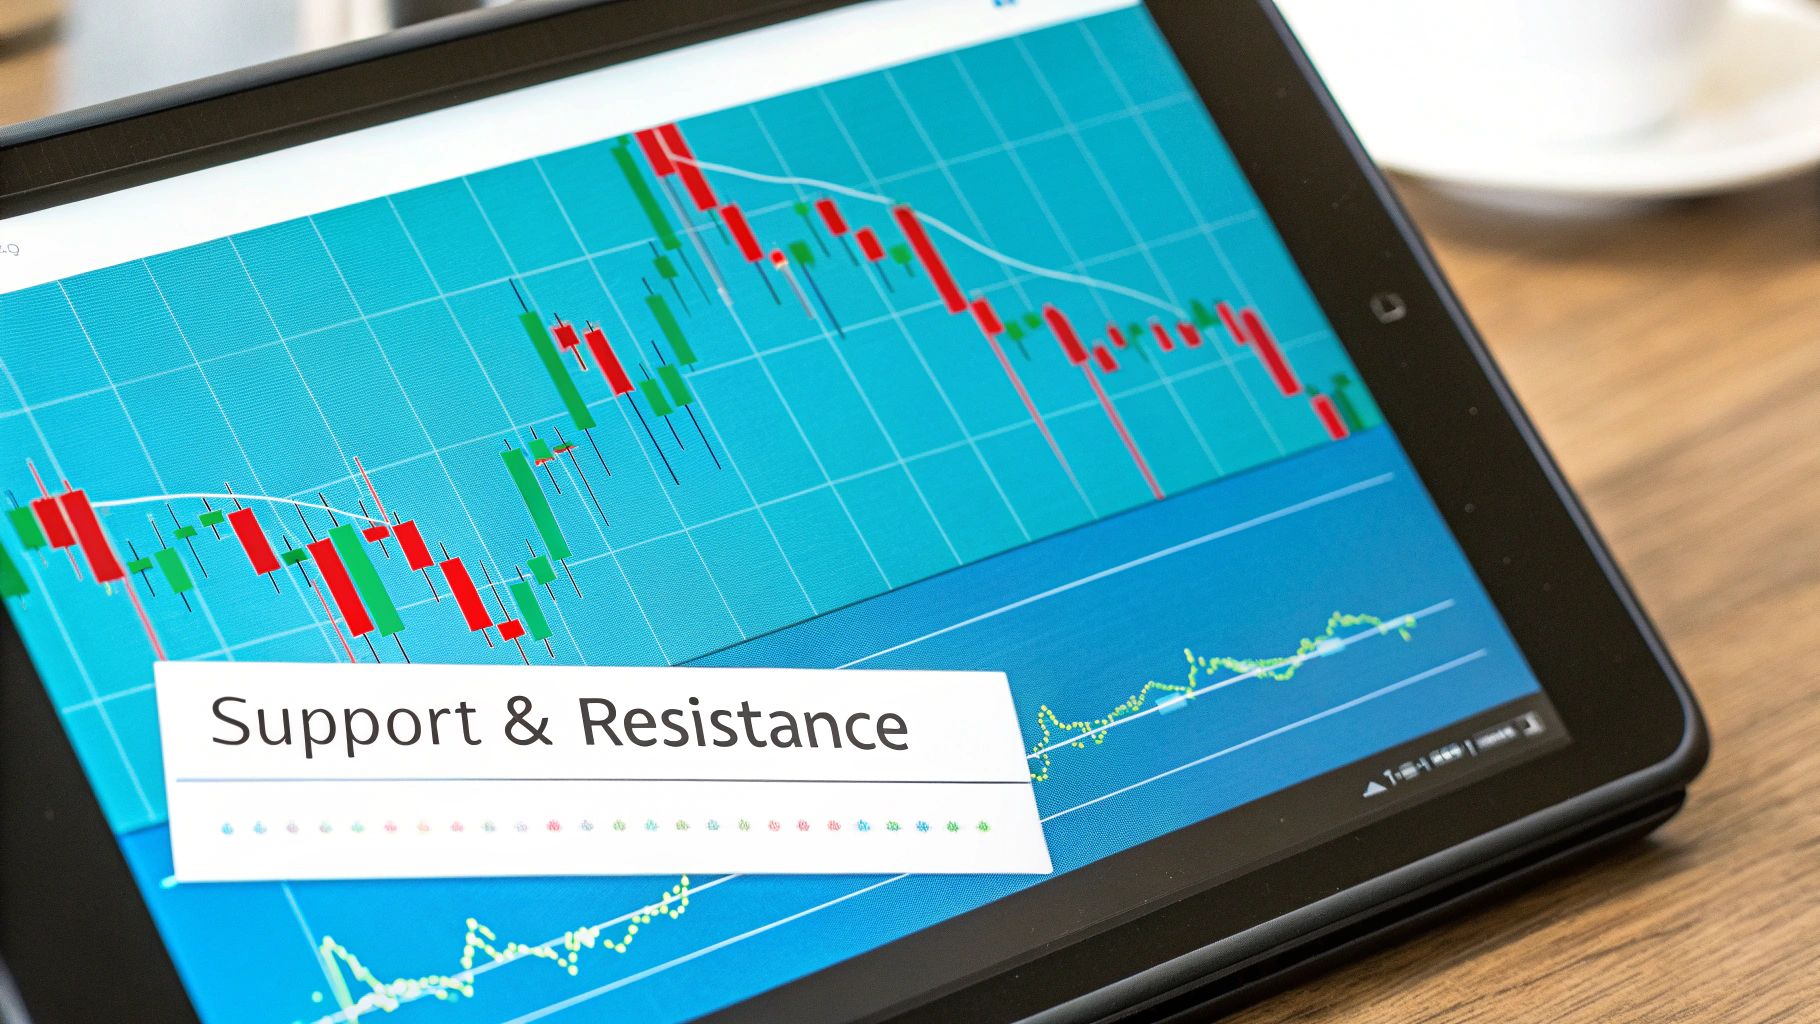
Some of the most trustworthy patterns are actually the simplest. They appear when the price gets squeezed into a tighter and tighter range, creating an obvious ceiling (resistance) and floor (support). Your job is to spot this compression before the energy is released.
Here are a few classic patterns I always keep an eye on:
Drawing good trendlines is crucial for this. You want to connect at least two major swing highs for a resistance line or two major swing lows for a support line. The more times the price touches that line, the more important it becomes.
While these chart patterns give you the bigger picture, you can get even more detail by learning how to understand candlestick patterns in our other guide.
To help you get started, here's a quick cheat sheet summarizing the most common breakout patterns and what they typically mean.
This table breaks down the essential chart patterns that often precede a significant price move. Use it as a quick reference to identify what's happening on your chart and what to look for next.
Remember, these patterns are about recognizing market psychology in a visual format. A triangle shows indecision resolving, while a flag shows a brief pause in a strong trend.
A price move without volume is just noise. It's like a car revving its engine but not going anywhere. Volume is the fuel that drives real, sustainable breakouts.
Anytime you see a genuine breakout above a key resistance level or below a critical support zone, it absolutely must be accompanied by a significant spike in trading volume. No exceptions.
A price breakout on low volume is a massive red flag. It often means the big institutional players aren't behind the move, which is a classic sign of a "false breakout" waiting to trap you.
Think of it this way: when the price smashes through a key level, you want to see a flood of new traders rushing in to support that move. If volume is flat or, even worse, declining as the price breaks out, it tells you there's no real conviction. The move is likely to fizzle out and reverse, leaving you on the wrong side of the trade. Paying attention to volume can save you from countless frustrating losses.
Spotting a great pattern is one thing, but actually trading it well is where the money is made. The difference between a consistently profitable trader and one who just gets lucky now and then comes down to a solid, repeatable plan. This framework is all about taking the emotion and guesswork out of the equation so you have a systematic approach for every single breakout trade.
So, how do you turn your trade idea into an actual order? Instead of gluing your eyes to the screen, waiting to pounce, let the market do the work. Use automated order types like a buy-stop for long trades or a sell-stop for short ones.
By placing your order just a tick above the resistance or below the support level, you're essentially telling your broker, "If the breakout happens, pull me in." This simple step builds discipline and stops you from jumping the gun out of impatience or fear of missing out.
Before you even start dreaming about profits, you need to know exactly where you’ll get out if the trade goes south. This is non-negotiable. Your stop-loss has to be set before you enter the trade.
A tried-and-true technique is to place your stop-loss just below the last swing low inside the consolidation pattern (for a long trade). If you're going short, you'd place it just above the most recent swing high. This gives the trade a little bit of wiggle room without exposing your account to a massive hit.
The chart below gives you a bird's-eye view of how a typical breakout trade unfolds, from the initial signal right through to the exit.
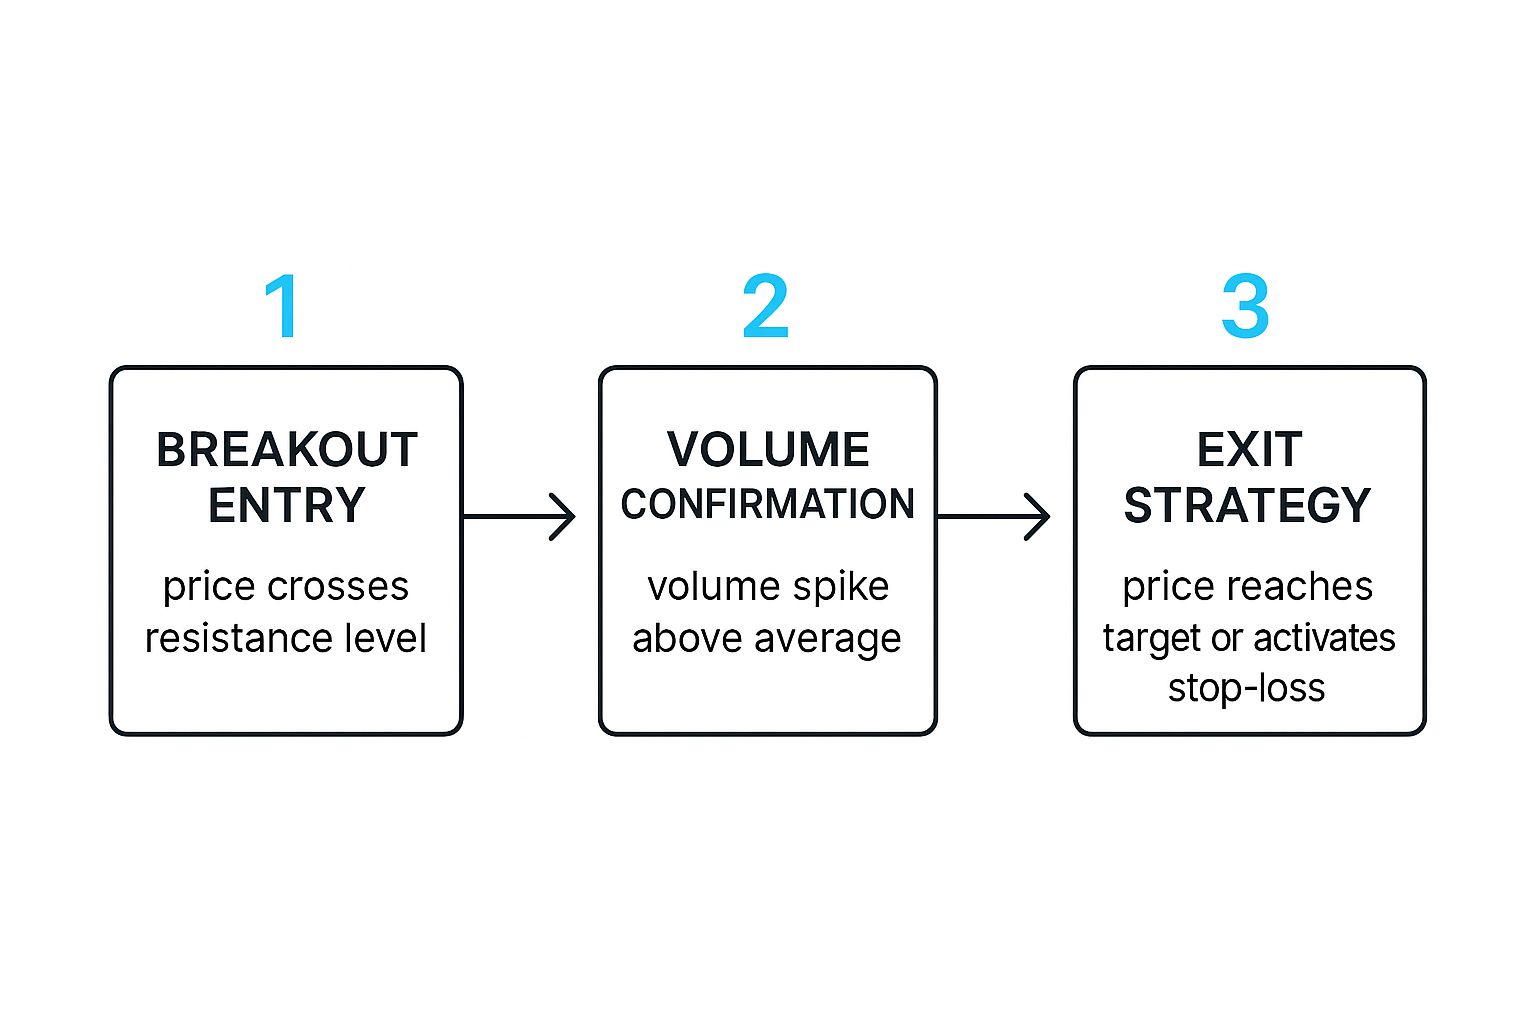
It really boils down to three core mechanics: the price has to convincingly break a key level, volume should ideally confirm the move's strength, and you need to have your profit and loss exits planned in advance.
Okay, with your risk locked down, now we can talk about the fun part—getting paid. Setting clear profit targets is crucial for actually banking your winnings instead of watching a great trade reverse and turn into a loser.
Here are a few solid methods I've used over the years:
Your goal isn't to catch the entire move from the absolute bottom to the absolute top. It’s to consistently grab the meatiest, most probable part of the move while keeping your risk buttoned up tight.
What’s interesting is that when you look at the stats, breakout strategies don't need a super high win rate to be profitable. A study on gold's price ETF (GLD) found that a 20-day high breakout only won about 53% of the time. But—and this is the important part—the average winning trade was way bigger than the average loser. This proves you just need your winners to pay for your losers and then some. You can dive deeper into the data on these breakout trading strategies to see how they hold up in various markets.
Here’s what a pre-set buy-stop order looks like on a TradingView chart, ready to go.
See how the entry is already in the system? This creates a hands-off execution once the price hits that trigger. It’s this kind of disciplined, process-driven approach that separates the pros from the amateurs in the long run.
Let's get one thing straight: not every breakout is going to be a winner. In fact, the market loves to tease. You'll see what looks like a perfect setup, a powerful push past a key level, only for it to snap back and stop you out. It happens to everyone.
This is the moment of truth for any breakout strategy. Your success isn't defined by the big wins, but by how you manage the inevitable fakeouts. If you get sloppy with your risk, a few of these false moves can bleed your account dry before a real trend ever gets going. It’s about protecting your capital—both financial and mental.
The single most important rule I can give you is this: never risk more than 1% of your account on any single trade. It’s that simple, yet incredibly powerful.
If you’re working with a $10,000 account, your maximum loss on one trade is capped at $100. Period. This isn't just a suggestion; it's a non-negotiable part of the job.
This rule forces you to think before you act, calculating your position size based on where your stop-loss needs to be, not on gut feeling. It’s the circuit breaker that protects you from your own emotions and ensures you live to trade another day, even after a string of losses.
A false breakout isn’t a personal failure—it’s just the cost of doing business. A rock-solid risk plan turns these market quirks into predictable expenses, keeping you in the game long enough to catch the trades that really matter.
We go much deeper into these crucial concepts in our guide on effective risk management for traders.
Before you ever hit that "buy" button, you have to ask yourself one question: "Is this trade actually worth it?" That’s where the risk-to-reward ratio comes into play. You're simply comparing what you stand to lose if you're wrong (the distance to your stop-loss) with what you could gain if you're right (the distance to your take-profit).
As a general rule of thumb, I won't even consider a trade unless it offers at least a 1:2 risk-to-reward ratio. This means for every dollar I'm putting on the line, I need to have a realistic shot at making two.
Here’s what that looks like in a real trade:
In this scenario, you have a solid 1:3 risk-to-reward ratio. With numbers like these, you can be wrong two times in a row, catch one winner, and still come out profitable. That's how professional traders stay ahead.
I see this all the time with new traders: they get completely hung up on their win rate. They think if they're not winning 70% or 80% of their trades, something must be broken. After a few small losses in a row, they get discouraged and ditch their strategy.
But here's a secret that most seasoned pros understand, especially when it comes to breakout trading: your win rate doesn't matter nearly as much as the size of your wins.
The real game isn't about being right all the time. It's about making sure your winning trades are dramatically bigger than your losing ones. This concept, known as positive expectancy, is what separates consistently profitable traders from the rest. It's the mathematical edge that keeps you in the game long-term.
The magic behind this is what we call an asymmetric risk-reward profile. It sounds complicated, but the idea is simple: your potential profit on any given trade should dwarf your potential loss.
Let me break it down with a quick example.
With that kind of setup, you can be wrong three times in a row, losing a total of $300. But then, on the fourth trade, you hit your target and bank $400. Despite having a dismal 25% win rate, you're still up $100. This is the engine that drives a successful breakout strategy.
Shifting your focus from winning often to winning big is a complete game-changer. It trains you to cut your losses without hesitation and gives you the discipline to let your winners run, instead of snatching small profits off the table too early.
This mindset is your best defense against the psychological grind of trading. When you hit an inevitable string of losses, you won't panic. You'll know that those small, controlled losses are just the cost of finding that one explosive move that pays for everything.
This isn't just some trading philosophy; historical data backs it up. There's a fascinating backtest of a basic breakout system on the Russell 1000 index that ran for 31 years. The final result? A net profit of over 5,000%.
But here’s the kicker: the win rate for that system was only 48.75%. It lost more often than it won!
The system worked because the average winning trade pulled in a massive 62.42% gain, while the average loser was capped at a small 11.81% loss. The huge wins completely overshadowed all the small paper cuts along the way. If you're curious, you can dig into these compelling breakout system findings and see the raw numbers for yourself.
So, forget about perfection. Stop trying to win every trade. Instead, focus on executing your plan flawlessly, managing your risk like a professional, and patiently waiting for those monster breakouts. One or two of those a year can make all the difference.
Jumping into breakout trading can feel like trying to solve a puzzle. You see the potential, but a few nagging questions always seem to pop up, especially when your money is on the line. It's one thing to read about it, but actually clicking the "buy" button is a whole different ball game.
Let's cut through the noise and tackle some of the most common questions I hear from traders trying to master this strategy. My goal here is to give you straightforward answers you can actually use.
Honestly, there isn't one. The best time frame for you depends entirely on your personality and how much time you can dedicate to the charts.
A day trader living off of coffee and quick moves might thrive on a 5-minute or 15-minute chart, aiming to catch those sharp, intraday pops. On the other hand, if you have a day job, a 4-hour or daily chart is probably more your speed. This lets you identify major moves that play out over several days, without having to be glued to your screen.
The strategy itself doesn't change, just the canvas you're painting on. The real key is picking a time frame that fits your life so you can make decisions without feeling rushed.
First, let's get one thing straight: you'll never avoid false breakouts entirely. They're just part of the game. But you can absolutely get better at spotting and managing them so they don't drain your account. Think of it as developing a "fakeout filter."
Here are a few things that have saved me countless times:
A false breakout isn't a failure—it's just the market giving you information. By adding simple confirmation steps, you can turn this common frustration into one of your most effective filters.
For a breakout trading strategy, less is almost always more. Piling on too many indicators just creates confusion and makes you second-guess everything. I prefer to stick with a few simple tools that give me the information I need, fast.
Volume is my number one. It's non-negotiable. It tells you if there’s any real power behind the price move.
I also keep a couple of moving averages on my chart, usually the 20 and 50 EMA, just to get a quick read on the trend's direction. Some traders like using the RSI for momentum, but be careful—entering a breakout when the RSI is already screaming "overbought" can be risky.
Finally, tools that automatically draw support and resistance levels can be a game-changer. They do the heavy lifting for you, pointing out the exact zones where a breakout might happen.
Ready to stop guessing and start trading with more clarity? EzAlgo provides AI-driven indicators that automatically identify key support and resistance levels, giving you a clear edge in your breakout trading strategy. Explore our tools and join a community of traders who value data over drama.


%201.svg)