


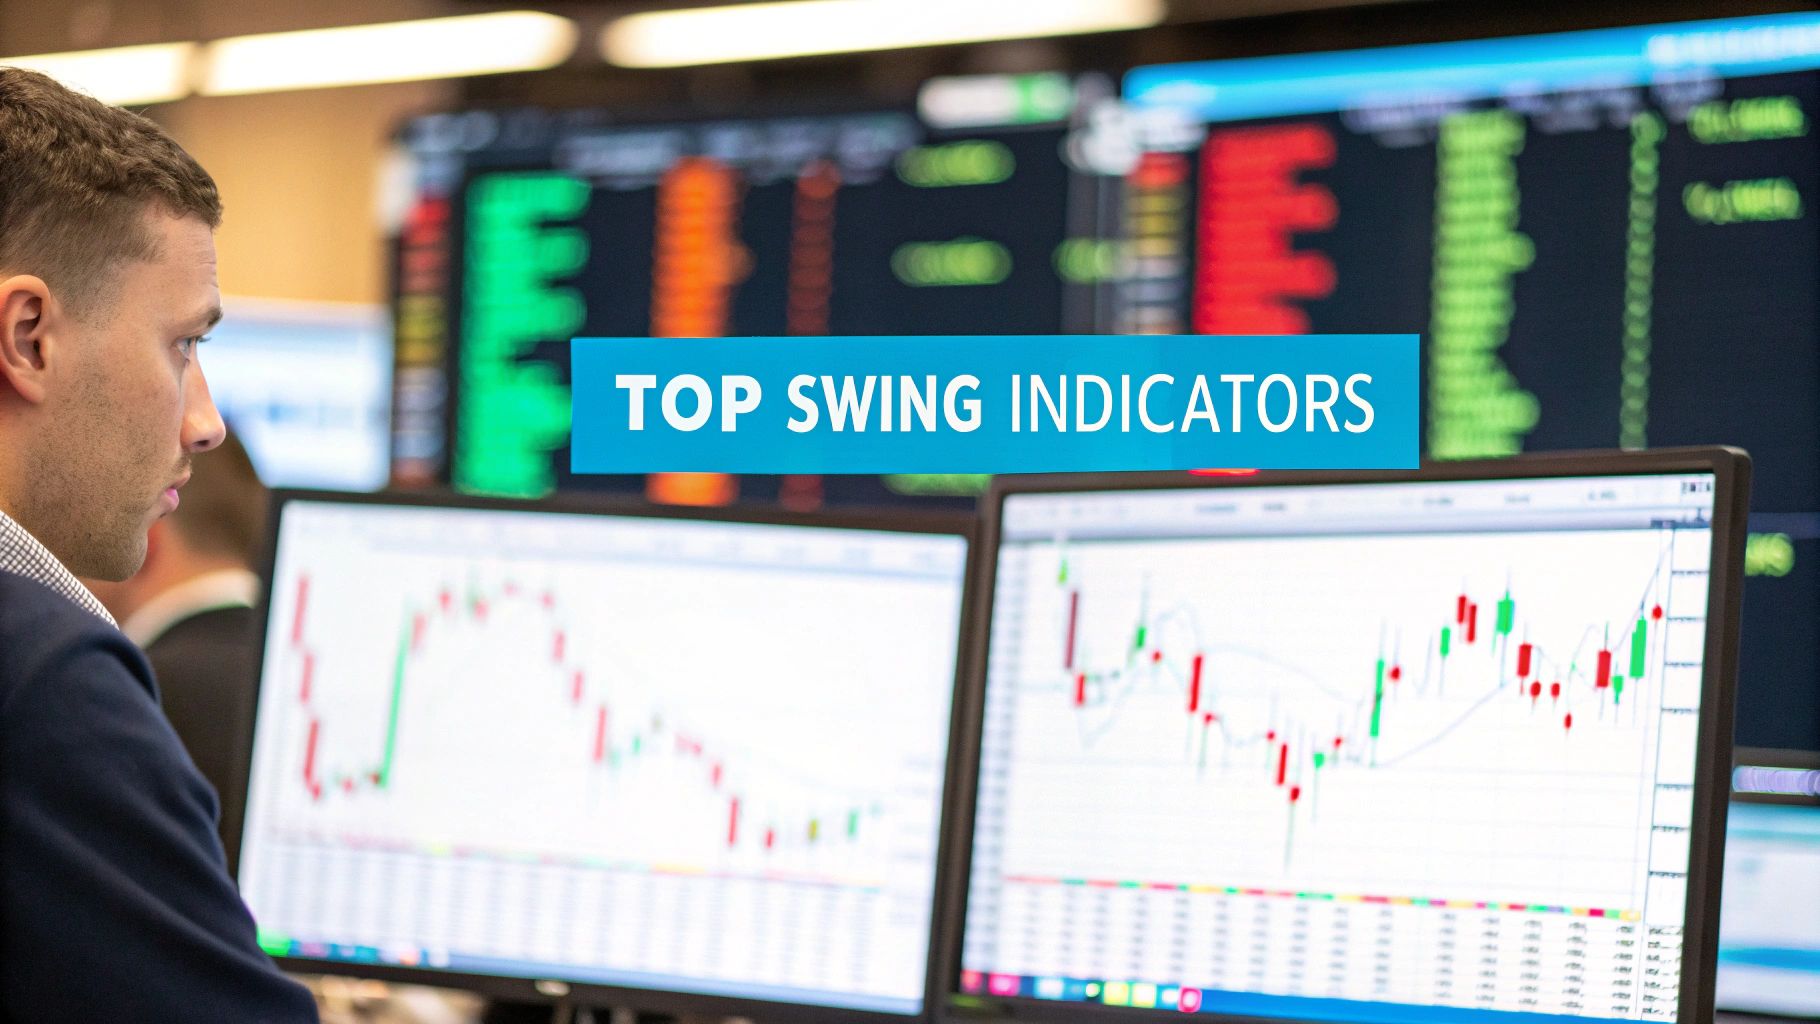
Swing trading is a balancing act between short-term noise and long-term trends, requiring tools that provide clarity and precision. The right technical indicators can transform your approach, helping you identify high-probability entry and exit points over days or weeks. But with countless options available, which ones truly deliver the most reliable signals? Finding the best technical indicator for swing trading often comes down to matching the right tool with your specific strategy and market conditions. A powerful indicator should not only highlight potential trends but also measure momentum and define risk.
This guide cuts through the complexity. We've rounded up the seven most effective technical indicators that consistently help traders capitalize on market swings. We will explore how each tool works, its unique strengths for capturing price movements, and how to integrate them with advanced systems like EzAlgo to gain a decisive edge. Whether you're a seasoned analyst or just starting, this curated list will equip you with the practical knowledge to trade with greater confidence and accuracy. By the end, you'll understand how to apply the MACD, RSI, Bollinger Bands, and more to make more informed trading decisions.
The Moving Average Convergence Divergence (MACD) is a versatile and widely used tool, often cited as the best technical indicator for swing trading by many seasoned traders. Developed by Gerald Appel, it's a trend-following momentum indicator that reveals the relationship between two exponential moving averages (EMAs) of a security's price. Its strength lies in its ability to pinpoint shifts in momentum and potential trend reversals, which are crucial for swing trading over days or weeks.
The MACD consists of three main elements: the MACD line, the signal line, and the histogram. These components work together to provide clear buy and sell signals, making it a favorite for both new and experienced analysts.
For swing traders, the primary signal is the crossover. When the MACD line crosses above the signal line, it suggests that bullish momentum is increasing, presenting a potential entry point for a long position. Conversely, a cross below the signal line indicates growing bearish momentum, signaling a possible short entry or an exit from a long position.
For instance, looking at Apple (AAPL) in 2020, a clear bullish MACD crossover preceded a significant uptrend, offering an ideal swing trade opportunity. Similarly, a bearish divergence on Tesla's (TSLA) chart in 2021 warned of a pending price correction, allowing traders to protect profits.
To help you understand its core structure, this summary box breaks down the three key components of the MACD indicator.
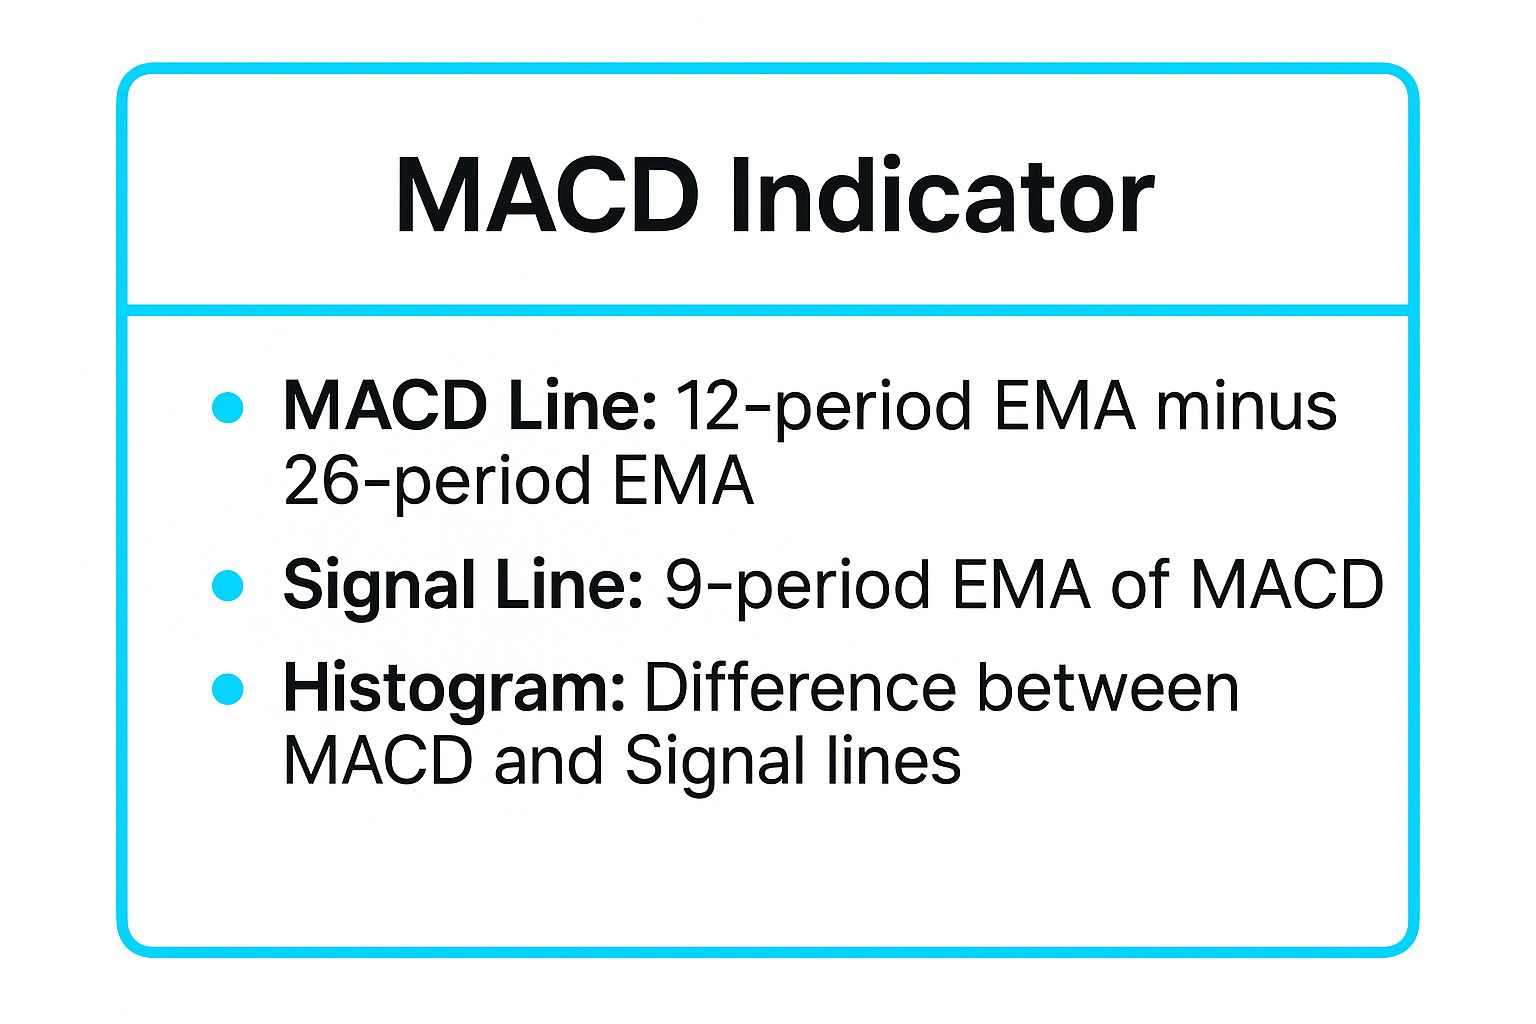
This visual breakdown shows how each element is calculated, providing a quick reference for interpreting the indicator's signals on your chart.
To effectively integrate MACD into your strategy, consider these practical tips:
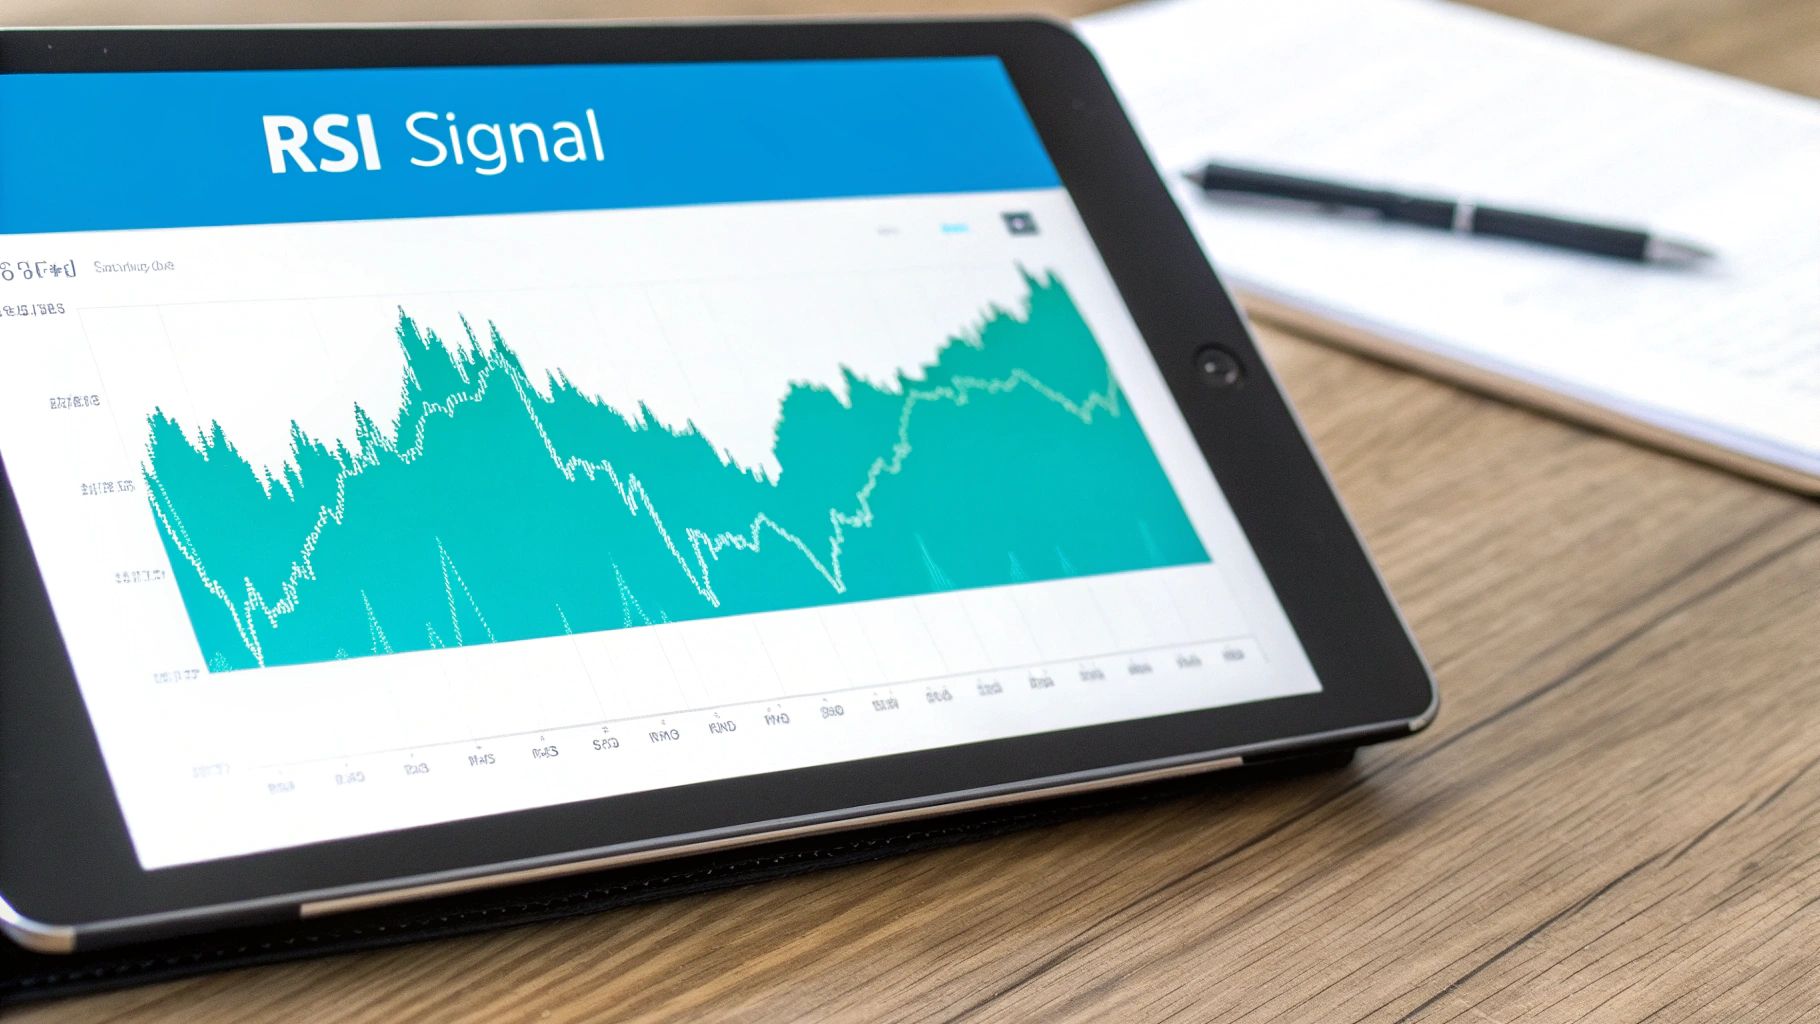
The Relative Strength Index (RSI) is a powerhouse momentum oscillator that consistently ranks as a best technical indicator for swing trading. Developed by J. Welles Wilder Jr., the RSI measures the speed and magnitude of recent price movements to evaluate overbought or oversold conditions in the price of an asset. Its ability to signal potential trend exhaustion and reversals makes it indispensable for swing traders aiming to capture market swings over several days or weeks.
The indicator is plotted on a scale from 0 to 100, providing clear visual cues. Traditionally, an asset is considered overbought when the RSI is above 70 and oversold when it is below 30. These levels act as key zones where momentum may be ready to shift, presenting prime entry and exit opportunities.
Swing traders use the RSI to time their entries and exits with precision. When the RSI dips below the 30 level and then crosses back above it, it signals that bearish momentum is fading and a potential price bottom is forming. This is a classic buy signal for a long position. Conversely, an RSI value rising above 70 and then falling back below it suggests bullish momentum is waning, providing a signal to exit a long position or consider a short trade.
For example, during various market dips, Microsoft (MSFT) has shown strong bounces after its RSI entered oversold territory, offering profitable swing trades. Similarly, a significant bearish divergence between Bitcoin's price and its RSI in 2021 preceded a major correction, giving traders an early warning to take profits or hedge their positions. Gold futures often use the 50 level as a dynamic support and resistance line, further validating its use as a trend filter.
To effectively integrate the RSI into your swing trading strategy, consider these practical tips:
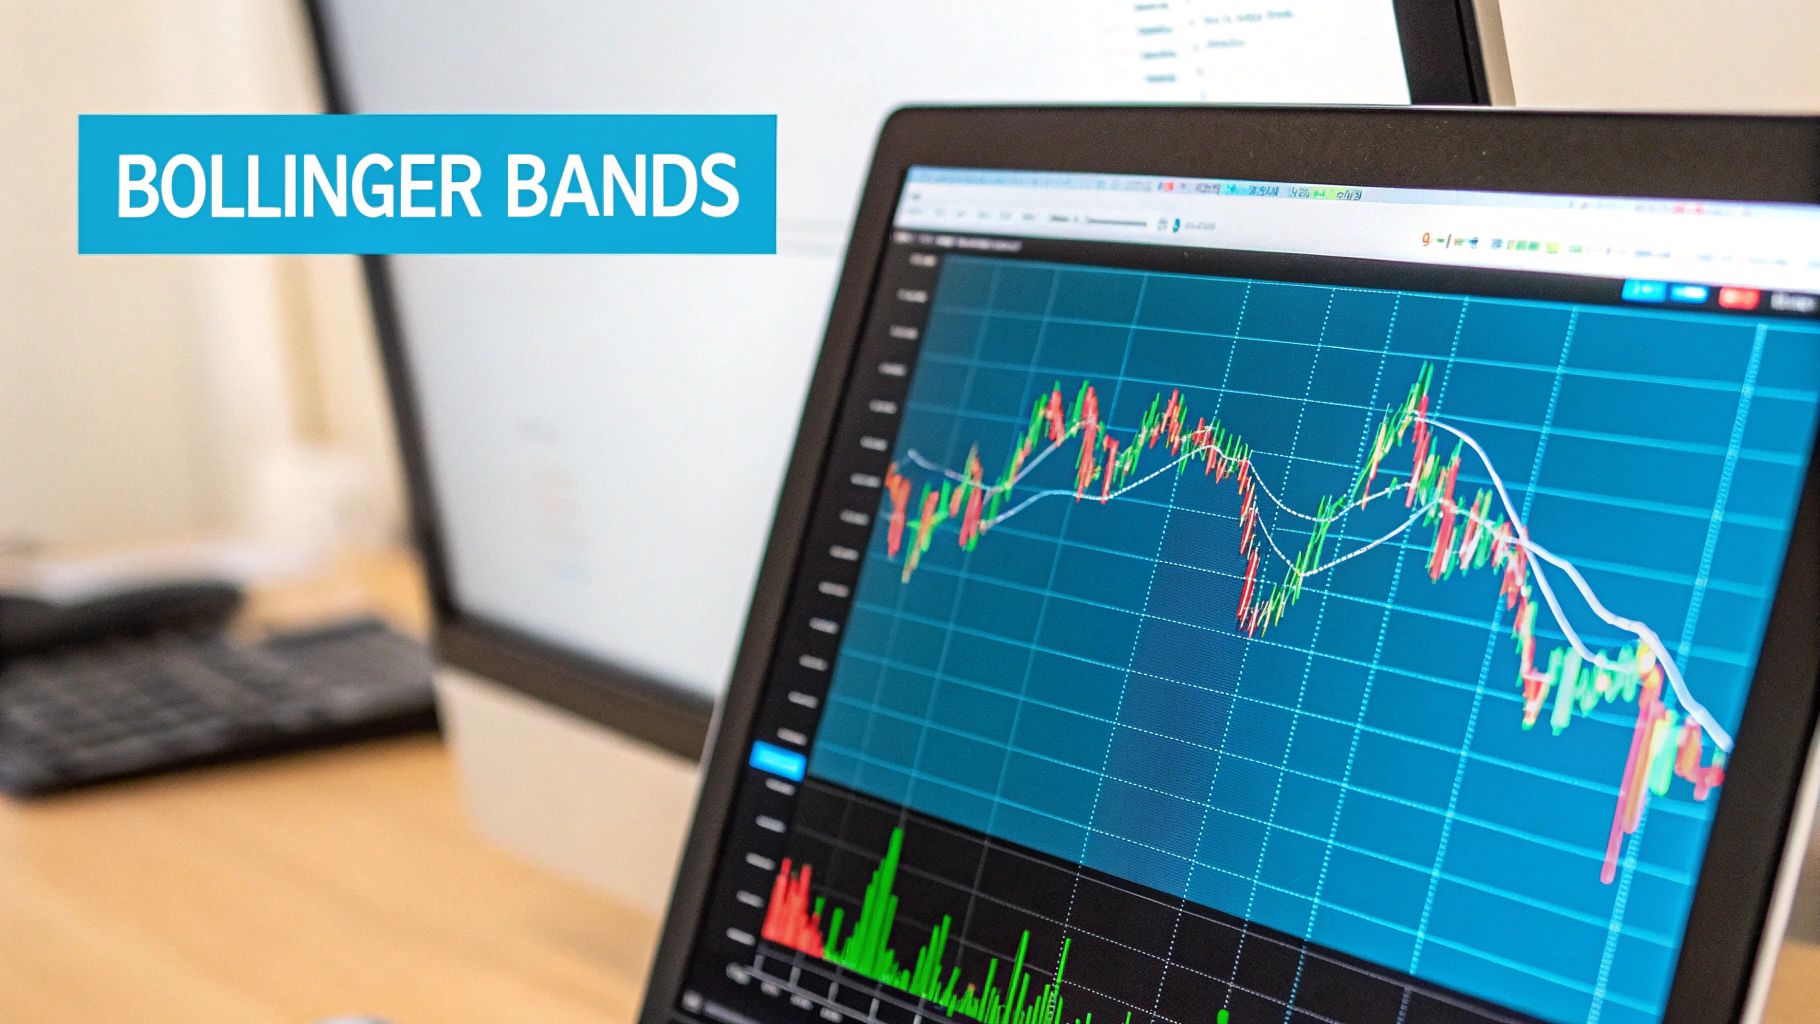
Developed by John Bollinger in the 1980s, Bollinger Bands are a powerful volatility indicator that many consider the best technical indicator for swing trading in both ranging and trending markets. They consist of three lines: a simple moving average (SMA) in the middle, and two outer bands set at two standard deviations away from the SMA. These bands dynamically expand and contract with market volatility, providing fluid support and resistance levels.
Their strength lies in identifying overbought and oversold conditions relative to recent price action. When the price touches the upper band, it may be overextended and due for a pullback. Conversely, a touch of the lower band can signal an oversold condition and a potential bounce.
Swing traders use Bollinger Bands to pinpoint entry and exit points based on volatility. In a consolidating market, traders can enter long positions when the price bounces off the lower band and exit or short near the upper band. For example, Amazon (AMZN) often bounces between the bands during consolidation periods, offering predictable swing opportunities.
A "squeeze" is another critical signal. When the bands contract tightly, it indicates low volatility and often precedes a significant price breakout. A swing trader might watch for a EUR/USD squeeze, preparing to enter a trade in the direction of the eventual breakout. Similarly, during downtrends, the upper band can act as a formidable resistance level, as seen with Netflix (NFLX) in past corrections.
To maximize the effectiveness of Bollinger Bands in your swing trading strategy, apply these practical tips:
The Stochastic Oscillator is a powerful momentum indicator that helps traders identify overbought and oversold conditions. Developed by George Lane, it compares a security's closing price to its price range over a specific period, making it a contender for the best technical indicator for swing trading. Its core strength is its ability to show shifts in price momentum, often before a price reversal actually occurs.
The indicator consists of two lines plotted between 0 and 100: the %K line (the fast stochastic) and the %D line (the slow stochastic, which is a moving average of %K). These lines oscillate between overbought (above 80) and oversold (below 20) zones, providing clear visual cues for potential turning points in the market.
For swing traders, the Stochastic Oscillator offers two primary signals: crossovers and overbought/oversold levels. A bullish signal occurs when the %K line crosses above the %D line, especially when this happens in the oversold territory below 20. This suggests that bearish momentum is waning and a potential upward swing is imminent. Conversely, a bearish crossover above the 80 level signals that an uptrend may be losing steam.
For example, on the GBP/JPY currency pair chart, a bullish stochastic crossover in the oversold zone often precedes a strong multi-day rally, offering a clear entry for a long position. Similarly, a bearish divergence on Google's (GOOGL) chart, where the price makes a new high but the stochastic fails to do so, has historically warned of a pending correction.
To effectively integrate the Stochastic Oscillator into your swing trading strategy, consider these practical tips:
While many indicators focus on price direction, the Average True Range (ATR) excels at measuring something equally critical: volatility. Developed by J. Welles Wilder Jr., the ATR is often considered the best technical indicator for swing trading when it comes to risk management. It doesn't provide buy or sell signals but instead quantifies the degree of price movement, helping traders set realistic stop-losses and profit targets.
The ATR calculates the average of the "true range" over a specific period, usually 14 days. This gives a clear monetary value for how much an asset typically moves, allowing traders to adapt their strategies to current market conditions rather than using a fixed risk model.
For swing traders, ATR is an indispensable tool for managing risk and expectations. A rising ATR indicates increasing volatility, suggesting that wider price swings are likely. A falling ATR signals a period of consolidation or quieter price action. Traders use this information primarily for setting stop-losses and determining appropriate position sizes.
For example, a forex trader might place their stop-loss at a multiple of ATR, such as 2x ATR below their entry price. This dynamic stop adjusts to the pair's current volatility. Similarly, a swing trader looking at a volatile tech stock like NVIDIA (NVDA) would use a high ATR value to justify a smaller position size to keep their risk per trade consistent. If you'd like to learn more about the fundamentals of this trading style, check out our guide on how to swing trade.
To effectively integrate ATR into your swing trading strategy, consider these practical tips:
Fibonacci Retracement is a powerful tool used to identify potential support and resistance levels, making it a strong candidate for the best technical indicator for swing trading. Based on the mathematical sequence discovered by Leonardo Fibonacci, this indicator draws horizontal lines at key percentage levels: 23.6%, 38.2%, 50%, 61.8%, and 78.6%. Its primary strength is helping traders pinpoint high-probability entry points during market pullbacks within an established trend.
This tool is not a complex oscillator but a series of static levels that remain fixed once drawn between a significant swing high and swing low. These levels act as hidden areas of interest where the price is likely to react, allowing swing traders to enter a trend at a more favorable price.
For swing traders, the goal is to enter a trade as a price correction ends and the primary trend resumes. By drawing the Fibonacci tool from the start of a trend move (swing low) to its peak (swing high), you can identify potential pullback zones. A price bouncing off the 38.2%, 50%, or 61.8% levels often signals that the correction is over and presents a strategic entry point for a long position.
For example, during its strong uptrend in 2020, Tesla (TSLA) stock frequently pulled back to the 61.8% Fibonacci level, which acted as a solid support zone before the next leg up. Similarly, the S&P 500 has historically found support at the 50% retracement level during market dips, offering ideal swing entry opportunities for index traders.
To effectively integrate Fibonacci levels into your swing trading strategy, consider these practical tips:
The Ichimoku Cloud, or Ichimoku Kinko Hyo, is a comprehensive, all-in-one tool that many consider the best technical indicator for swing trading due to its multi-faceted approach. Developed in Japan by Goichi Hosoda, this indicator provides a complete picture of the market by defining support and resistance, identifying trend direction, and gauging momentum in a single view. Its visual nature, especially the "cloud," helps traders quickly assess market structure.
Ichimoku is composed of five distinct lines: the Tenkan-sen (Conversion Line), Kijun-sen (Base Line), Chikou Span (Lagging Span), and Senkou Span A and B, which form the Kumo, or cloud. These elements work in harmony to offer a clear and forward-looking perspective on price action.
For swing traders, the Ichimoku Cloud’s primary function is to identify strong, established trends. When the price is trading above a green cloud, it signals a powerful uptrend, presenting an ideal environment for long positions. Conversely, trading below a red cloud indicates a strong downtrend, signaling potential short opportunities. The cloud itself acts as a dynamic zone of support and resistance.
For example, on the EUR/USD forex pair, a consistent uptrend often saw price bouncing off the top of the Kumo cloud, providing multiple entry points for swing traders. Similarly, Japanese stocks, where the indicator originated, frequently show textbook Ichimoku signals, with price breaking out of the cloud to begin major trends. Its ability to forecast future support and resistance zones makes it exceptionally powerful for planning trades.
To effectively integrate the Ichimoku Cloud into your swing trading strategy, consider these practical tips:
We've explored a powerful arsenal of tools, from the trend-following prowess of the MACD and Ichimoku Cloud to the momentum insights of the RSI and Stochastic Oscillator. We covered how Bollinger Bands define dynamic volatility channels, how Fibonacci Retracement pinpoints potential reversal zones, and how ATR helps manage risk. Yet, the search for the single best technical indicator for swing trading often leads to a more profound realization: the most successful traders don't rely on one magic tool. They build a comprehensive system.
The true power lies not in any single indicator, but in the confluence of signals. Imagine a scenario where the price pulls back to a 61.8% Fibonacci level, which also aligns with the lower Bollinger Band. At the same time, the RSI shows an oversold reading and the Stochastic Oscillator prints a bullish crossover. This alignment of multiple, non-correlated indicators creates a high-probability setup that is far more reliable than any one signal in isolation.
Your goal is to move from being an indicator-follower to a system-builder. This involves selecting a few complementary tools that resonate with your trading style and risk tolerance.
To synthesize the insights from this guide, focus on these core principles:
Building this system takes practice, patience, and a commitment to refining your process. The indicators we've discussed are the building blocks. By understanding their mechanics and learning how to spot confluence, you transform raw market data into actionable trading plans. This disciplined approach removes emotional decision-making and replaces it with a logical, repeatable strategy.
Ultimately, mastering these tools empowers you to trade with confidence, knowing each decision is backed by a well-reasoned system. This is the foundation upon which consistent profitability is built, turning the art of technical analysis into a structured and effective trading business.
Ready to stop guessing and start trading with a proven system? EzAlgo synthesizes the principles of these classic indicators into a single, powerful tool, providing clear buy/sell signals and automating complex analysis to save you time. Elevate your strategy by integrating our AI-driven insights and discover your edge at EzAlgo today.


%201.svg)