


So, you're thinking about swing trading. The core idea is simple: you’re aiming to catch a predictable “swing” in a stock's price, holding the position for a few days to a few weeks. It’s not about the frantic, minute-by-minute action of day trading. Instead, it’s about patience and spotting bigger, more established market moves.
This style of trading is a great fit if you have a busy life but still want to be active in the markets. It gives you room to breathe and make decisions without being glued to a screen all day.
Swing trading really carves out its own space between the high-speed world of day trading and the slow-and-steady approach of long-term investing. The goal is to lock in profits from a single, defined price movement, whether that's a trend going up or down. You’re not trying to scalp tiny profits all day long. You’re looking for a more substantial piece of a move that takes a bit longer to unfold.
I like to think of it like surfing. The day trader is close to the shore, trying to catch dozens of small, choppy waves. The long-term investor is way out at sea, just floating and waiting for the entire tide to rise over months or years. But the swing trader? They're the one patiently waiting for that perfect, well-formed wave, riding it for all its worth, and then paddling back out to find the next one. It’s a perfect blend of sharp analysis and a more relaxed time commitment.
To succeed here, you need less in the way of lightning-fast reflexes and more of a strategic, methodical mindset. It’s all about identifying a solid opportunity, mapping out a clear plan with entry and exit points, and then having the discipline to let the trade do its thing.
Controlling your emotions is everything. You have to trust your plan and stick to your rules, especially when the market gets a little turbulent and tries to psych you out.
Here are the traits I see in every successful swing trader I know:
And this isn't just theory; the data backs it up. Systematic swing trading strategies on large-cap U.S. stocks have been shown to hit win rates around 65%, with an average trade lasting about 30 days. Even on smaller indexes, the win rates are often near 60%. If you're a numbers person, you can explore more about these statistical findings on trading performance to see how data supports this approach.
The core difference lies in intent. An investor buys a piece of a business, hoping for long-term growth. A swing trader buys a chart pattern, aiming to capitalize on short-term momentum before moving on.
Figuring out if swing trading is the right fit for you usually means comparing it to other popular methods. Each style requires a different amount of your time, a different appetite for risk, and a different kind of mental game.
To help you see where swing trading fits in, here’s a quick comparison.
This table breaks down the key differences between the three main approaches to the market.
Ultimately, choosing your style comes down to your personality and lifestyle. Swing trading strikes a fantastic balance—it offers more action than long-term investing but with far less stress and time commitment than day trading. For many traders, that's the sweet spot.
Any successful swing trader will tell you that the right tools are crucial. But don't mistake that for needing a Wall Street-style command center with a dozen monitors. In my experience, a clean, effective, and simple trading setup is far more powerful. Your toolkit should support your decisions, not make them more complicated.
This all starts with picking the right platform.
Think of your brokerage as your partner in this venture. When you're weighing your options, there are a few things that are non-negotiable for swing trading:
Once you've got your brokerage sorted, it's time to build your analytical workspace. Many traders, myself included, use a platform like TradingView for its powerful and user-friendly charting. The goal here is simplicity.
It's a classic rookie mistake to clutter a chart with dozens of indicators. This leads to "analysis paralysis," where you're so overwhelmed by conflicting signals that you can't make a decision. A clean chart helps you focus on what matters most: price action.
Here’s a great example of a clean chart setup. It’s intentionally minimal, featuring the stock, volume, and just two key moving averages. This lets the price movement tell the story.
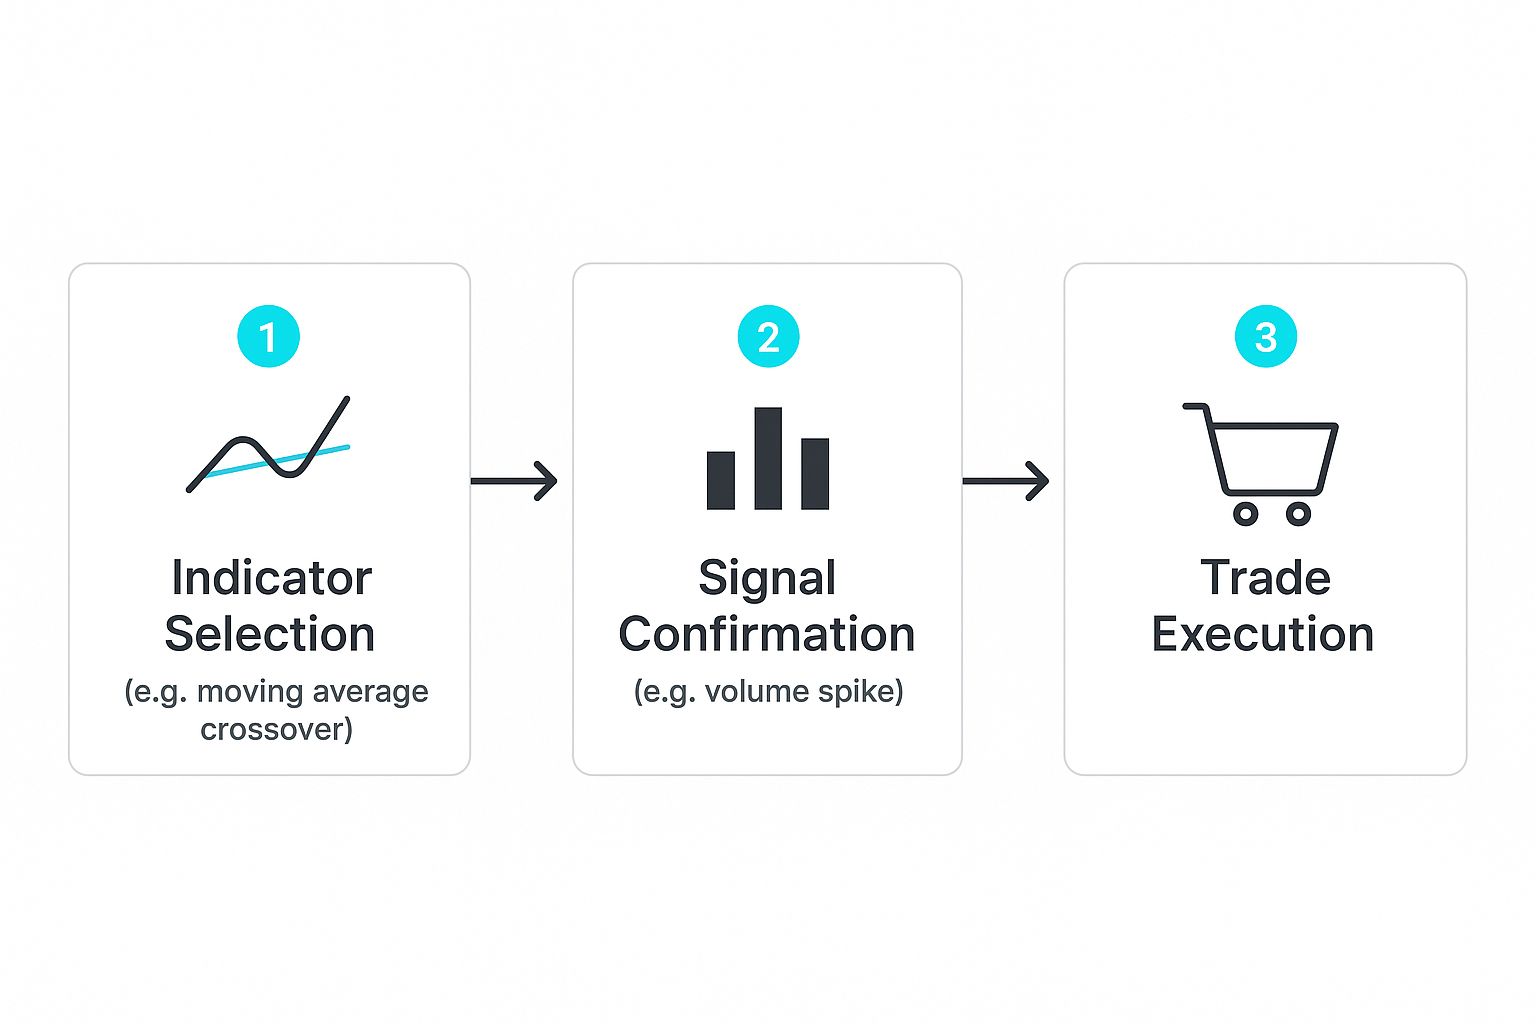
To get started, we're only going to add three indicators to our chart. These are popular for a reason—they give you high-value information about trend and momentum without creating a ton of noise.
1. The 50-Period Simple Moving Average (50 SMA)
I like to think of this as the medium-term trend guide. It calculates the average closing price over the last 50 periods (for swing traders, that's usually 50 days). If the price is consistently trading above the 50 SMA, it's a good sign of a healthy uptrend. If it's below, the bears are likely in control. A common entry strategy is to watch for the price to pull back to and "bounce" off this line.
2. The 200-Period Simple Moving Average (200 SMA)
This one's the big picture. The 200 SMA shows the long-term trend by averaging the price over the last 200 days. Big money—institutional investors and funds—pays close attention to this level. A stock trading above its 200 SMA is generally considered to be in a major uptrend. The distance between the 50 SMA and the 200 SMA can also give you a hint about how strong the trend is.
3. The Relative Strength Index (RSI)
While moving averages track the trend, the RSI measures the speed and change of price movements. In other words, it measures momentum. The RSI value moves between 0 and 100.
A key takeaway: The RSI doesn't tell you if a trend is up or down; it tells you how strong that trend is. It's fantastic for spotting when a stock might be "overbought" (usually a reading above 70) or "oversold" (below 30), which can signal a potential pullback or bounce.
By combining these three simple tools, you can build a surprisingly robust view of any stock. You get a read on the medium-term trend, the long-term trend, and the underlying momentum. This minimalist toolkit is all you need to start finding high-quality setups.
If you're looking for more ways to combine these tools, check out our guide on swing trading strategies for beginners for more patterns and practical examples. Sticking to this foundation helps you avoid getting lost in complexity and keeps your focus where it belongs: on price and momentum.

At its core, swing trading is all about capturing a single, solid move within a bigger trend. Think of an uptrend not as a straight line up, but as a series of zig-zags—a push higher, a slight pullback, and then another push higher. Our job is to find those sweet spots where a pullback looks like it’s losing steam and the next leg up is about to begin.
First things first: you have to identify the main trend on the daily chart. Is the stock making higher highs and higher lows? Or is it carving out lower highs and lower lows? This gives you your directional bias. Whatever you do, don't fight the prevailing trend. Swimming against the current is one of the fastest ways to drain your trading account.
Once you know which way the wind is blowing, you’re looking for a pullback to an area of value. This is where those moving averages you set up become incredibly useful.
Your goal here is to be patient. Wait for the price to actually come back and "test" one of these key levels. Don’t just jump in because it’s getting close. You need to see proof that buyers are defending that level. This is where we bring in our other tools to get a clearer picture.
A good potential setup becomes a great one when multiple signals align. This concept, known as confluence, is the bedrock of building a high-probability case for any trade. You’re essentially looking for several different indicators to all point in the same direction.
For instance, imagine a stock in a solid uptrend pulls back to its 50 SMA. That’s our first clue. But then, we glance at the Relative Strength Index (RSI). Just as the price touches that moving average, we see the RSI dipping toward the 30 level, signaling that the stock is becoming "oversold." Now that's a powerful combination. It suggests the pullback is running out of gas right at a logical place for it to find support.
Let’s look at a real-world example. During the wild market swings from 2020 to 2023, the S&P 500 gave us some textbook swing trading opportunities. After hitting a low of 2,237.40 on March 23, 2020, it kicked off a massive uptrend. A trader using these exact principles would have noticed how the index consistently found support at its 50-day moving average on its journey to an all-time high of 4,796.56 in January 2022. Every single pullback to that moving average was a high-probability entry for those who waited patiently. You can even read more about this historical market behavior to see how these patterns play out on a large scale.
The best trades often feel obvious in hindsight. They happen when the trend, a key support level, and momentum indicators all line up. Your job isn't to force a trade into existence, but to wait for these clear signals to appear.
Here’s something a lot of new traders miss: no stock trades in a vacuum. It’s absolutely critical to get a read on the overall market sentiment, which you can do by looking at major indexes like the S&P 500 (SPY) or the Nasdaq 100 (QQQ). If the whole market is tanking, trying to swing trade a stock to the long side is like swimming upstream. It's incredibly difficult, even if the individual chart looks perfect.
Before you ever place a trade, run through this quick mental checklist:
Think of this as your final filter. It helps you sidestep taking good-looking setups in a hostile market, which dramatically improves your odds. A great setup in a terrible market is still a bad trade.
Let's talk about what truly separates a professional trader from a hopeful gambler: a documented, non-negotiable set of rules. Think of your trading plan as a personal constitution. It's the one thing designed to keep you objective and disciplined when emotions like greed and fear inevitably show up to hijack your decision-making.
Without a plan, you're essentially driving blindfolded. You'll make impulsive choices that, let’s be honest, rarely end well. This plan is your business plan. It dictates exactly what must happen for you to risk your hard-earned capital and, just as importantly, how you'll get out of every single trade—win or lose. It's the boring but essential work that underpins all long-term success in the markets.
Before you can even think about profits, you have to define what a "good" trade even looks like to you. This isn't about vague ideas like "the stock looks like it's going up." That's not a strategy; it's a guess. You need a specific, repeatable checklist of conditions that must be met before you enter a position.
Your entry rules should be so clear that you could hand them to a friend, and they could spot the exact same setups on a chart. For someone just learning how to swing trade, a simple but powerful checklist might look like this:
Only when all four of these conditions are met would you even consider entering a trade. This systematic approach is your filter. It weeds out the junk and forces you to wait patiently for high-probability opportunities.
Here's a piece of wisdom that takes most traders too long to learn: knowing when to get out is far more important than knowing when to get in. Your exit strategy needs to cover both scenarios—when you're right and when you're wrong. And this isn't something you figure out on the fly; it must be defined before you place the trade.
A classic rookie mistake is holding onto losers too long, praying they'll turn around, while cutting winners short for a tiny profit. A rule-based exit plan is the only way to prevent this self-sabotage.
Your exit plan has two non-negotiable parts: your stop-loss and your profit target.
1. The Stop-Loss: Your Safety Net
A stop-loss order is a pre-set order that automatically sells your position if the price hits a specific level. It's your ultimate capital protection. Period. For every single trade, you must know exactly where your stop-loss will be. A logical spot is just below the key structure you're trading from.
Using our earlier example, if you entered a trade based on that bounce from the 50-day moving average, a smart stop-loss would be just below the low of that confirmation candle. This defines your risk. If the price hits that level, your trade idea was wrong. You exit with a small, manageable loss and live to trade another day.
2. The Profit Target: Your Reward
Your profit target should always be based on a risk-to-reward ratio. This simple calculation compares how much you're risking (the distance from your entry to your stop-loss) to the potential profit you're aiming for. A common and healthy goal for swing traders is a 2:1 risk-to-reward ratio.
This means for every $1 you risk, you're aiming to make at least $2. For example, if your stop-loss is set $2 per share below your entry price, your first profit target should be at least $4 per share above your entry. This structure ensures your winning trades are significantly larger than your losing ones, which means you don't even have to be right 50% of the time to be a profitable trader.
If there's only one thing you take away from this guide, let it be this: staying in the game is all about protecting your capital. Forget the home-run trades and secret indicators. The real key to long-term success is obsessive, disciplined risk management.
Many new traders get fixated on the wrong question. They're constantly asking, "How much money can I make on this trade?" An experienced trader flips that script completely. Their first question is always, "How much could I possibly lose, and how do I ensure that loss is completely insignificant?" This mindset shift is the single most important step you can take.
The most critical tool in your risk management toolbox is position sizing. It’s simply a method for deciding how many shares to buy for any given trade. Get this right, and no single loss can ever knock you out of the game.
The bedrock principle here is the 1% rule. I consider this non-negotiable, and so do countless other professional traders. All it means is that you should never, ever risk more than 1% of your total trading capital on a single trade.
Let that sink in. With a $10,000 account, your max risk on any one trade is $100. With a $50,000 account, it's $500. This rule forces you to prioritize capital preservation above all else.
This might sound too conservative, but it’s your best defense against the inevitable losing streak. If you lose five trades in a row—and trust me, you will—you’ve only drawn down 5% of your account. You can easily come back from that. But risk 10% per trade, and those same five losses wipe out half your capital. That's a devastating blow, both financially and psychologically.
Figuring out your position size with the 1% rule is straightforward. You just need three pieces of information: your total account size, your entry price, and your stop-loss price.
Here's the simple math:
Let's walk through a real-world example. Say you have a $20,000 account. Your maximum risk per trade is $200 (1% of $20,000). You spot a nice setup in stock XYZ, with a planned entry at $50 and a stop-loss at $48. Your risk per share is $2.
You would buy exactly 100 shares. If the trade goes against you and hits your stop, you lose $200—precisely 1% of your account. This systematic approach keeps your risk consistent trade after trade, no matter the stock's price. For a deeper look, check out our guide on risk management for traders for more advanced techniques.
To show how this works with different stock prices, here’s a quick table. It shows how your share count changes to keep your dollar risk locked at $100 (or 1% of a $10,000 account).
Notice how the more risk there is per share, the fewer shares you buy. This ensures that a losing trade always results in the same manageable $100 loss.
The key takeaway here is that you figure out your risk before you ever click the buy button. Execution is the last step, not the first.
Solid risk management isn't just about math; it's about managing your own head. A few losses in a row can easily send you into a spiral of "revenge trading," where you start making impulsive, oversized bets to try and win your money back fast.
That's a surefire way to blow up an account.
Sticking religiously to the 1% rule is your psychological shield. When each loss is small and, more importantly, planned for, it doesn't trigger the same kind of emotional panic. It lets you stay objective, follow your system, and patiently wait for the next quality setup, knowing you have plenty of capital left to trade another day.
Diving into the world of swing trading is exciting, but let's be honest, it also comes with a lot of questions. It's totally normal. Let's walk through some of the most common things new traders ask so you can get started with more confidence.
A huge one is always about timing the market. The truth is, nobody can perfectly time the top or bottom. But swing trading isn't about perfection; it's about probability. A classic strategy is to look for entry points after a significant price correction. This isn't just a hunch—it’s backed by decades of data.
Looking at the S&P 500 since 1980, for example, buying after a drop of around 5% from a recent high has historically resulted in a median gain of about 6% over the next three months. The probability of seeing a positive return in that scenario? A whopping 84%. The data also shows that the average recovery time from a 5-10% dip is about three months. The big takeaway here is a core principle of successful swing trading: patience. You can actually explore more S&P 500 swing trading signal data to see just how powerful data-driven discipline can be.
This is probably the question I hear most, and the answer isn't a magic number. It's really about having enough capital to manage risk properly with the 1% rule. While many traders get their start with a few thousand dollars, the exact amount isn't the point.
The real key is making sure that 1% of your account—your maximum risk on a single trade—is a meaningful dollar amount but not so tiny that commissions wipe it out. If your account is too small, it's tough to make this work. A fantastic alternative I always suggest is starting with paper trading. A simulated account lets you practice your strategy and get the hang of your platform without putting a single real dollar on the line.
I always tell new traders to spend at least a month paper trading. Think of it as a flight simulator. You want to learn the controls and handle some turbulence before you're flying with real passengers (your money).
For swing traders, the daily chart is your bread and butter. It gives you the big-picture view you need to identify the primary trend and major support or resistance levels. This is where you'll hunt for your main setups.
That said, most experienced traders use a multi-timeframe approach to really dial in their trades. Here's a simple, effective way to do it:
I like to think of it this way: the daily chart is your road trip map, and the 1-hour chart is the detailed street view that helps you find the exact address.
When you’re just starting out, less is definitely more. A classic rookie mistake is trying to follow dozens of stocks at once. It’s a fast track to analysis paralysis, and you end up missing good opportunities because you’re spread too thin.
Instead, build a small, focused watchlist of 5-10 stocks. I recommend picking companies or sectors you’re already a bit familiar with. This lets you get to know their unique “personalities”—how they react to news, their typical volatility, and how they behave around key technical levels. By focusing your attention, you'll start spotting patterns you'd otherwise miss. In swing trading, quality of analysis always beats quantity of stocks.
Ready to stop guessing and start trading with data-driven confidence? EzAlgo provides the AI-powered signals and automated analysis you need to find high-probability setups without the headache. Eliminate emotional decisions and gain a technical edge with our suite of premium TradingView indicators. Start your journey with EzAlgo today!


%201.svg)