


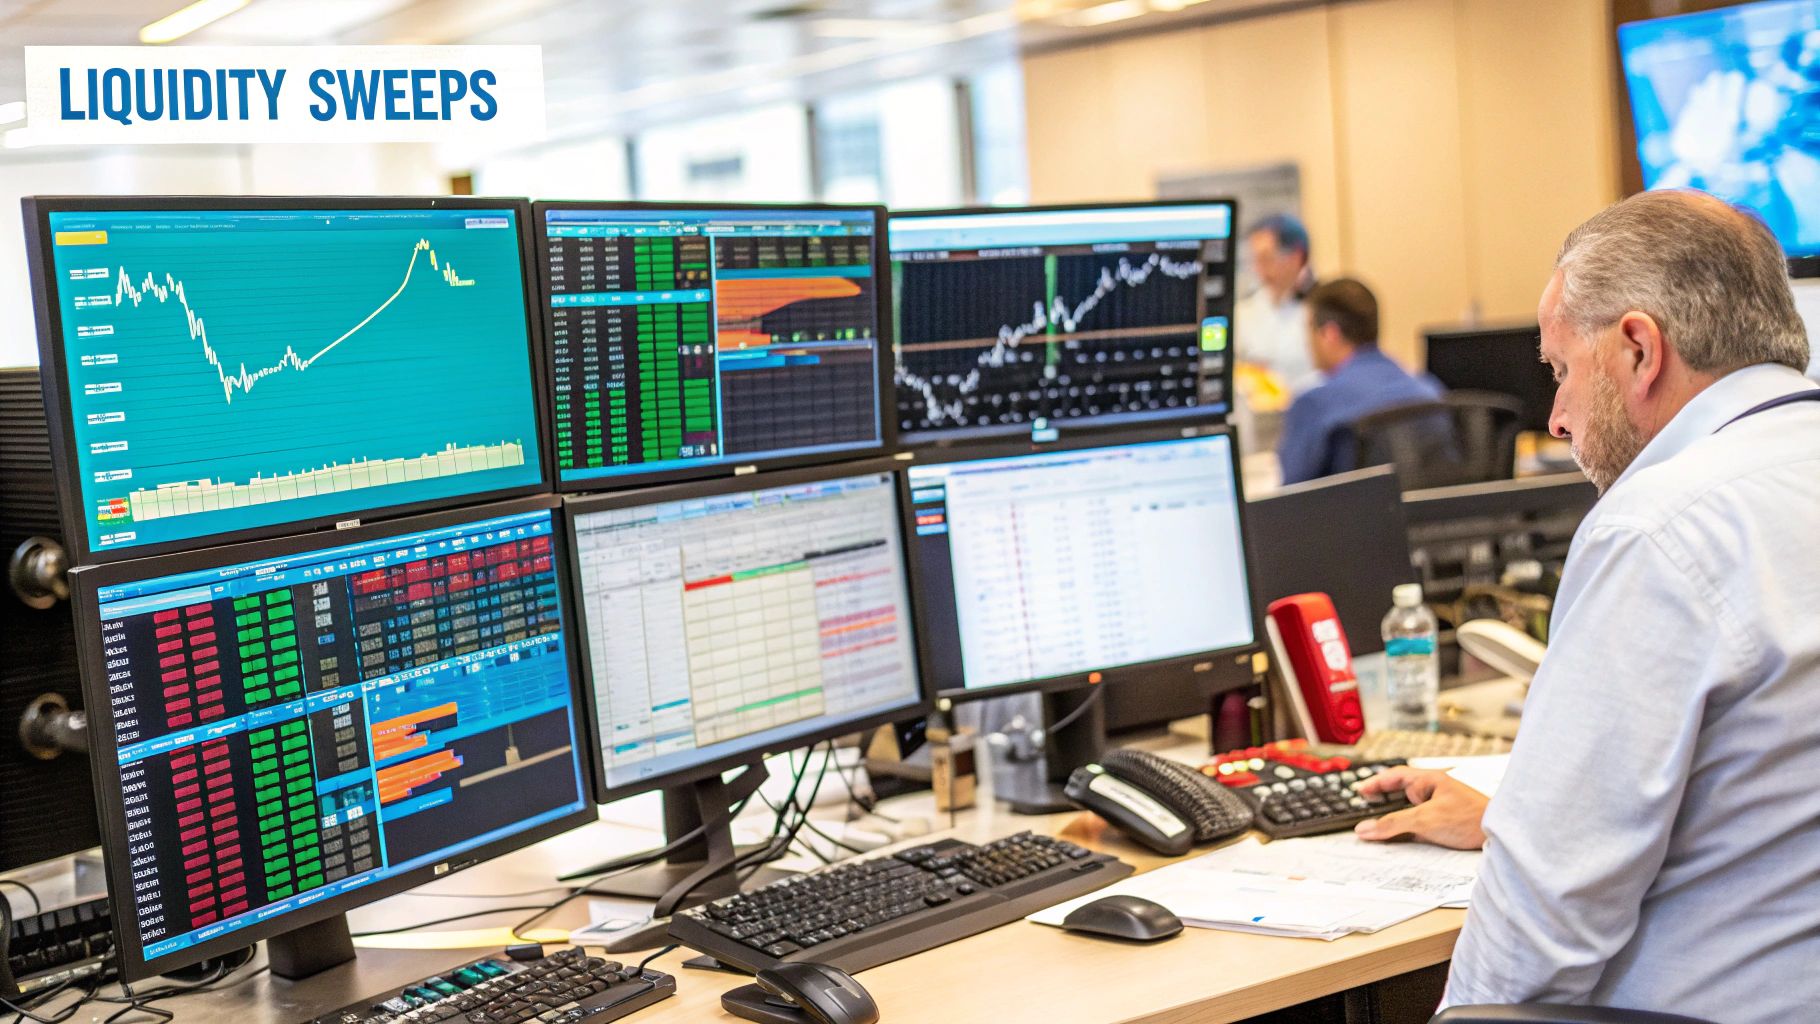
So, what exactly is a liquidity sweep?
In simple terms, it’s a deliberate move by the market to push past a very obvious high or low. The goal is to trigger a whole bunch of orders—mostly stop-losses—that are sitting there, and then quickly whip back in the other direction.
Think of it as smart money engineering a quick "grab" of available orders. This allows them to fill their massive positions without causing the price to run away from them, and it often catches less experienced traders on the wrong side of the move.
Let's break this down with a practical analogy. Picture a large institution—what we call "smart money"—as a giant cargo ship. That ship can't just pull into any tiny dock; it needs a deep harbor to operate.
In the market, these big players can't just buy or sell huge amounts of an asset whenever they want. If they did, their own buying or selling pressure would push the price against them before they could get their full order filled. So, they have to be sneaky. They look for "deep harbors"—areas packed with existing orders.
So where are these deep pockets of liquidity? Usually, they're right where you'd expect them to be, thanks to common trading strategies. Most retail traders learn to place their protective stop-loss orders just above a recent high (if they're shorting) or just below a recent low (if they're buying).
These clusters of stop-losses essentially create a "pool" of liquidity, acting like a magnet for institutional players who need to fill their large orders.
A liquidity sweep is a targeted price move designed to dip into these pools. The market will temporarily break past a key high or low, trigger all the resting orders, and then sharply reverse. The purpose is to allow "smart money" to accumulate their positions by taking the other side of all those triggered stop-losses. For a deeper dive into these mechanics, you can find great info over at Maverick Currencies.
This isn't just random market noise. When you see the price spike above a clean resistance level, trip all the buy-stop orders sitting there, and then immediately tank—that’s a calculated move. It’s a sweep designed to absorb liquidity before the real move begins.
To really get it, let's break down the cast of characters and the sequence of events. The table below shows who is involved, what their motivations are, and what the final result looks like.
In short, a sweep is a classic case of the market faking a move in one direction to gather fuel for a strong move in the other. Once you learn to spot them, you start to see the market in a completely new light.

To really get what a liquidity sweep is, you have to stop thinking like a retail trader and start thinking like a major institution. These big players aren't just dabbling; they're moving massive amounts of capital. They can't just click "buy" or "sell" without a plan, because their sheer size would send prices flying against them.
Think about it. If a hedge fund needs to buy a huge position, dropping a single, giant order onto the market would instantly signal their intent. Demand would surge, the price would shoot up, and they'd get a terrible entry. This is called slippage, and it’s a profit killer.
So, they have to get clever. Instead of creating new demand, they hunt for existing pockets of sell orders. And where’s the most predictable place to find a ton of sell orders? Right below recent swing lows, where countless traders have neatly stacked their stop-losses.
It’s a calculated, almost surgical process. "Smart money" spots these pools of liquidity and deliberately pushes the price down to trigger them. As soon as the price dips below that critical low, it trips a wire, setting off a chain reaction of automated sell-stop orders.
Suddenly, the market is flooded with sellers. This wave of selling is exactly what the institution was waiting for. They can now step in and soak up all those sell orders, filling their own huge buy position without causing a fuss and at a great price.
This isn't random manipulation—it’s a core function of the market. It’s how the biggest players get their business done. When you see sweeps as a necessary mechanism, you can start reading the clues they leave about where the big money is moving.
You see this constantly in the forex market, where over $7 trillion changes hands daily. A liquidity sweep might nudge a pair like EUR/USD just a few pips past a recent high, grabbing all the stop-loss orders resting there before sharply reversing. These maneuvers are essential for institutional execution. You can find more detail on how this works across different markets in this in-depth glossary from Quadcode.
Once this clicks, the way you see the charts will change forever. A sharp, violent spike below a key low is no longer just a scary, random event. You’ll see it for what it really is: a hunt for liquidity. This shift in perspective is a game-changer for a few reasons:
Ultimately, liquidity sweeps aren't something to be afraid of. They are the engine of the market, providing the fuel needed for major moves and leaving a trail of breadcrumbs for any trader who knows how to follow them.

Alright, let's move from the "what" to the "how." Spotting a liquidity sweep in the heat of the moment is a skill, and like any skill, it gets easier with practice. You're essentially looking for a very specific footprint on your chart.
The classic signature is a sudden, aggressive price stab through an obvious high or low, followed almost immediately by a sharp U-turn. It’s a move that feels designed to fake everyone out, making them pile into a breakout that never actually happens.
The biggest giveaway? The candlestick itself. A sweep usually leaves behind a candle with a long, lonely wick poking past that key price level. That wick is the crime scene evidence—it tells you price went there just long enough to grab all the orders before getting shoved back in the other direction. A real breakout, on the other hand, closes with conviction and keeps going.
To get good at this, you can't just look for one long wick. You need to read the whole story the chart is telling you. Piecing together a few clues is what turns a wild guess into a smart, high-probability trade.
Here's a simple, repeatable process to help you see them coming.
1. Find the Honey Pot: First things first, you need a pool of liquidity. Scan your chart for clean, obvious swing highs or lows. If a level sticks out to you, it sticks out to everyone else, too. That's where the orders are building up, making it a magnet for price.
2. Watch for the Raid: The sweep itself is almost always fast and furious. It’s a quick, violent thrust that smashes through the level you just identified. This is the moment of chaos where breakout traders jump in headfirst and stop-losses get wiped out.
3. Look for the Swift Rejection: This is the most important part. After breaking the level, price fails to stay there. It gets rejected and snaps back inside the previous trading range. A candle that stabs below a key low and then closes as a big, strong bullish bar is a massive tell. If you want to get better at reading these clues, it’s worth understanding candlestick patterns and what they signal.
4. Check the Volume (Optional but recommended): If you can, glance at your volume indicator. You'll often see a big spike right when the sweep happens. That spike is the sound of all those stop-losses and breakout orders getting triggered—it's the liquidity a "smart money" trader was hunting for.
The anatomy of a classic sweep is simple: an attack on a well-defined price level, a flurry of triggered orders, and a sharp reversal. When price stabs a high and is immediately rejected, it signals that sellers have overwhelmed the buyers who chased the breakout. This rejection is your primary clue.
By training your eyes to spot this "pool, push, and rejection" sequence, you’ll start to see these setups everywhere. In crypto, you might see the previous day’s low get swept before a massive rally kicks off. In forex, a sweep above the London session high can often mark the turning point for the day. This pattern isn't random; it repeats across all markets because it's built on the fundamental mechanics of how markets truly work.
A liquidity sweep isn't just a random blip on your chart. Think of it as a major clue, a signal that control might be shifting from the retail crowd over to the institutional players. When you learn to connect these sweeps to the bigger picture of market structure, you start seeing major trend changes before they become obvious to everyone else.
This is where you go from just spotting a pattern to truly understanding the story the market is telling. The key insight is simple but powerful: a sweep isn't the end of the move; it's often the beginning of a potential reversal. The real confirmation comes from what happens right after.
I like to think of this as a two-step validation process. The sweep is your initial heads-up, but the "shift" in market structure that follows is the high-probability confirmation you need to actually take action. This gives you a clear, repeatable framework for making sense of these powerful moves.
Here’s how it works in practice:
Bullish Scenario (End of a Downtrend): First, you'll see the price take a nosedive, pushing aggressively below a clear swing low. That's your liquidity sweep. But instead of continuing to fall, the price reverses with conviction and breaks above a previous swing high. This one-two punch is a strong signal that the downtrend is likely running out of steam.
Bearish Scenario (End of an Uptrend): In the opposite situation, the price might spike above a clean swing high, grabbing all that buy-side liquidity. Then, it reverses hard and breaks below a recent swing low. This tells you that sellers have stepped in with force and a downtrend could be starting.
By waiting for both the sweep and the market structure shift, you filter out a lot of noise. You're no longer chasing every little fake-out and can focus on moves that have real institutional weight behind them.
A sweep of a key level shows intent, but the break of market structure confirms it. This two-part sequence is what turns a liquidity sweep from a neat observation into an actionable trading signal. It tells you the market isn't just grabbing liquidity; it's using that fuel to start a new journey.
The infographic below breaks down some of the key risks you need to keep in mind when building out your own framework.
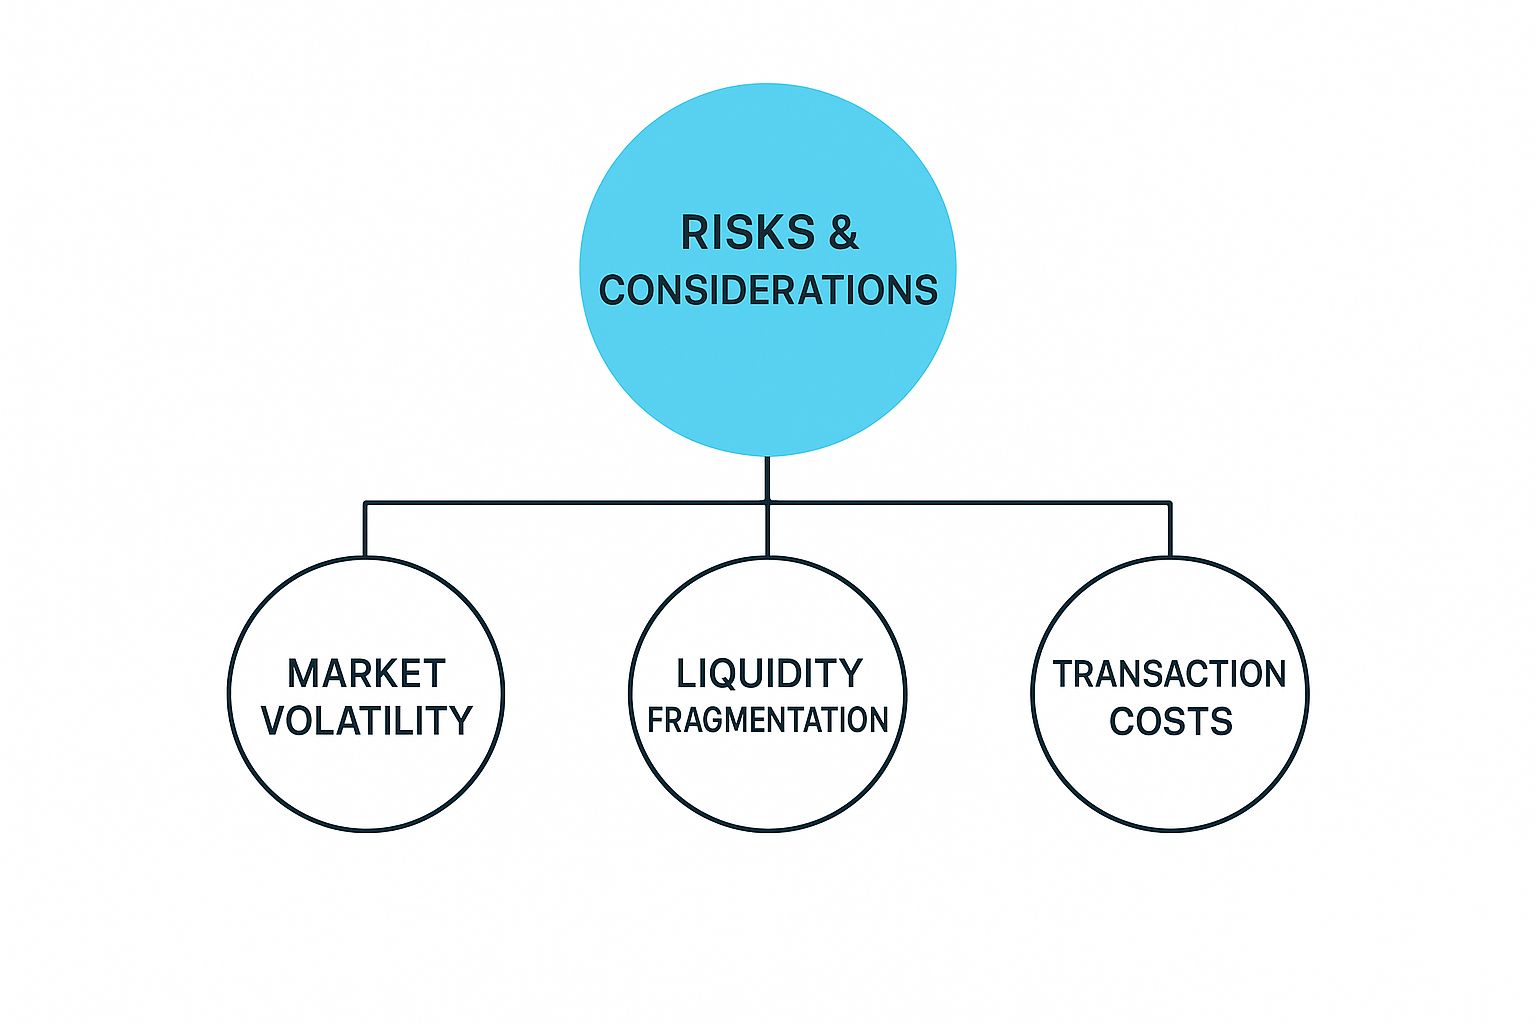
As the visual points out, while sweeps create fantastic opportunities, you can't ignore things like market volatility, fragmented liquidity, and transaction costs. These factors can eat into your profits and affect how reliable your strategy is, which really drives home the need for solid risk management. Using a model like the 'Sweep and Shift' helps you manage these risks by demanding stronger confirmation before you put your capital on the line.
It’s one thing to understand the theory behind a liquidity sweep, but knowing how to turn that concept into a profitable trading strategy is where the rubber really meets the road. Instead of getting run over by a sweep, you can learn to ride the powerful momentum it creates. A clear, repeatable entry model is your key to capitalizing on these moments.
The core idea is simple, but it demands patience. You're not trying to guess where the market is going; you're waiting for it to show its hand and then acting on the confirmation. The goal is to align your trade with the big money—the institutional flow—that the sweep just revealed.
Here’s a straightforward, three-step process for trading a liquidity sweep. Think of this as a checklist to keep your emotions in check and focus only on what the price is actually doing.
Wait for the Sweep: This is the hardest part because it requires doing nothing. First, spot an obvious liquidity pool—a clear swing high or low is perfect. Then, you have to sit on your hands and wait for the price to smash right through it. Don't try to front-run the move. Let it happen.
Look for Reversal Confirmation: After the price raids that liquidity, you need to see a strong sign of rejection. Often, this looks like a candle with a long, angry wick that stabs past the level but then closes back inside the old range. An even stronger sign is a big bullish or bearish engulfing candle right after the sweep. That’s a massive clue.
Execute the Trade with Proper Risk: Once you have that confirmation, you’re cleared to enter a trade in the direction of the reversal. Your stop-loss should go just beyond the tip of that long wick from the sweep candle. This placement gives your trade breathing room and protects you if the price makes one last attempt to test the extreme.
This chart shows how the EzAlgo indicator can pinpoint a key liquidity zone and then signal a reversal right after the sweep, taking a lot of the heavy lifting out of the identification process.
By automating the detection of these zones and patterns, tools like EzAlgo let you focus on executing the trade, not spending hours hunting for the setup.
The real secret is this: trade the reaction to the sweep, not the sweep itself. That initial price stab is the trap. The reversal that comes next is the real move—the signal that the big players have stepped in and taken control.
Let's be honest: manually tracking liquidity pools, watching for the sweep, and waiting for confirmation on multiple charts can be exhausting. This is where modern trading tools give you a serious edge. The EzAlgo suite, for example, is built to automatically highlight these critical areas right on your chart.
Our indicators can flag high-liquidity levels—like previous session highs and lows—and send signals when a sweep-and-reversal pattern takes shape. This automation makes the entire process faster and helps you spot these setups with much more confidence.
This approach fits beautifully into other powerful trading concepts. If you want to go deeper, you can master a supply and demand trading strategy, which is the perfect complement to sweep analysis. When you combine a solid manual strategy with the right tools, you build a truly robust system for navigating the markets.
Knowing what a liquidity sweep is means you also have to be crystal clear on what it isn't. It’s easy to get this wrong, and traders often make costly mistakes by misreading the price action. Let's clear up a few common mix-ups before you even think about building a strategy around sweeps.
The biggest mistake I see? Confusing a liquidity sweep with a real-deal breakout. A breakout has legs—it shows sustained momentum, with candles closing decisively past a key level. A sweep is the polar opposite. Think of it as a quick, aggressive jab that’s immediately pulled back, leading to a sharp reversal.
Another trap is thinking every long wick you spot on a chart is a sweep. That's just not the case. For a wick to mean something, it needs to be taking out an obvious pool of liquidity, like a clean swing high or swing low everyone is watching. A random long wick stuck in the middle of a choppy, undefined range? That’s usually just market noise, not a calculated move by big players.
Lots of traders get frustrated and call sweeps "unfair" or "manipulation." A much healthier way to look at it is to see them as a totally normal and necessary part of how markets work.
Flipping that mental switch is a game-changer. Instead of feeling like the market is out to get you, you can start to anticipate these moves. When you see sweeps as predictable events, you can turn them into opportunities. It stops being about manipulation and starts being about understanding the game you're in and playing it with more skill.
To wrap this up, let's tackle a few common questions that pop up when traders first start learning about this concept. Getting these details straight will help you see sweeps more clearly in the real world.
You'll often hear these terms used as if they mean the same thing, but there's a small, important difference.
A stop hunt, as the name implies, is a very specific move where the market is going after a cluster of stop-loss orders. A liquidity sweep is a bit bigger in scope. Think of it as the market grabbing all the orders sitting at a certain price level—not just the stop-losses, but also any pending breakout orders or even large limit orders.
So, while every stop hunt is technically a type of liquidity sweep, a sweep itself is about absorbing all the available liquidity, not just one kind of order.
Nope. Liquidity sweeps happen on every single timeframe you can imagine.
This is because the hunt for liquidity is a core part of how markets move. It's a fractal pattern, meaning you'll see it on a 1-minute chart just as you will on a weekly chart. The underlying principle never changes.
Of course, the impact is different. A sweep on a 5-minute chart might just create a quick scalp opportunity. But a sweep of a major weekly low? That could be the start of a trend reversal that plays out over months.
The big idea here is that the market's hunger for liquidity is constant. Once you grasp that, you can spot these patterns whether you're a day trader watching the minutes tick by or a long-term investor planning for the months ahead.
This is the million-dollar question. The best way to avoid getting run over is to change your mindset. Instead of playing defense, start playing offense.
First, the simple stuff: stop putting your stop-loss in the most obvious place everyone else does—right below that perfect-looking low or just above that clean high. Give your trade some room to breathe.
But here’s the more powerful approach: stop trying to get in before the sweep happens. Let the market make its move first. Wait for the sweep, watch the price action, and then trade in the direction of the powerful momentum that follows. This way, you’re trading with the big players, not just hoping they don't notice your stop.
Ready to spot these high-probability setups with more confidence? The EzAlgo indicator suite is built to automatically pinpoint key liquidity zones and signal potential reversals, helping you trade alongside the smart money. Discover how EzAlgo can sharpen your trading edge.


%201.svg)