


At its core, a VWAP trading strategy is all about using the Volume Weighted Average Price to figure out what a stock's 'true' average price is for the day. Think of it as a dynamic benchmark.
Traders watch this line closely to get a read on market sentiment. If the price is consistently trading above the VWAP, it's a good sign that bulls are in charge. If it's trading below, bears have the upper hand. This insight helps you make much smarter calls on when to get in and out of a trade, especially since it often points to where the big institutional money is active.
Let's break this down with a quick example. Say two traders buy the same stock at $100. The first trader buys 10 shares, while the second buys 1,000. A simple moving average would look at both trades as equal. VWAP is smarter. It knows that the second trade had a far bigger impact on the market.
By weaving volume into the calculation, VWAP shows you the price level where the most money actually changed hands. This gives you a much clearer picture of what the asset's fair value is for that specific day.
This is exactly why the big institutions live and die by it. When a hedge fund or a large bank needs to move millions of shares, their goal is to get their orders filled as close to the VWAP as possible. It helps them avoid sending the price into a tailspin and ensures they're buying or selling around the market's accepted price for the day.
For a retail trader like you or me, this is a huge edge. We get a peek into where the "smart money" is positioning itself. The VWAP line naturally acts as a moving level of support or resistance throughout the day, which is a big departure from a Simple Moving Average (SMA) that just looks at price and often lags behind the action.
Here’s what really sets VWAP apart:
This isn't some newfangled idea. The first real VWAP algorithms popped up around 2002, built for institutions to execute massive orders without spooking the market. They'd break up a huge block trade into smaller pieces, timing them with volume patterns to stay under the radar and close to the VWAP. If you're curious, you can learn more about its development in institutional trading.
Understanding how the price interacts with the VWAP line is the key to building a solid VWAP trading strategy. Their relationship tells you a story about who's in control of the market.
When the price is consistently holding above the VWAP, it’s a powerful sign that buyers are in command and are perfectly happy to pay a premium. On the flip side, if the price can't seem to break above the VWAP and keeps getting pushed down, sellers are clearly dominating the session.
This simple observation is the bedrock of countless effective day trading plans. The VWAP is more than just a line on a chart—it’s a visual scorecard for the ongoing battle between buyers and sellers, weighted by the real money (volume) they're putting behind their moves.
Before you can start trading with VWAP, you first need to get it on your screen. Thankfully, adding it to your chart in TradingView is a breeze.
Just head up to the "Indicators" button at the top of your chart. A search window will pop up—simply type "VWAP" into it. You’ll want to select the built-in "Volume Weighted Average Price" from the list, and it will immediately appear on your chart.
Out of the box, you’ll see a single, plain line. That’s your default VWAP. To really make it a cornerstone of your strategy, you’ll want to tweak its appearance. Hover over the indicator's name on your chart, click the little gear icon for settings, and a customization panel will open.
This is where you can make the indicator your own. I like to change the main VWAP line to a bold, bright color—like a sharp yellow or clean white—so it really pops against my chart background. Bumping up the line thickness also helps you spot it in a heartbeat when the market is moving quickly.
You’ll also find the settings for the standard deviation bands here, which are crucial.
Pro Tip: Don't just stick with the default colors. Find a color scheme that clicks for you. A chart that's easy to read at a glance cuts down on hesitation and helps you make quicker, more confident decisions.
Most VWAP indicators include upper and lower bands, and they’re not just there for decoration. These are standard deviation bands, and they show you how much volatility there is around the main VWAP line. Think of them as a rubber band, showing how far the price has stretched from its average.
Here’s a simple way I look at them in my own trading:
These bands are the secret sauce for any mean reversion approach. A powerful move to one of the outer bands often means the price has moved too far, too fast, and is likely to snap back toward the main VWAP line. I recommend enabling them and setting them to a lighter shade of your main VWAP color. This adds a whole new layer of context to your chart without creating a mess.
Alright, your chart is set up and looking clean. Now for the fun part: turning that VWAP line into a real trading plan with hard-and-fast rules. A profitable VWAP trading strategy isn't about gut feelings; it's about having a clear, repeatable system for getting in and out of the market. We're going to focus on two of the most popular and effective approaches I've seen traders use: trend following and mean reversion.
Think of these strategies as your playbook. They give you a solid framework for making decisions, which is crucial for keeping emotions out of the driver's seat when the market gets choppy. Each one uses the VWAP in a slightly different way to pinpoint high-probability trade setups.
This flow chart gives a great visual overview of the decision-making process for a typical VWAP trade.
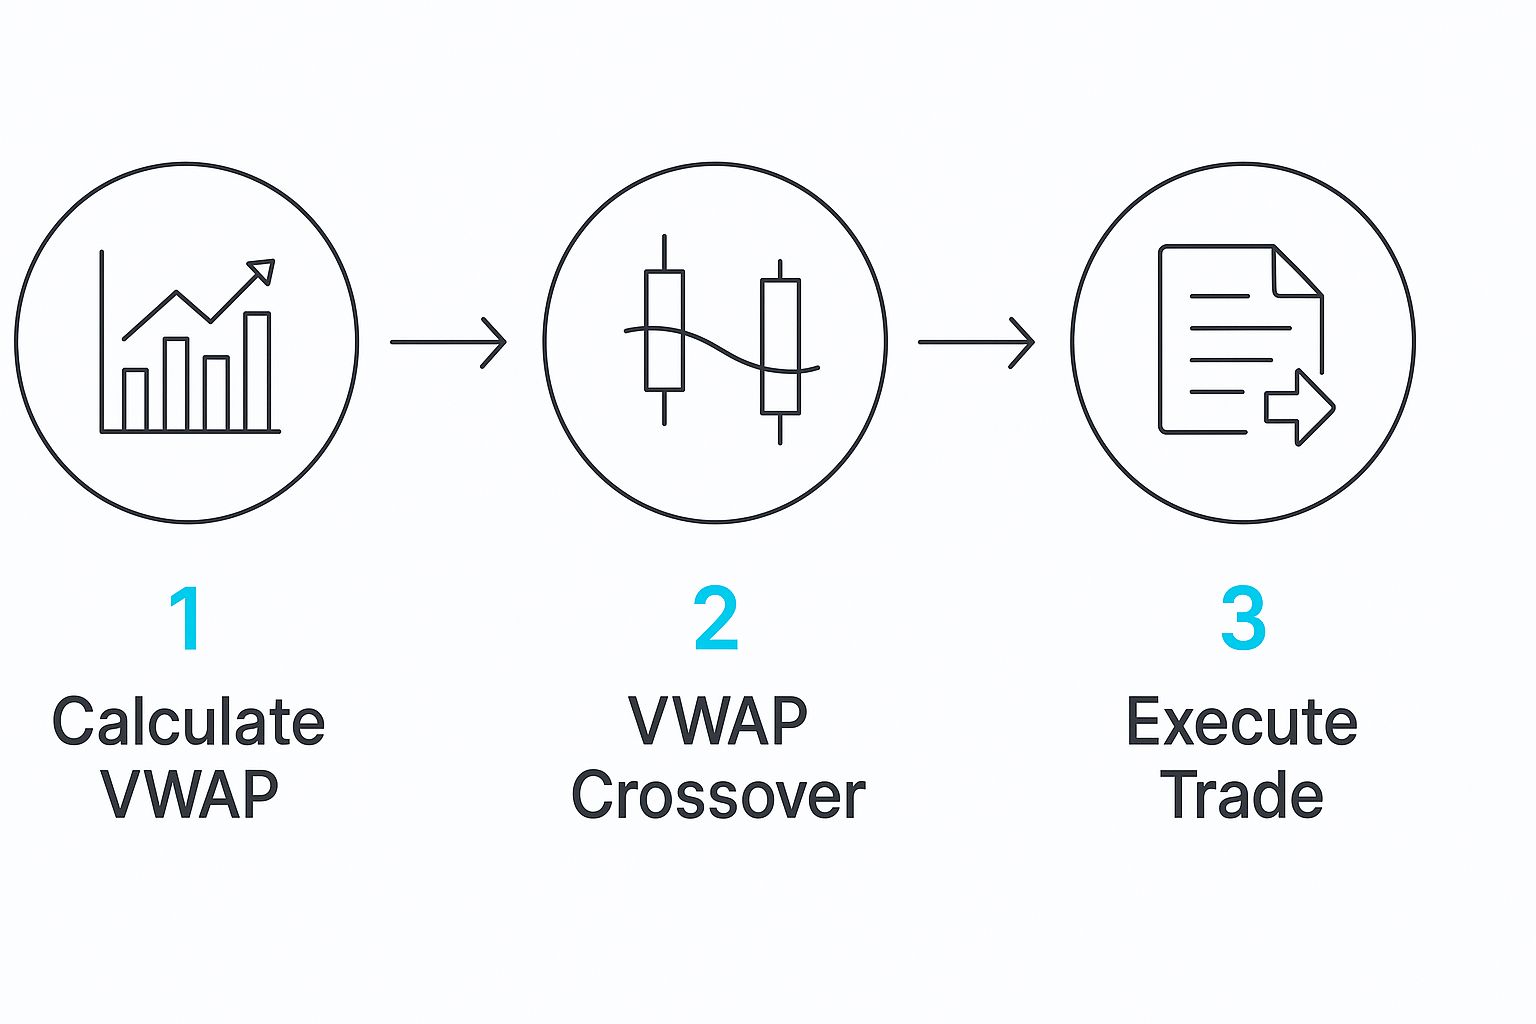
It breaks down the core steps, from the initial indicator calculation to spotting a crossover and, finally, pulling the trigger on the trade.
The most straightforward way to use the VWAP is also one of the most powerful: simply trade with the dominant intraday trend. The VWAP line becomes your north star, clearly showing you which side of the market—buyers or sellers—has the upper hand. The goal here is to catch strong momentum and ride it.
Here’s how you can build rules around a trend-following approach:
For a Bullish (Long) Entry: You're looking for the price to pop above the VWAP line. But don't just jump in. The key is to wait for a small pullback where the price successfully retests the VWAP as a new support level. That bounce is your confirmation that buyers are defending that average price, signaling the uptrend is legit.
For a Bearish (Short) Entry: It’s the exact opposite. Wait for the price to break below the VWAP. Then, watch for a retest where the VWAP now acts as resistance. When the price gets rejected at that level, it’s a strong sign that sellers are in control and the downtrend has legs.
Volume is your secret weapon here. A breakout or breakdown that happens on a big spike in volume adds a ton of credibility to your signal.
While trend following is about joining the party, mean reversion is about betting that the party is about to end. This strategy is built on the idea that prices, after stretching too far away from their average, have a natural tendency to snap back. This is where those standard deviation bands you added earlier become incredibly useful.
A mean reversion play using VWAP looks something like this:
For a Long Entry (Reversal): When the price takes a nosedive and tags or even breaks below the lower deviation band, it's a classic "oversold" signal. Your entry comes when you see buying interest start to pick up, pushing the price back up toward the main VWAP line.
For a Short Entry (Reversal): Conversely, if the price screams higher and hits or pokes through the upper deviation band, it’s considered "overbought." This presents a potential short opportunity where you're targeting a move back down to the VWAP.
This approach is all about patience. You're not chasing the move; you're waiting for it to run out of steam. The trick is to wait for the price to stop stretching away from the bands and show clear signs of turning back toward the middle.
No matter which path you take, you need a quick reference. This cheat sheet boils down the core rules for both strategies.
Keep this table handy as you start analyzing charts. It helps reinforce the core logic behind each setup so you can act decisively.
Remember, no trading system is foolproof. It is absolutely critical to test your rules against historical data to see how they would have actually performed in the past. To get started on that, you can check out our detailed guide on the fundamentals of trading strategy backtesting to learn how to validate your plan before putting any real money on the line.
Having a solid VWAP trading strategy is great, but it's only half the equation. The real secret to staying profitable long-term is knowing how to protect your capital when a trade goes against you. Good risk management keeps you in the game.
The VWAP indicator isn't just for finding entries; it's a dynamic guide for making smarter risk decisions. It gives you logical, data-driven levels to base your stops on, taking the emotional guesswork out of the equation.
Your stop-loss is your escape hatch, and the VWAP line itself can be the perfect "line in the sand." I like to think of it as the market's consensus on fair value for the session. If my trade is based on a price respecting that line, a clean break of it tells me my thesis is probably wrong.
Here’s how I apply this in real-time:
The standard deviation bands are also incredibly useful here. If you're playing a mean reversion trade and buying at the lower band, you can place your stop just outside that band. This defines your risk clearly right from the start.
Tying your stop-loss directly to the VWAP means you're letting the market tell you when you're wrong, not your emotions. This creates a simple, objective rule that stops a small loss from becoming a catastrophic one.
Once you know where your stop is, you can figure out your position size. Honestly, this is the most critical part of managing risk. Never, ever enter a trade without knowing exactly how much you stand to lose if you're wrong.
I stick to a simple formula:
Let’s run a quick example. If you have a $10,000 account and a 1% risk rule, your maximum loss per trade is $100. If your stop-loss is $0.50 away from your entry, your position size is 200 shares ($100 / $0.50).
Sticking to this discipline ensures that no single bad trade can wipe you out. If you want to go deeper, our guide on the https://www.ezalgo.ai/blog/risk-management-for-traders covers more ways to protect your capital.
Getting the hang of a basic VWAP strategy is a solid first step, but the real money is made in the details. To level up, you need to learn how to stack signals for stronger confirmation and, just as importantly, recognize when VWAP is more likely to mislead you than help you. This is how you start filtering out the bad trades and avoiding the traps that catch most new traders.
One of the best ways to get more conviction behind your trades is to look at multiple timeframes. A good-looking setup on your main chart, say the 5-minute, becomes a high-probability trade if it lines up with the bigger picture on the 15-minute or hourly chart. This little trick keeps you from fighting a much larger trend.
Jumping on every VWAP cross is a recipe for disaster, especially when the market is choppy. Experienced traders rarely rely on a single indicator. Instead, they look for "confluence"—where multiple signals all point in the same direction.
Here are a couple of powerful combos I like to use:
Think of it like building a case for your trade. A setup that checks multiple boxes—a clean VWAP signal, a momentum indicator agreeing with you, and the higher timeframe on your side—is infinitely better than one based on a single, isolated signal.
This might be the most important skill of all: knowing when to sit on your hands. VWAP is a fantastic tool, but it's not magic. Its reliability depends heavily on two things: volume and direction. In the wrong conditions, it can do more harm than good.
The number one enemy of any VWAP strategy is a sideways, low-volume market. When there’s no real buying or selling pressure, the price just sloshes around the VWAP line. You'll get whipsawed back and forth with a dozen fake signals that go nowhere. It’s pure frustration.
This isn't just a hunch; statistical backtesting confirms it. Quantitative studies have shown that VWAP crossing strategies can work well for both trend-following and mean-reversion, but their effectiveness depends heavily on market conditions. For a deeper dive into the numbers, you can check out these quantitative findings on VWAP performance to see how the data backs up these tactical decisions.
Ultimately, being a profitable VWAP trader isn't just about finding great entries. It's about having the discipline to do nothing when the market isn't giving you a clear signal. Recognizing a bad environment is just as crucial as spotting a perfect setup.
Even with a solid plan, questions always pop up when you're putting a new strategy to the test. Here, I'll tackle some of the most common questions traders have about using a VWAP trading strategy. The goal is to give you direct answers so you can trade with more clarity and confidence.
Getting these details right is often what separates a consistently profitable trader from one who gets tripped up by simple misunderstandings. Let’s clear up any lingering confusion.
Since the VWAP calculation resets every single morning, it is purely an intraday indicator. It’s designed for analyzing the market session by session, making it a perfect tool for day traders.
It really shines on lower timeframes where you can see the day's action unfold. Most traders I know gravitate toward these charts:
Because it resets daily, VWAP is not meant for multi-day swing trading or long-term investing. Its entire value is based on the current day's volume and price data.
This is probably the most important distinction to grasp. While both are lines on a chart that show an average price, how they get there is fundamentally different. The key difference is volume.
A Simple Moving Average (SMA) only cares about price. It just adds up the closing prices over a set period and divides by the number of periods. Every data point gets equal importance.
VWAP, on the other hand, gives more weight to price levels where a lot of trading volume actually happened. This makes it a truer reflection of where the big money changed hands, offering a much better gauge of institutional sentiment and what the market considers a "fair" value for the day.
In short, VWAP tells you where the market's real interest is.
Not exactly. The reliability of VWAP is directly tied to the quality and availability of volume data. It's most dependable in liquid, high-volume markets where there's a constant stream of trading activity.
It works exceptionally well for:
On the flip side, it's much less reliable in thinly traded or illiquid stocks. In those cases, the volume data can be sparse and erratic, causing the VWAP line to jump around and give you bad signals. It’s also not typically used in the forex market, as there is no single, centralized source for volume data.
Ready to stop guessing and start trading with data-driven precision? EzAlgo provides AI-powered buy and sell signals directly on your TradingView chart, helping you identify high-probability setups based on VWAP and other institutional-grade indicators. Remove the emotional bias and gain a technical edge. Start your journey with EzAlgo today.


%201.svg)