


At its core, a trading strategy using the Relative Strength Index (RSI) is all about spotting when a market is overbought or oversold to find potential entry points. The classic approach is to buy when the RSI moves back above the 30 level (signaling it's leaving oversold territory) and sell when it drops back below the 70 level (leaving overbought territory). Of course, you’ll always want to use price action or other indicators to confirm the move.
When most traders hear "RSI," their minds jump straight to "overbought" (above 70) and "oversold" (below 30). And while those are the foundation, they're really just the beginning of what this incredibly useful indicator can show you. To build a truly solid trading strategy with RSI, you have to get what it's actually doing under the hood.
The RSI is fundamentally a momentum oscillator. In simple terms, it measures the speed and size of an asset's recent price changes. It’s telling you how quickly the price is going up or down.
The standard 14-period setting, which comes from its creator J. Welles Wilder Jr., compares the average gains to the average losses over the last 14 candles. This simple calculation offers a powerful glimpse into the market's psychology.
Think of it this way: a high RSI reading means the bulls have been in complete control, with upward price moves being much stronger than any recent dips. This shows strong bullish momentum, but it can also be a heads-up that the trend might be getting a bit stretched and a pullback could be coming.
On the flip side, a low RSI means sellers have been dominating, pushing prices down hard. While this points to bearish momentum, it can also be the first clue that the selling pressure is easing up, potentially setting the stage for a reversal.
A common mistake is to blindly sell the second RSI hits 70 or buy the moment it touches 30. I've learned from experience that it's often better to wait for the RSI to cross back into the neutral zone. This simple act of patience serves as a much stronger confirmation that momentum is genuinely shifting.
This is exactly why RSI is a key part of so many trading plans. It doesn't just show you where the price is right now; it gives you solid clues about where it might go next. When you use it correctly, the RSI provides the "why" behind a potential market turn.
If you want to get into the nitty-gritty of the calculations and concepts, feel free to check out our detailed guide on how to use the RSI indicator.
Don't just take my word for it, though. Historically, strategies built on this logic have performed exceptionally well. One S&P 500 backtest from 1993 to 2025 showed that an initial investment could have grown over eight times, boasting an incredible win rate of 91%. Seeing the data for yourself really drives home just how valuable mastering this indicator can be.
A messy chart is a recipe for bad decisions. Before you even think about placing a trade, the first thing you need to do is get your workspace in TradingView set up cleanly and effectively. This is your foundation for making clear-headed trading decisions.
The whole idea here is to build a system with dual confirmation. We’ll use the RSI to spot shifts in momentum, and then layer on a second indicator, like the signals from EzAlgo, to actually confirm our entry points. This simple combination is surprisingly powerful for filtering out market noise and keeping you out of bad trades.
Your main workhorse is the Relative Strength Index. To get it on your chart, just click the "Indicators" button up top in TradingView and type in "Relative Strength Index." When you select it, it’ll pop up in its own window right below your price chart.
For this strategy, we're going to stick with the classic 14-period setting. It's the most common configuration for a reason—it gives a solid, balanced read on momentum without getting jumpy over every little price tick. It’s the perfect place to start.
Now, let's add our confirmation tool. If you're using EzAlgo, you'll add it to your chart the same way you added the RSI. This second layer is what separates guessing from a high-probability setup. The RSI might be screaming "oversold," but an EzAlgo "Buy" signal is the final nod you need to pull the trigger with confidence. It's a sign that other key factors are lining up with the momentum shift.
From my own experience, traders who don't use a confirmation signal get absolutely chewed up in choppy, sideways markets. The RSI can sit in oversold territory for what feels like an eternity during a brutal downtrend. That confirmation signal is what stops you from trying to catch a falling knife.
Here’s what a clean setup looks like. Notice how you have the price chart, the EzAlgo signals, and the RSI all working together without creating a visual mess.

This layout gives you everything you need at a glance: price action, potential entry signals, and momentum, all without overwhelming you.
While the standard 14-period RSI is our go-to, it’s not a one-size-fits-all solution. Knowing when to tweak it can give you a real edge.
My advice? Start with the standard 14-period setting. Get comfortable with it, see how it behaves, and only start experimenting after you've found some consistency. Once your chart is configured, you'll have a much clearer view of the market, putting you in a great position to spot those high-quality trade setups.
Alright, this is where the magic happens. We've got our charts set up, and now it's time to turn that setup into real, actionable trade ideas. Finding a high-probability entry isn't about gut feelings; it’s about patience and waiting for a very specific set of conditions to line up. This discipline is what separates the pros from the crowd—it filters out the market noise and zeros in on the setups that give you a statistical edge.
When I'm looking to go long, the first thing I watch for is the RSI dipping into oversold territory. Specifically, I need to see the RSI line drop below the 30 level. This is a sign that sellers have been in control, but they might be running out of gas.
But—and this is critical—we don't just buy because it's oversold. That's a rookie mistake. The actual trigger comes when the RSI crosses back up and closes above the 30 line. That little move is everything. It suggests buyers are starting to trickle back in, and the momentum is finally shifting from down to up.
This RSI crossover is my initial cue to pay close attention. An oversold bounce is a solid start, but I always look for a second layer of confirmation. When an EzAlgo "Buy" signal pops up on my chart right around the same time the RSI reclaims the 30 level, that’s my green light. Now I have a dual-confirmed, high-probability entry.
For short positions, we just flip the script. The process starts when I see the RSI push into overbought territory, which means it’s climbed above the 70 level. This tells me that the buying frenzy has been intense, and the rally might be on its last legs.
Once again, patience is the name of the game. An overbought market doesn't automatically mean it's time to sell. The real signal comes when the RSI crosses back down and closes below the 70 line. This action is a strong hint that sellers are wrestling back control and the upward momentum is fizzling out.
Just like with our buy setups, this RSI cross is only half the equation. I immediately look for an EzAlgo "Sell" signal to validate the move. When both of those conditions are met, my confidence in the short trade is infinitely higher than if I were just winging it with the RSI alone.
A common mistake I see traders make is acting on the first sign of an overbought or oversold condition. In a strong trend, the RSI can stay above 70 or below 30 for a long time. Waiting for it to cross back over the threshold is a simple rule that can save you from fighting a powerful trend.
To make this crystal clear, I've put together a quick checklist that summarizes the exact conditions for both long and short trade entries.
This table breaks down the sequence of events you need to see before pulling the trigger. Think of it as your pre-flight checklist for every trade.
Following this simple framework helps ensure you're only taking trades that meet all your criteria, which is key for long-term consistency.
Beyond the basic overbought and oversold signals, one of the most powerful tools in any RSI strategy is divergence. This happens when the price of an asset is moving in one direction, but the RSI indicator is moving in the opposite direction. It’s a classic sign of a conflict in the market, often hinting that a major trend reversal is just around the corner.
There are two main types you need to keep an eye out for:
Looking at performance data and backtesting results is how we can validate that these patterns, like divergence, actually work.
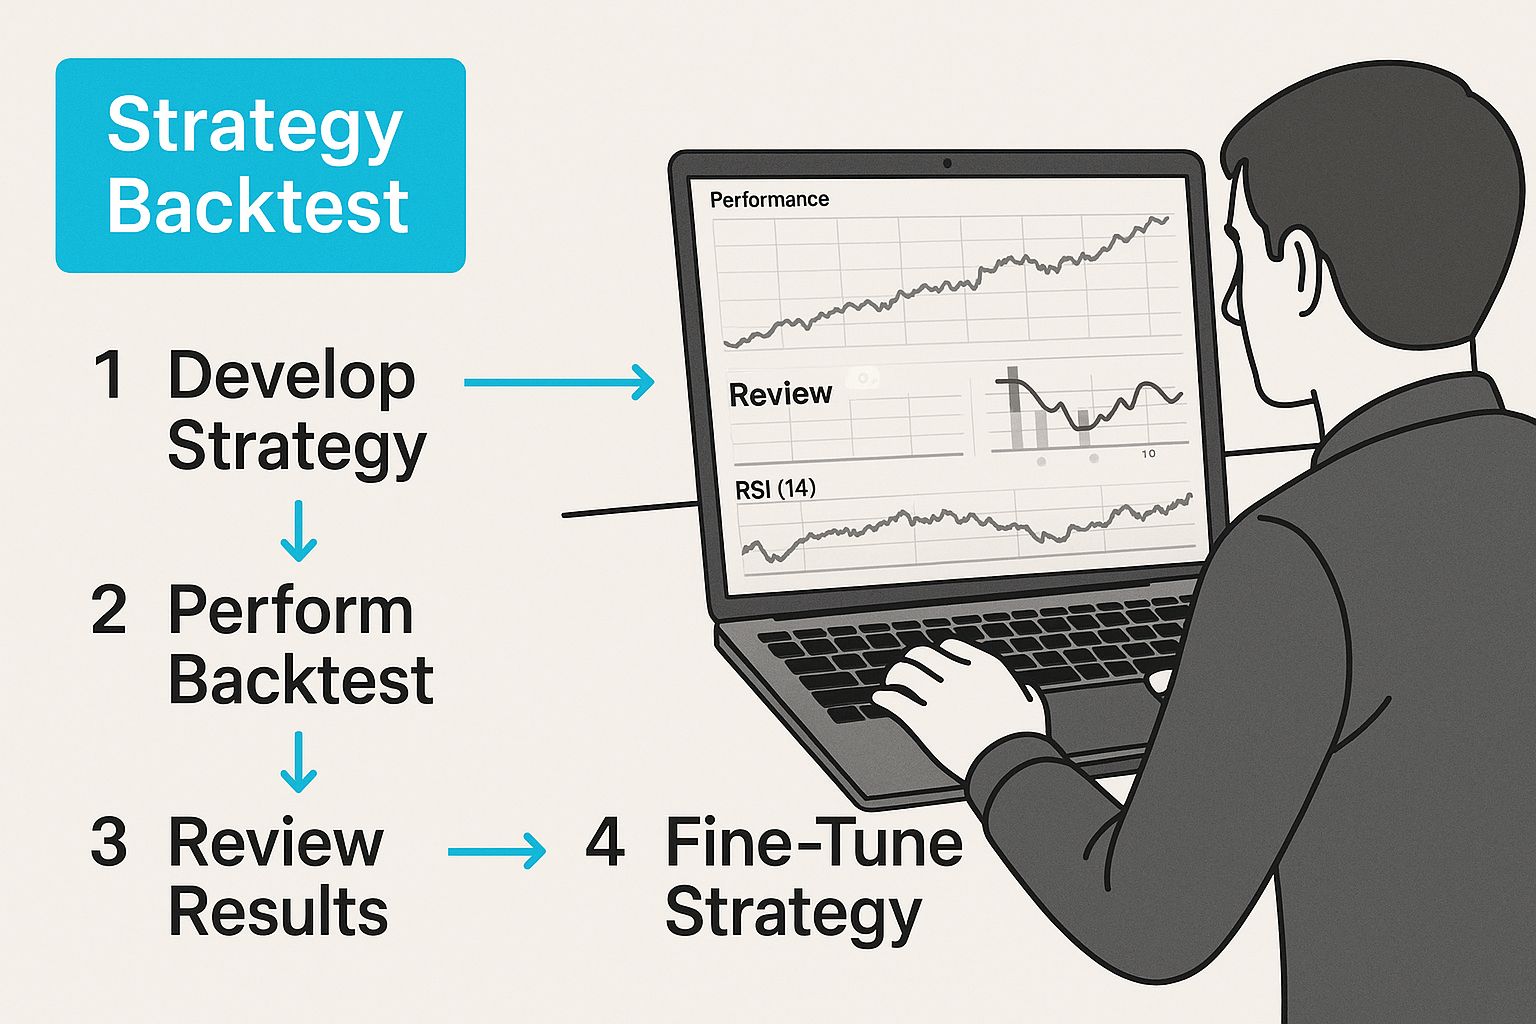
When you review historical data, you can see for yourself how often signals like RSI divergence have led to profitable outcomes, giving you more confidence to act on them in real-time.
Finding a great entry feels good, but it's only half the battle. What truly separates consistently profitable traders from the rest of the pack is knowing how to manage the trade after you're in.
Your exit plan—knowing exactly where you’ll get out for a profit or a loss—needs to be decided before you even click the buy or sell button. This isn't just a suggestion; it's the core of disciplined trading. It removes the emotional guesswork, so you're not panicking when a trade moves against you or getting greedy when it goes your way. You just follow the plan.
Rule number one is always capital preservation. Your stop-loss is your safety net, and it's non-negotiable.
For this specific RSI strategy, a really effective and simple place to set your stop is just beyond the most recent swing point that formed right before your entry signal appeared.
Why does this work so well? Because if the price blows past that swing point, the market structure that supported your entire trade idea is now broken. It's a crystal-clear signal that your analysis was wrong, and it's time to exit with a small, controlled loss.
Key Takeaway: A solid rule of thumb is to never risk more than 1-2% of your entire trading account on any single trade. This discipline ensures that even a string of losses won't knock you out of the game.
Knowing when to cash out is just as important as knowing when to cut your losses. A perfect entry is worthless if you let all your paper profits vanish. With an RSI-based strategy, you have a couple of smart ways to set your profit targets.
A classic method is to use a fixed risk-to-reward ratio. Many traders start with a 1:2 ratio, which means you're aiming to make two dollars for every one dollar you risk. For example, if your stop-loss is 50 pips from your entry, your take-profit target would be 100 pips away. This simple math ensures your winning trades are substantially bigger than your losing ones.
Another, more dynamic approach is to let the RSI signal your exit. Let's say you went long when the RSI crossed up from the 30 oversold level. You could then plan to take profit once the RSI climbs to the opposite extreme and hits the 70 overbought level. This lets the market itself tell you when the bullish momentum is likely running out of steam. More advanced traders often set their stop losses between 5% to 8% below their entry, combining RSI with other confirmations.
At the end of the day, strong risk management for traders is the foundation of any successful trading career. By defining your exits before you ever enter a trade, you build the discipline needed to trade objectively and protect your capital for the long haul.
Here's the rewritten section, designed to sound like it was written by an experienced trader.
Markets are a lot like people; they have distinct personalities. Sometimes they're in a clear, decisive mood, trending hard in one direction. Other times, they're indecisive, chopping sideways without any real conviction. A rigid RSI strategy that only looks at the standard 70/30 levels just can’t keep up—it doesn't know the difference. This is where truly consistent traders separate themselves from the crowd.
The classic overbought/oversold approach is fantastic when the market is stuck in a range. When price is just bouncing between familiar support and resistance levels, the RSI hitting 30 or 70 is often a rock-solid sign that a reversal is coming. It’s like clockwork.
But in a strong trend? Those same signals are traps. I’ve seen it a hundred times: during a monster uptrend, the RSI can scream "overbought" and stay above 70 for days, even weeks. If you jump in to sell every time that happens, you’re just going to get run over.
To stop fighting the market's main current, you need a simple way to define the trend. My go-to is the 200-period Exponential Moving Average (EMA). It’s a clean, simple line in the sand that tells me whether the bulls or the bears are in charge.
Here's how I use it:
This one filter alone will save you from so many bad trades by keeping you on the right side of the market's momentum.
When I see a strong uptrend holding above the 200 EMA, I basically ignore the 70 "overbought" signal for sells. Instead, I start watching the 50 level on the RSI. A dip back to that midline often signals a perfect pullback—a chance to jump back into the trend at a better price.
Suddenly, the RSI isn't just a reversal tool anymore. It becomes a fantastic way to spot trend-continuation entries. You stop trying to heroically call tops and bottoms and start riding the wave with the big money.
This isn't just my experience, either. Recent research confirms that blindly applying the 70/30 rule is a recipe for inconsistent results. Studies have shown that adjusting RSI levels to match the market type can boost effectiveness by as much as 15-20%. For instance, in powerful trends, levels like 80/20 often perform better, while classic 70/30 shines in sideways markets.
If you want to dig into the data, you can read more about optimizing the RSI for different market types. It's a clear reminder that a one-size-fits-all approach is one of the biggest mistakes you can make in trading.
Even with a great game plan, you're bound to have questions once you start using the RSI strategy in a live market. Let's walk through some of the most common ones I hear, so you can trade with more clarity and confidence.
Honestly, there's no magic "best" timeframe—it really boils down to your personal trading style.
If you're a day trader, you'll probably gravitate towards the 5-minute or 15-minute charts because they generate more signals throughout the day. For swing traders looking to hold positions for a few days or weeks, the 4-hour or daily charts are usually the sweet spot, providing signals that are often cleaner and more reliable.
The most important thing is consistency. A signal popping up on a daily chart carries a lot more significance than one on a 1-minute chart. Find a timeframe that suits your life and stick to it.
False signals are just a part of the trading game. It happens. You see the RSI dip into oversold territory, you get a buy signal, and then the price just keeps on dropping. The best way to deal with this is to never rely on the RSI alone.
This is precisely why we pair it with a confirmation tool like EzAlgo. If the RSI pops back above 30 but you don't get that "Buy" signal to back it up, you stay on the sidelines. This two-step confirmation is your best filter against market noise, weeding out कमजोर, unreliable setups.
I've learned that a false signal isn't a failure—it's just information. It tells you the market conditions aren't right for your strategy at that moment. The disciplined trader waits for the next high-probability setup instead of forcing a trade that isn't there.
Absolutely. The core concept behind the RSI—measuring momentum—is universal. Since it just analyzes the speed and change of price movements, it works just as well for Bitcoin and EUR/USD as it does for stocks like Apple.
That said, you may need to tweak your risk management and expectations. Crypto and forex are famous for their volatility, which can lead to more extreme RSI readings.
The fundamental strategy doesn't change, no matter the market. Identify the RSI signal, wait for confirmation, and manage your risk on every single trade.
Ready to stop guessing and start trading with data-driven signals? EzAlgo integrates directly into your TradingView chart, providing the clear buy and sell confirmations you need to execute your RSI strategy with precision. Eliminate emotional decisions and gain a technical edge today at https://www.ezalgo.ai.


%201.svg)