


Moving averages are more than just simple lines on a chart; they are the backbone of countless successful trading systems. Whether you're a beginner seeking clarity in market trends or an experienced trader refining your edge, understanding how to effectively apply these tools can transform your technical analysis. These indicators help filter out market noise, identify trend direction, and pinpoint potential support and resistance levels.
This guide cuts through the complexity, presenting eight distinct and actionable trading strategies using moving averages. We will move beyond basic theory and dive straight into practical application. Each strategy includes a clear breakdown of its rules, explores real-chart examples, and provides step-by-step instructions on how to implement them on TradingView.
You will learn specific entry and exit criteria for strategies like the classic SMA Crossover, the more responsive EMA approach, and advanced techniques like the Moving Average Ribbon and Triple Crossover. We'll also demonstrate how to enhance signal precision using powerful tools like EzAlgo to automate your analysis and gain a competitive advantage. This article is your roadmap to mastering moving averages for smarter, more confident trading decisions.
The Simple Moving Average (SMA) Crossover is one of the most foundational and widely used trading strategies using moving averages. Its core principle is straightforward: it uses two SMAs of different time periods to identify potential trend changes and generate clear buy or sell signals. This strategy is a classic example of trend-following, designed to help traders enter a trend as it begins and exit as it shows signs of reversal.

The mechanics are simple. A shorter-period SMA reacts more quickly to recent price changes, while a longer-period SMA moves more slowly, representing the established trend. A "Golden Cross" occurs when the shorter SMA crosses above the longer SMA, signaling a potential new uptrend and a buy opportunity. Conversely, a "Death Cross" happens when the shorter SMA crosses below the longer SMA, indicating a potential downtrend and a sell signal.
The most popular combination is the 50-period and 200-period SMA, often used on daily charts to analyze long-term market sentiment. For example, the S&P 500's Golden Cross in mid-2020 preceded a major bull market, demonstrating the power of this signal on a large scale.
Key Insight: This strategy excels in markets with clear, sustained trends. It filters out short-term price "noise," allowing traders to focus on the bigger picture and avoid getting shaken out by minor corrections.
To effectively apply this strategy, consider the following actionable steps:
The Exponential Moving Average (EMA) Strategy is a popular alternative to the SMA, prized for its increased responsiveness to recent price action. Unlike the SMA, which gives equal weight to all data points in its calculation, the EMA assigns greater significance to the most recent prices. This makes it a faster-moving average, allowing traders to identify potential trend changes more quickly. It is one of the most effective trading strategies using moving averages for fast-paced markets.
This infographic summarizes the core characteristics of the Exponential Moving Average (EMA) strategy.
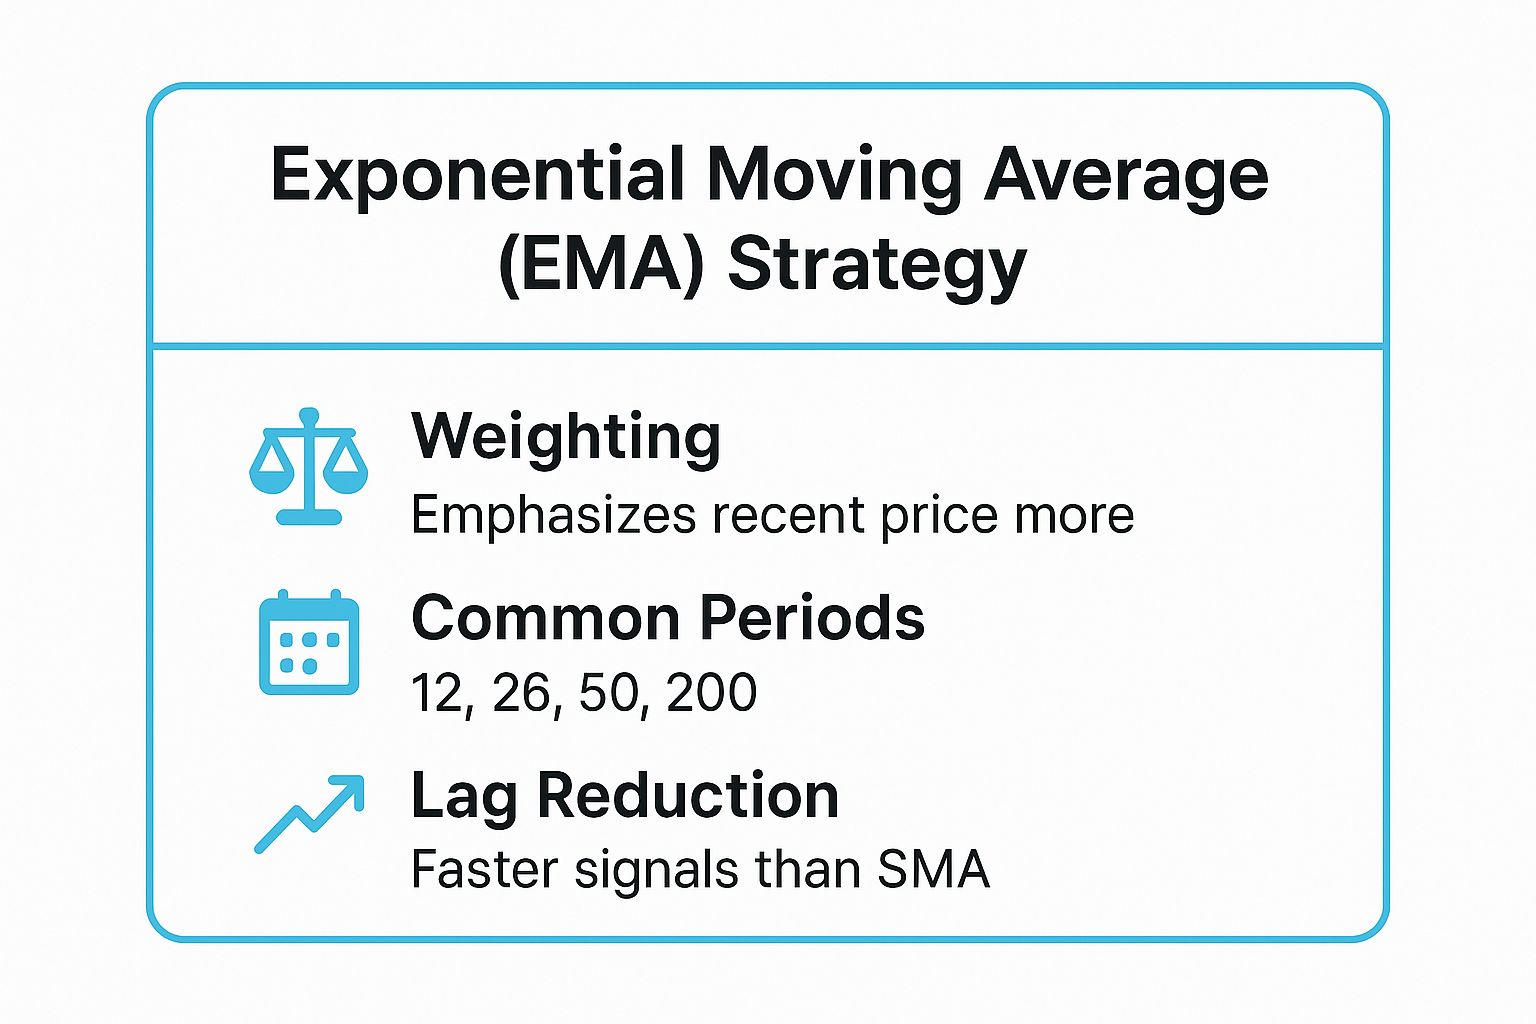
The key takeaway is that the EMA's emphasis on recent data results in faster signals, making it a preferred tool for short-term traders. A "Golden Cross" or "Death Cross" with EMAs will occur sooner than with SMAs, offering earlier entry and exit points. This sensitivity is particularly useful in volatile markets like cryptocurrencies and forex, where speed is critical.
Day traders often rely on short-term EMA crossovers, such as the 9-period and 21-period EMA combination, to capture intraday price swings. For instance, when the 9 EMA crosses above the 21 EMA on a 15-minute chart, it can signal a short-term bullish move. Forex traders might employ a combination of 5, 10, and 20 EMAs to gauge momentum across different sessions. Learn more about the best technical indicators for day trading to enhance this strategy.
Key Insight: The EMA strategy excels at reducing lag, providing earlier signals in trending markets. Its responsiveness makes it ideal for traders who need to react quickly to market shifts and want to get into a trend as early as possible.
To effectively apply this strategy, consider the following actionable steps:
The Moving Average Ribbon strategy is a visually intuitive and powerful method for gauging trend strength, direction, and potential reversals. Instead of relying on just two moving averages, this technique plots multiple MAs (typically six to eight) of varying lengths simultaneously on a chart. This collection of lines forms a "ribbon" that expands and contracts, providing a deeper look into market momentum.

The core idea is simple: when the moving averages are parallel, spaced far apart, and moving in one direction, the trend is strong. When the ribbon contracts or twists, it signals that the trend is weakening or reversing. A buy signal occurs when the shorter-term MAs cross above the longer-term MAs and the ribbon begins to expand upwards. Conversely, a sell signal is generated when the shorter-term MAs cross below and the ribbon fans out downwards.
This strategy is highly adaptable. Professional forex traders often use Exponential Moving Averages (EMAs) with Fibonacci-based periods (e.g., 5, 8, 13, 21, 34, 55) to capture fast-moving trends. Stock swing traders might prefer a set of Simple Moving Averages (SMAs) like 10, 12, 14, 16, 18, and 20 to analyze medium-term momentum. The ribbon's width is key; a widening ribbon confirms trend strength, while a narrowing ribbon warns of a potential change.
Key Insight: The Moving Average Ribbon excels at identifying the "health" of a trend. It moves beyond simple crossover signals to show the conviction and momentum behind a price move, helping traders stay in strong trends longer and exit before a full reversal.
To effectively apply this strategy, consider the following actionable steps:
The Moving Average Convergence Divergence (MACD) is a popular momentum oscillator that refines the concept of moving average crossovers. Developed by Gerald Appel, it shows the relationship between two Exponential Moving Averages (EMAs) of a security's price, providing a more dynamic view of trend strength, direction, and momentum. It is one of the most versatile trading strategies using moving averages because it combines trend-following and momentum into a single indicator.
The MACD is calculated by subtracting the 26-period EMA from the 12-period EMA. This calculation forms the MACD line. A 9-period EMA of the MACD line is then plotted as the signal line, which functions as a trigger for buy and sell signals. When the MACD line crosses above the signal line, it suggests upward momentum (a bullish signal), and when it crosses below, it indicates downward momentum (a bearish signal). The difference between these two lines is often plotted as a histogram.
The MACD offers several ways to generate signals. A basic crossover is the most common, but traders also watch for the MACD line crossing above or below the zero line, which can indicate a major trend change. For instance, the S&P 500's MACD centerline crosses have frequently coincided with the start of new bull or bear market phases. Divergence is another powerful signal, such as when Apple's stock price made a lower low in March 2020 while its MACD made a higher low, signaling a powerful bullish reversal.
Key Insight: The MACD's strength lies in its ability to measure the velocity of price moves. The histogram, in particular, provides an early warning system by showing when momentum is accelerating or decelerating before a crossover even occurs.
To effectively apply the MACD strategy, consider these actionable steps:
The Bollinger Bands strategy integrates moving averages with market volatility to create dynamic trading channels. Developed by John Bollinger, this tool consists of three lines: a central moving average (typically a 20-period SMA) and two outer bands representing standard deviations from the average. This approach offers a powerful way to gauge trend direction, identify overbought or oversold conditions, and anticipate significant price moves.

The core idea is that price tends to stay within the upper and lower bands. The middle band acts as a baseline for the trend. When the bands tighten, a period known as a "squeeze," it often signals that a significant price breakout is imminent. When the bands expand, it indicates increased volatility. Traders use touches of the outer bands as potential entry or exit points, depending on the prevailing trend confirmed by the middle moving average.
This strategy is highly versatile. For example, during the 2020 rally, Tesla's stock frequently bounced off the lower Bollinger Band, offering clear buy-the-dip opportunities for trend-following traders. In forex, the EUR/USD pair's historic Bollinger Band squeeze just before the Brexit vote preceded one of the most volatile moves in the currency's history, showcasing its predictive power.
Key Insight: Bollinger Bands provide context to price action. They adapt to market volatility, making them one of the most dynamic trading strategies using moving averages for identifying relative highs and lows in both trending and range-bound markets.
To effectively apply this strategy, consider the following actionable steps:
The Triple Moving Average Crossover is an advanced trend-following strategy that adds a third moving average to enhance signal reliability. By using short, medium, and long-term MAs, it provides an additional layer of confirmation, helping traders filter out false signals common in two-MA systems and identify trends with greater conviction. This method is designed to confirm trend strength and momentum before committing to a position.
The system works by observing the alignment of all three moving averages. A strong uptrend is confirmed when the price is above the short-term MA, which is above the medium-term MA, which is in turn above the long-term MA. This tiered alignment signals robust bullish momentum. A definitive buy signal occurs when the short-term MA crosses above the medium-term MA, while both are already above the long-term MA. Conversely, a sell signal is generated when the short-term MA crosses below the medium-term MA, while both are below the long-term MA.
This strategy is highly adaptable to different trading styles. For example, professional swing traders might use a 10, 20, and 50-period EMA combination to catch intermediate trends. Position traders, who focus on longer time horizons, often employ a 50, 100, and 200-period SMA setup on daily or weekly charts to align with major market cycles, a concept influenced by systems like William O'Neil's CAN SLIM methodology.
Key Insight: The third moving average acts as a trend filter. It prevents traders from entering choppy markets by requiring the long-term trend to be in their favor before a crossover signal is considered valid.
To effectively apply this strategy, consider the following actionable steps:
The Moving Average Envelopes strategy is a versatile tool that helps traders identify potential overbought and oversold levels within a trend. It functions by plotting two bands at a fixed percentage distance above and below a central moving average, creating a dynamic price channel. Unlike volatility-based bands like Bollinger Bands, these envelopes use a constant percentage, making them a straightforward method for mean reversion and trend continuation trades.
The core idea is that price will generally stay within the envelope's boundaries. When the price touches the upper band, it's considered overbought and may be due for a pullback, signaling a potential short entry or a place to take profit on a long position. Conversely, when the price hits the lower band, it's considered oversold, presenting a potential long entry opportunity. This makes it a powerful component of many trading strategies using moving averages.
The percentage setting is crucial and depends heavily on the asset's volatility. For instance, a major index like the Dow Jones Industrial Average often respects 2% envelopes around a 200-day MA, while more volatile commodity markets might require wider 5-10% envelopes to avoid false signals. Major forex pairs, like EUR/USD, often react to levels set at a 1.5% to 2.5% envelope.
Key Insight: This strategy excels at defining a "normal" price range for an asset. It provides clear, visual boundaries that help traders avoid buying at the top or selling at the bottom of a short-term price fluctuation within a larger trend.
To effectively apply this strategy, consider the following actionable steps:
The Displaced Moving Average (DMA) Strategy is an innovative technique that shifts a moving average forward or backward in time. This adjustment aims to better align the indicator with price action, creating more timely signals. Unlike standard moving averages that inherently lag, a DMA can be fine-tuned to either project future support/resistance levels or reduce lag for faster trend identification.
The core concept is simple: by displacing the moving average, a trader can customize its responsiveness. A forward displacement shifts the MA to the right on the chart, attempting to predict where price might find support or resistance. A backward displacement shifts it to the left, making it hug the price more closely to reduce the typical delay in crossover signals. This modification transforms a reactive indicator into a more predictive tool.
A common application is using a forward-displaced MA to forecast trend lines. For instance, on a chart of the S&P 500, a 20-period MA displaced forward by 10 periods can act as a dynamic trend line, with bounces off this projected line signaling potential entry points in an established trend. In forex, a backward-displaced 50-period EMA on the EUR/USD pair can generate earlier crossover signals than its non-displaced counterpart.
Key Insight: This strategy’s strength is its adaptability. It allows traders to fine-tune a standard moving average to fit a specific asset's volatility and cyclical nature, potentially providing an edge over those using default settings.
To effectively apply this strategy, consider the following actionable steps:
You've journeyed through eight distinct trading strategies using moving averages, from the foundational SMA Crossover to the more nuanced Displaced Moving Average. Each strategy offers a unique lens through which to interpret market momentum, identify trends, and pinpoint potential entry and exit points. The core takeaway is that moving averages are far more than simple lines on a chart; they are a dynamic framework for building a robust trading system.
We've seen how combining different types of moving averages, like in the Triple Moving Average Crossover, can provide layered confirmation. We've also explored how integrating them with other indicators, such as in the MACD and Bollinger Bands strategies, creates a more comprehensive view of market behavior, blending trend analysis with volatility and momentum.
Knowledge alone doesn't guarantee success. The critical next step is to bridge the gap between understanding these strategies and applying them with discipline and confidence. The path to consistency isn't about finding a "holy grail" strategy that never fails. Instead, it’s about internalizing a methodology that aligns with your personal risk tolerance, trading style, and time commitment.
Key Insight: True mastery comes not from knowing many strategies, but from knowing one or two strategies exceptionally well. Your goal is to develop an instinct for when your chosen strategy is most effective and, just as importantly, when to stay on the sidelines.
To turn these concepts into a tangible edge, you need a structured approach. Avoid the common pitfall of jumping between strategies after a few losing trades. Instead, commit to a disciplined process of selection, testing, and refinement.
Here are your next steps:
By diligently following these steps, you transform a generic trading strategy into your personalized trading system. The ultimate goal is to build a reliable, repeatable process that removes emotion and guesswork, allowing you to execute with precision. This disciplined application of trading strategies using moving averages is what separates consistently profitable traders from the rest.
Ready to elevate your moving average strategies with institutional-grade tools and AI-driven precision? EzAlgo integrates directly into your TradingView charts, providing automated signals, dynamic support and resistance levels, and real-time confirmation to help you execute these strategies with greater confidence. Stop guessing and start trading with an analytical edge by visiting EzAlgo to see how our toolkit can revolutionize your approach.


%201.svg)