


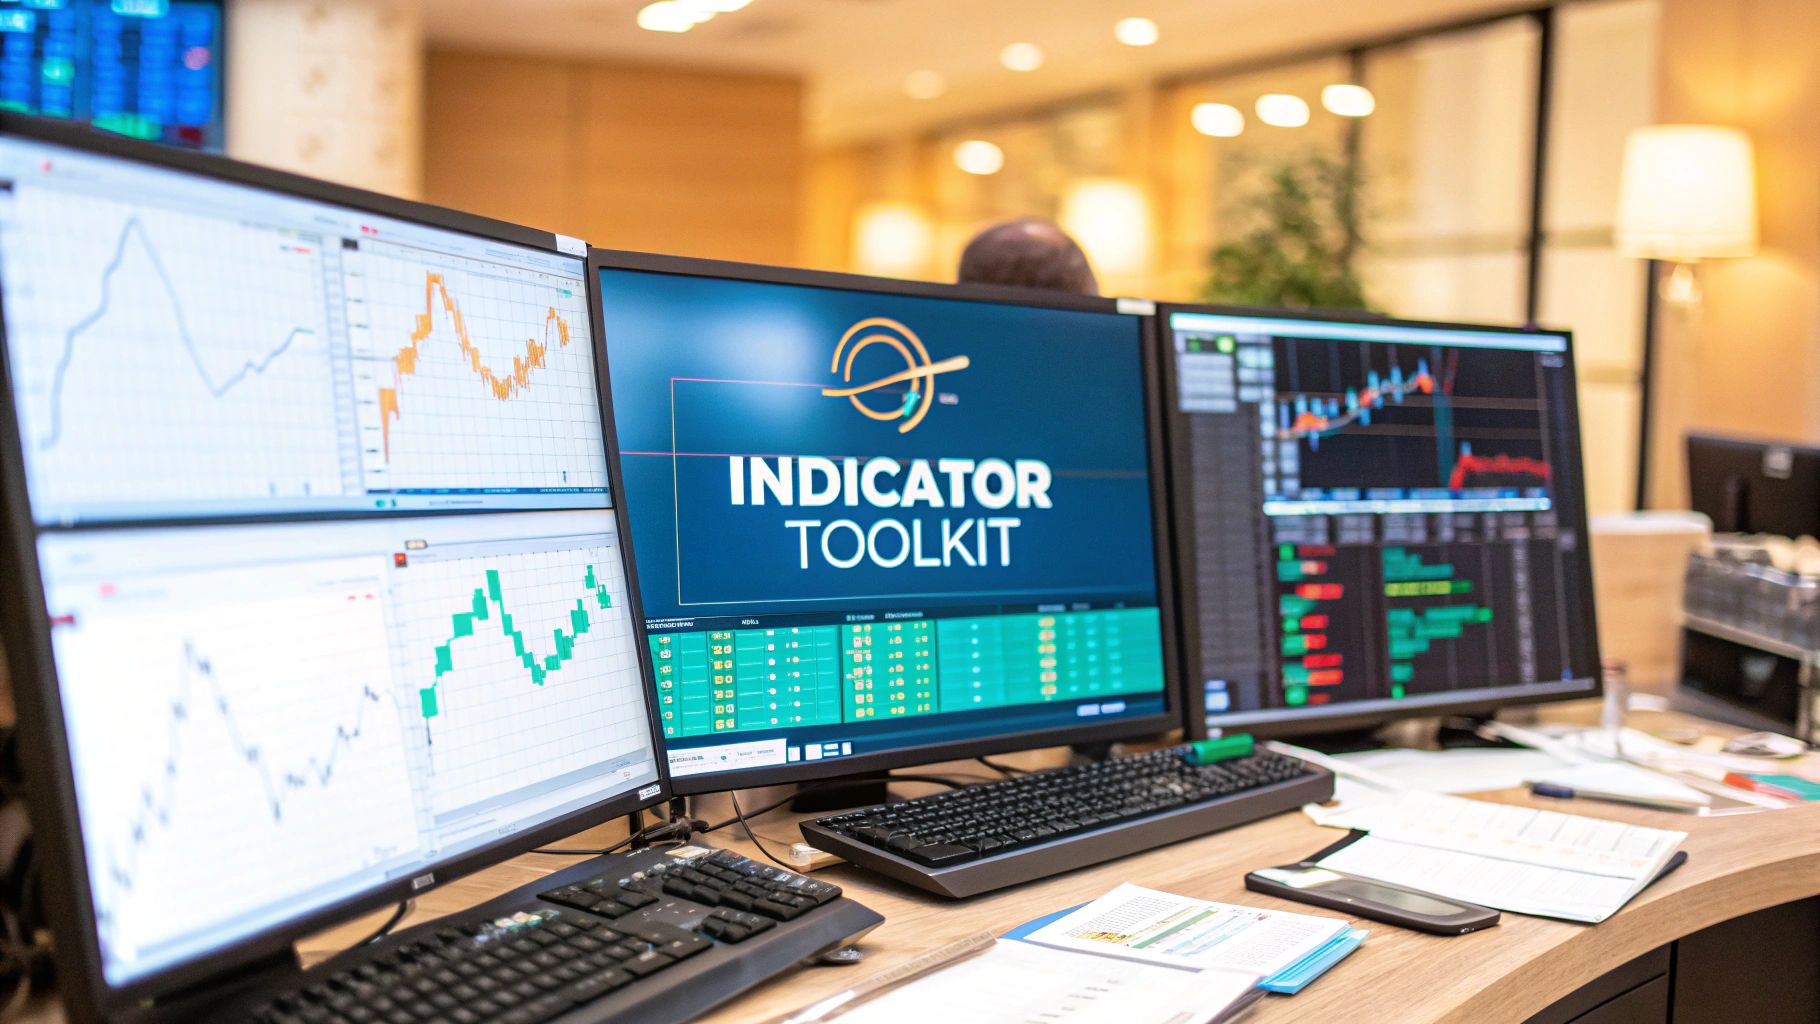
Welcome to your definitive guide on the most effective technical indicators for day trading. In the fast-paced world of intraday trading, success hinges on making swift, informed decisions. While intuition has its place, consistently profitable traders rely on a proven set of tools to navigate market volatility, identify opportunities, and manage risk. This is where technical indicators come into play.
They are not crystal balls, but rather mathematical calculations based on price and volume. Their purpose is to provide objective insights into market psychology and potential price movements. This article cuts through the noise to round up nine of the most powerful indicators every day trader should have in their toolkit. We will break down precisely how each one works, explore its specific strengths and weaknesses, and, most importantly, show you how to integrate them into a cohesive trading strategy.
We will also explore how to supercharge these classic tools using advanced signals from platforms like EzAlgo, giving you a modern edge in today's competitive markets. By the end of this guide, you will have a clear, actionable plan to select and apply the right technical indicators for your trading style. You'll be equipped to transform raw chart data into a powerful decision-making framework, helping you spot high-probability setups and manage your trades with greater confidence. Let's dive into the essential tools that can elevate your trading performance.
The Moving Average Convergence Divergence (MACD) is a cornerstone among technical indicators for day trading. Developed by Gerald Appel, it’s a versatile tool that functions as both a trend-following and momentum indicator. Its primary job is to reveal changes in the strength, direction, momentum, and duration of a trend in a stock's price.
The indicator is composed of three core elements calculated from a security’s price data, each providing a unique piece of market information. Understanding these components is the first step to effectively using the MACD in your trading strategy.
The MACD operates by comparing two different exponential moving averages (EMAs) to identify momentum shifts. The standard setting uses a 12-period EMA and a 26-period EMA.
The following infographic breaks down these three key components of the MACD indicator.
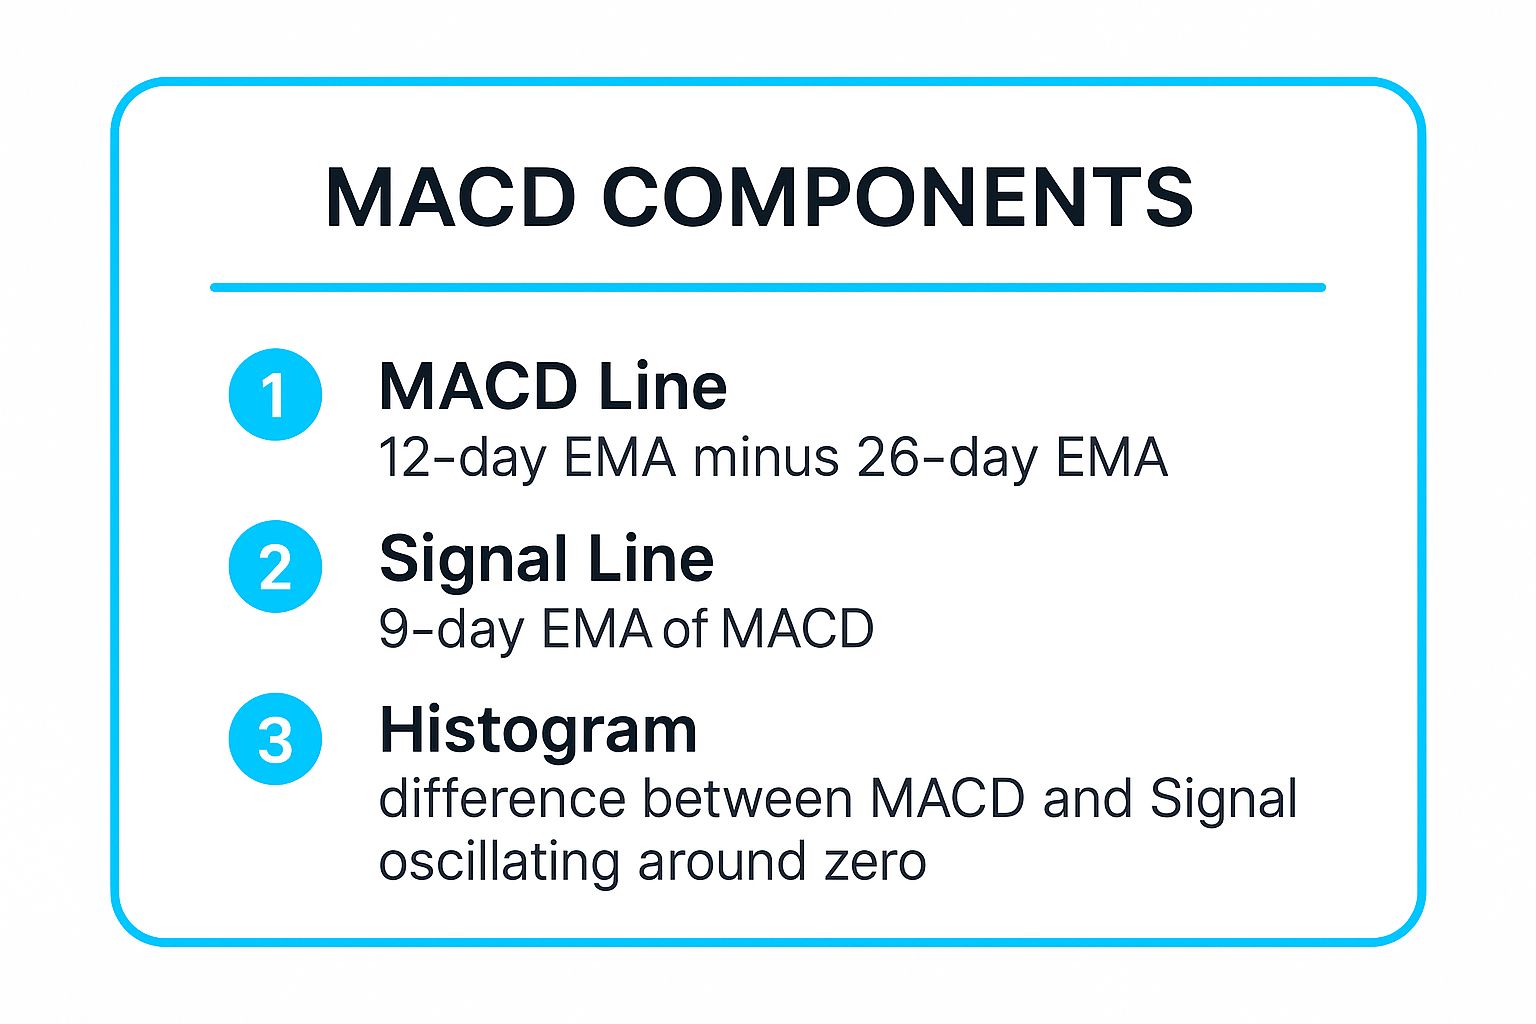
This visual summary clarifies how the MACD line, signal line, and histogram work together to provide a complete picture of market momentum.
One of the most powerful signals is a crossover. When the MACD line crosses above the signal line, it’s considered a bullish signal, suggesting upward momentum is accelerating. Conversely, a cross below the signal line is bearish. For example, a bullish MACD crossover on Apple (AAPL) in early 2023 preceded a significant rally.
Another critical technique is identifying divergence.
Pro Tip: Use the MACD histogram to gauge momentum strength. When the bars on the histogram grow taller, it indicates that the current trend is strengthening. When they start to shrink, it suggests the trend is losing steam. Combining this with EzAlgo’s momentum oscillators can provide a powerful confirmation for your trade entries and exits.
The Relative Strength Index (RSI) is another heavyweight among technical indicators for day trading. Developed by J. Welles Wilder Jr., this momentum oscillator measures the speed and magnitude of a security's recent price changes to evaluate overbought or oversold conditions. It oscillates between 0 and 100, providing traders with clear signals about market momentum and potential reversal points.
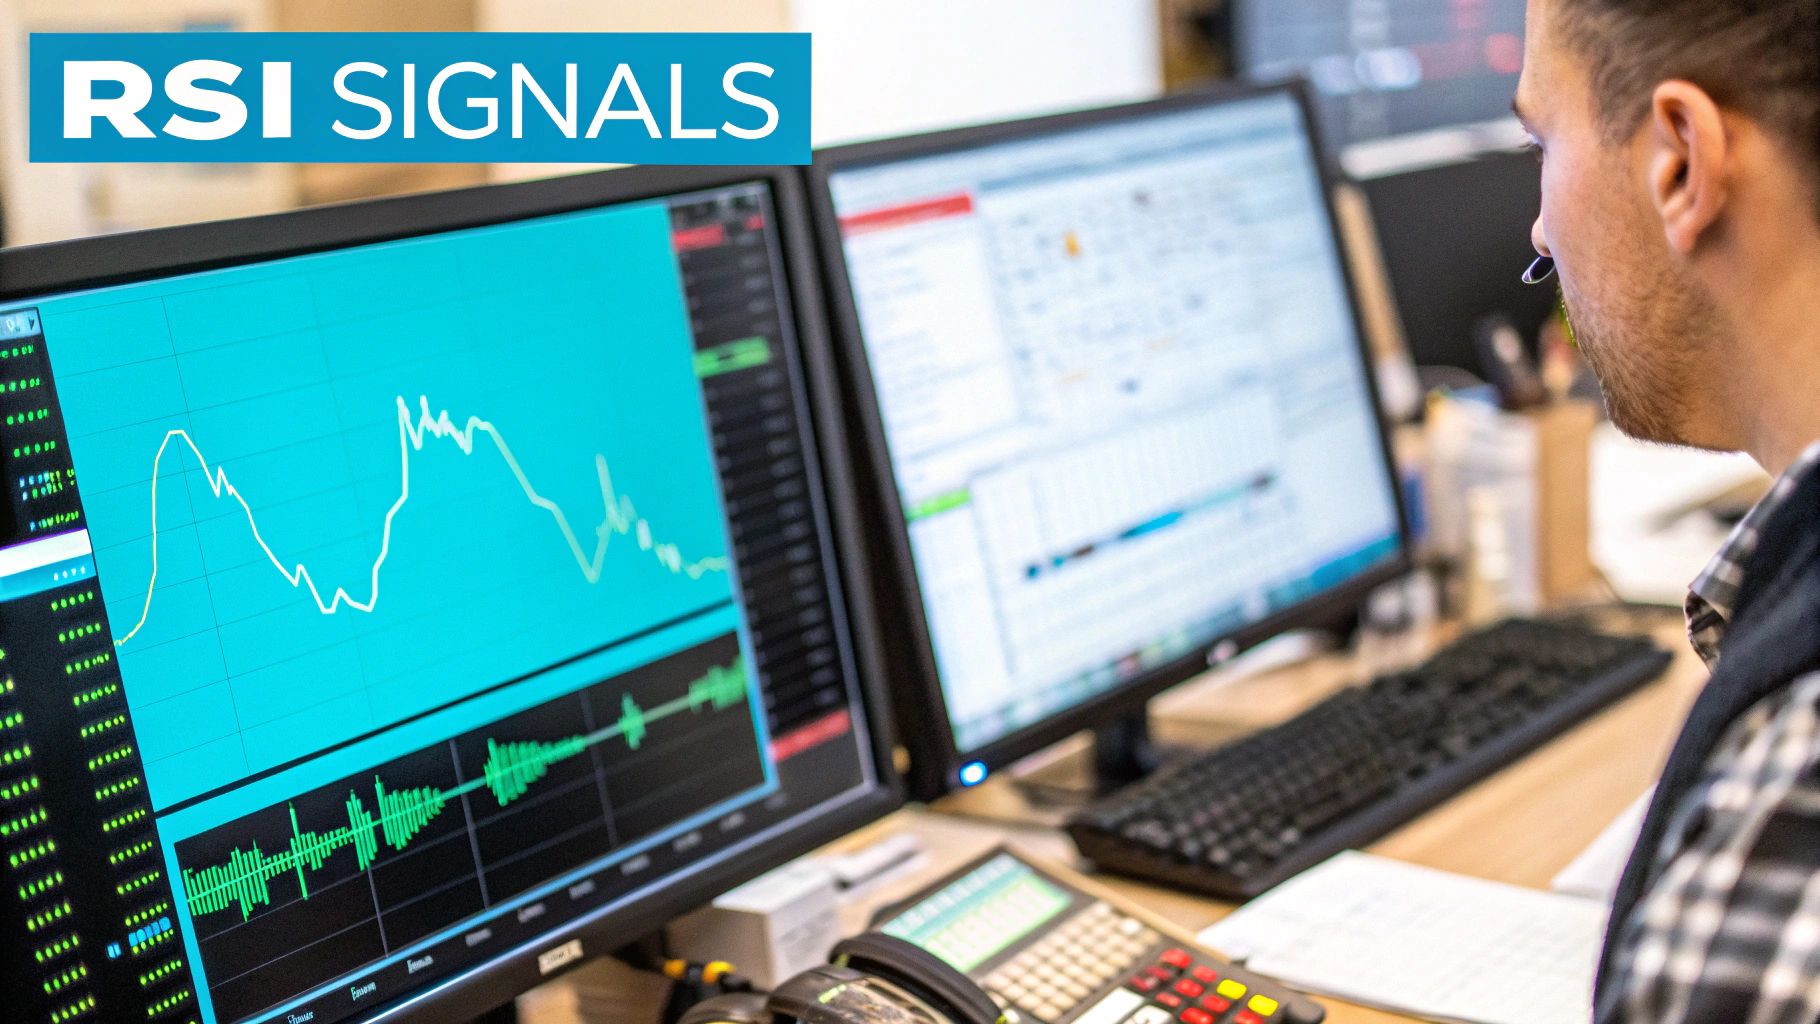
The RSI's primary function is to alert traders when an asset's price has moved too far, too fast in one direction, suggesting that a correction or consolidation may be imminent. This makes it an invaluable tool for timing entries and exits in fast-moving intraday markets.
The RSI calculates a ratio of average gains to average losses over a specified period, typically 14 periods. The resulting value is then plotted on a scale from 0 to 100. Its interpretation is straightforward and based on key levels that signal potential market exhaustion.
For example, the frenzied buying in GameStop (GME) in January 2021 pushed its RSI well above 80, signaling extremely overbought conditions right before its sharp decline.
The most common RSI strategy involves trading reversals from overbought or oversold levels. For instance, a day trader might look for buying opportunities when a stock's RSI dips below 30 and then crosses back above it, like a profitable bounce seen in the EUR/USD pair from the 25 level.
However, a more advanced and often more reliable technique is identifying divergence.
Pro Tip: In strongly trending markets, standard 70/30 levels can trigger premature signals. Consider adjusting to 80/20 to filter out noise and capture more significant moves. For more nuanced strategies, you can learn how to use the RSI indicator with trend analysis and other tools for powerful confirmations.
Bollinger Bands are a staple among technical indicators for day trading, renowned for their ability to measure market volatility and identify potential price extremes. Developed by John Bollinger, this indicator consists of three lines plotted on a price chart. It provides a dynamic framework around price action, helping traders adapt to changing market conditions.
The bands expand when volatility increases and contract when volatility decreases, offering a visual representation of the market's current state. This makes them exceptionally useful for spotting overbought or oversold conditions and anticipating significant price moves.
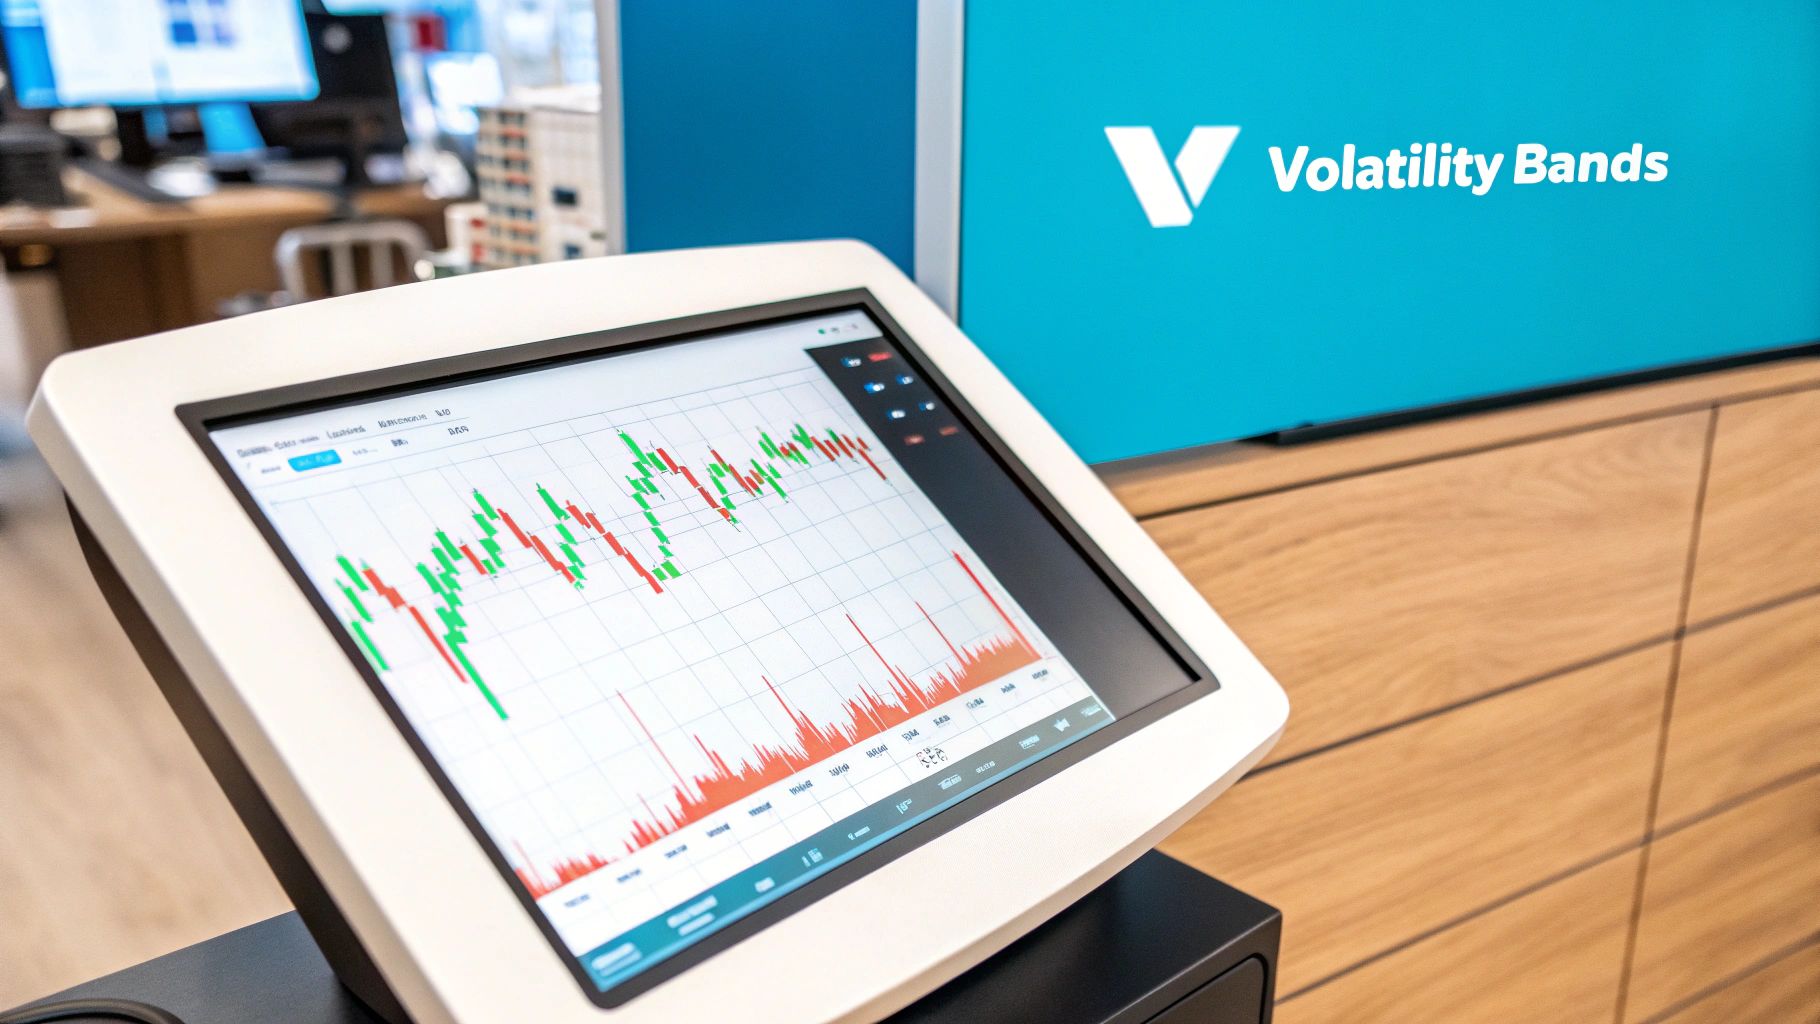
This visual shows how price interacts with the upper and lower bands, signaling potential trading opportunities based on volatility.
Bollinger Bands use a statistical measure known as standard deviation to create their distinctive envelope around the price. The standard settings are simple yet powerful.
Together, these bands contain the majority of price action, and any move that touches or breaks through the outer bands is considered statistically significant.
One of the most popular strategies is the Bollinger Band Squeeze. This occurs when the bands contract tightly, indicating a period of low volatility that often precedes a powerful breakout. A notable example was the squeeze on Netflix (NFLX) in September 2022, which preceded a 30% breakout.
Another effective technique involves trading reversals from the bands.
Pro Tip: For higher-probability reversal trades, combine Bollinger Bands with a momentum indicator like the RSI. When the price touches the lower band and the RSI is simultaneously in oversold territory (below 30), it presents a stronger bullish reversal signal. Integrating this with EzAlgo’s support levels can pinpoint precise entry points for mean reversion plays.
The Volume Weighted Average Price (VWAP) is one of the most respected technical indicators for day trading, particularly favored by institutional investors. It represents the true average price of a security throughout the day, weighted by trading volume. Unlike a simple moving average, VWAP gives more weight to price levels where higher volume occurred, offering a more accurate benchmark for value.
This indicator helps traders determine if they are buying or selling at a fair price relative to the day's trading activity. It's an intraday indicator, meaning it resets at the beginning of each new trading day. Understanding its function is key to interpreting market sentiment and institutional behavior.
VWAP is calculated by taking the total dollar value of all trades for a security (Price x Volume) and dividing it by the total shares traded for the day. This calculation runs continuously from the market open to the market close, creating a single line on the chart.
Institutional algorithms are often programmed to execute large orders around the VWAP to minimize market impact, which is why the level holds such significance.
A primary strategy is using VWAP as a benchmark for trade entries. When a stock is in an uptrend, traders look for pullbacks to the VWAP line to initiate long positions, anticipating a bounce. For example, on strong trending days, a stock like Apple (AAPL) often finds consistent support at its VWAP before continuing higher.
Another key technique involves watching for VWAP reclaims and rejections. A stock gapping down at the open, such as the SPY, might rally back to test the VWAP. If it fails to reclaim and hold above the VWAP, it's a strong bearish signal that the downtrend will likely continue. Conversely, a stock that successfully reclaims its VWAP after trading below it shows a significant shift in intraday momentum.
Pro Tip: Always look for a surge in volume when the price tests the VWAP. High volume on a bounce from VWAP confirms buyer interest and strengthens the support level. Pairing VWAP with volume-based indicators can help you avoid false signals and validate your trading decisions with greater confidence.
The Stochastic Oscillator is a popular momentum indicator that has earned its place among the essential technical indicators for day trading. Developed by George Lane in the 1950s, this tool doesn't follow price or volume but rather the speed or momentum of price. It operates on the principle that momentum changes before price, making it a valuable leading indicator.
The oscillator compares a security's closing price to its price range over a specific period, typically 14 days. Its output is two lines, %K and %D, that oscillate between 0 and 100, signaling potentially overbought or oversold conditions and helping traders anticipate reversals.
The Stochastic Oscillator is based on the observation that as prices rise, closing prices tend to be closer to the high of the recent price range. Conversely, in a downtrend, the closing price tends to be near the low.
These components work in tandem to highlight potential turning points in the market before they become apparent in the price action itself.
One of the most direct ways to use this indicator is to trade the overbought and oversold crossovers. When both the %K and %D lines cross below the 80 level after being above it, it generates a sell signal. For example, many tech stocks in the range-bound market of 2022 provided reliable sell signals from the overbought zone. Conversely, a buy signal occurs when both lines cross above the 20 level, as seen when EUR/USD bounced from the 15 level, generating quick profits for vigilant traders.
Like the MACD, identifying divergence is a powerful technique.
Pro Tip: For day trading, consider using the "Slow Stochastic" setting, which smooths the initial %K line to reduce noise and false signals. Always wait for both the %K and %D lines to exit the overbought or oversold zones before acting, as this confirms a shift in momentum. Filtering these signals with a primary trend indicator provides an even higher probability of success.
The Average True Range (ATR) is one of the most practical technical indicators for day trading, designed specifically to measure market volatility. Created by J. Welles Wilder Jr., the ATR does not provide directional signals. Instead, its sole purpose is to quantify how much an asset's price typically moves over a given period, making it indispensable for risk management.
By understanding an asset's volatility, day traders can set more intelligent stop losses and determine appropriate position sizes. The ATR provides a clear, objective value for the "noise" or normal price fluctuations in a market, helping traders avoid getting stopped out prematurely.
The ATR is calculated based on a series of "true range" values for an asset. The true range for any given period is the greatest of the following three calculations: the current high minus the current low, the absolute value of the current high minus the previous close, or the absolute value of the current low minus the previous close.
A rising ATR indicates that price movements are becoming larger, while a falling ATR signifies a period of consolidation or quieter trading.
The primary use for ATR is in risk and position management. A common technique is to set a stop loss at a multiple of the ATR value away from the entry price. For example, using a 2x ATR stop loss means you are giving the trade enough room to withstand normal volatility without being prematurely exited. For instance, during the March 2020 crash, the SPY's ATR spiked to over 4.5 from its typical 1.5, signaling traders to use much wider stops.
ATR is also crucial for breakout confirmation.
Pro Tip: Use the ATR value to normalize position sizing across different assets. A stock with a high ATR is more volatile and should be traded with a smaller position size compared to a low-ATR stock to maintain equal risk exposure per trade. Integrating this with EzAlgo's support and resistance levels can help you set precise risk parameters for every setup.
Fibonacci Retracements stand out as one of the most predictive technical indicators for day trading. This tool is not based on complex formulas but on a mathematical sequence discovered by Leonardo Fibonacci, where key ratios appear frequently in nature and, as traders have found, in financial markets. It helps identify potential reversal levels where a price pullback might end and the primary trend will resume.
The indicator uses horizontal lines to pinpoint areas of potential support or resistance. These levels are plotted at key Fibonacci percentages of a prior price move, giving traders a roadmap for likely turning points. Understanding how to draw and interpret these levels is crucial for timing entries and exits effectively.
To use this tool, a trader identifies a significant price move, known as a swing high and a swing low. The indicator is then drawn from the beginning of that move to the end. The tool automatically plots horizontal lines at key percentage levels of that move.
The 50% level, though not an official Fibonacci ratio, is widely included as it represents the halfway point of the prior move, often acting as a significant psychological and technical benchmark. For instance, Bitcoin's major rally in 2021 saw a pullback to the 61.8% retracement level around $32K before launching its next leg up, providing a classic entry signal.
The most direct strategy is to look for price to bounce off one of the key retracement levels. Traders often watch for a pullback to the 38.2%, 50%, or 61.8% levels as prime entry zones. For example, during its 2020 correction, Apple (AAPL) stock found significant support at the 38.2% retracement level before continuing its uptrend.
A more advanced technique is seeking confluence, where a Fibonacci level aligns with another technical signal.
Pro Tip: Always look for confirmation before entering a trade at a Fibonacci level. A bullish candlestick pattern forming on the 50% retracement line or a spike in volume provides much stronger evidence that the level will hold. To dive deeper into these powerful strategies, you can explore our complete guide on Fibonacci trading on ezalgo.ai.
The Parabolic SAR (Stop and Reverse) is one of the most visually intuitive technical indicators for day trading. Developed by the legendary J. Welles Wilder Jr., this indicator is designed to identify potential trend direction and provide exit points. It appears on a chart as a series of dots either above or below the price, creating a parabola-like shape.
The core function of the Parabolic SAR is to signal when a trend might be ending. When the dots are below the price, it suggests an uptrend is in place. When they flip to appear above the price, it indicates a potential reversal to a downtrend. This makes it a powerful tool for traders who want to ride a trend for as long as possible.
The indicator uses a trailing stop-and-reverse method that follows the price as the trend extends. The SAR calculation includes an "acceleration factor" that causes the dots to move closer to the price more quickly as the trend matures.
This dynamic stop-loss system helps traders lock in profits and automatically signals when it's time to exit or reverse a position.
The most direct strategy is to use the "flip" as an entry or exit signal. For instance, when the dots move from above the price to below it, a trader might enter a long position. This was evident in Tesla's (TSLA) chart during its massive 2020 rally, where the SAR dots remained consistently below the price, signaling a strong, persistent uptrend.
However, the Parabolic SAR is most effective in strongly trending markets. During the 2019-2020 bull run in Gold (XAU/USD), the indicator provided clear and profitable reversal signals. It is notoriously unreliable in choppy, sideways markets, where it can generate frequent false signals, or "whipsaws."
Pro Tip: Use the Parabolic SAR primarily as a tool for managing trades and setting trailing stops, rather than as a standalone entry signal. Confirm its signals with a trend-following indicator like a Moving Average or the ADX. Adjusting the acceleration factor can also help tune its sensitivity to a specific market's volatility.
The On-Balance Volume (OBV) is a powerful cumulative momentum indicator that stands out among technical indicators for day trading. Developed by Joseph Granville, OBV uses volume flow to predict price changes, operating on the principle that volume precedes price. It provides a running total of a security's trading volume, showing whether volume is flowing into or out of a security.
The indicator is simple yet effective: it adds a day's volume to a cumulative total on up days and subtracts it on down days. This creates a single line that helps traders confirm price trends and spot potential reversals long before they become obvious on a price chart.
The OBV's calculation is straightforward and cumulative, making its trend direction more significant than its actual numerical value.
The resulting OBV line moves up or down with the "smart money" flow. A rising OBV indicates that volume is heavier on up days, suggesting positive buying pressure and confirming an uptrend. A falling OBV signals negative selling pressure, confirming a downtrend.
The most valuable signals from OBV come from divergence. This is when the price and the OBV line are moving in opposite directions, signaling a potential trend reversal.
Pro Tip: Apply trendlines directly to the OBV indicator itself. A breakout above a descending trendline on the OBV can act as a leading signal for a price breakout. Always confirm these OBV signals with price action or another indicator before entering a trade.
You've just journeyed through nine of the most powerful technical indicators for day trading, from the trend-following prowess of the MACD to the volume-centric insights of VWAP. Understanding how each tool like RSI, Bollinger Bands, or the Stochastic Oscillator works in isolation is the foundational step. However, the secret to elevating your trading from inconsistent guesswork to a disciplined, data-driven process lies in synthesis and strategy.
True mastery isn't about finding a single "magic" indicator. It's about building a robust system where multiple, non-correlated indicators work in harmony to provide confluence. When your trend, momentum, and volume indicators all point to the same conclusion, your trade thesis becomes exponentially stronger. This is the core principle that separates consistently profitable traders from the rest.
Memorizing indicator definitions is easy; applying them under pressure is the real challenge. The path forward requires a deliberate, structured approach. Start small and build complexity gradually.
Here is a practical, step-by-step plan to integrate these tools into your daily routine:
Imagine you see a potential bullish reversal. The price has just bounced off a key 61.8% Fibonacci retracement level, a historically strong support zone. This is a good start, but it's just one piece of the puzzle.
Now, you look at your other indicators. You notice the Stochastic Oscillator is crossing up out of the oversold region, signaling building momentum. Simultaneously, the On-Balance Volume (OBV) is starting to tick upward, showing that "smart money" is accumulating positions. Each signal validates the others, building a powerful case for a high-probability trade. This is the essence of trading with confluence.
Key Insight: A single indicator provides a suggestion. A confluence of multiple, independent technical indicators provides a high-probability setup. Your job as a day trader is to hunt for these setups, not to act on every isolated signal.
This methodical approach transforms you from a reactive gambler into a proactive strategist. You are no longer just clicking buttons based on a squiggly line; you are executing a well-defined plan based on a convergence of evidence. Mastering this process with technical indicators for day trading is what builds consistency and, ultimately, long-term profitability. The journey requires patience and discipline, but armed with this knowledge, you are now equipped to navigate the markets with far greater precision and confidence.
Ready to supercharge your trading strategy and save hours on analysis? EzAlgo integrates directly into your TradingView charts, providing AI-driven buy/sell signals that act as the ultimate confirmation for the indicator setups you've just learned. Let our algorithms validate your high-probability trades in real-time by visiting EzAlgo today.


%201.svg)