


The ABCD trading pattern is one of the first harmonic patterns many traders learn, and for good reason. It’s a simple but powerful tool that helps you spot potential price reversals by mapping out the market's natural rhythm. Visually, it looks like a lightning bolt on your chart, marking four key points (A, B, C, and D) that signal where a trend might be about to run out of gas and turn around.

Think of the market as a dance between buyers and sellers. The ABCD pattern lets you see the steps of that dance, helping you anticipate the next big move. As one of the most fundamental harmonic patterns, it provides a clear roadmap for identifying trend exhaustion.
But it's not just a random shape. The pattern’s real magic lies in the specific mathematical relationships between each price swing, all grounded in Fibonacci ratios. This structure gives traders a disciplined, rule-based framework for finding high-probability reversal points, taking a lot of the guesswork out of the equation.
So, what makes up this pattern? It’s built from four distinct turning points on a price chart, simply labeled A, B, C, and D. These points connect to create three price swings, which we call "legs":
When point D is complete, it marks a high-probability area known as the Potential Reversal Zone (PRZ). This is where experienced traders start looking for an entry. The pattern tells a clear story: an initial impulse, a pullback, and then a final push toward exhaustion.
At its core, the ABCD pattern is a visual representation of the market's natural ebb and flow. By understanding its structure, traders can anticipate trend exhaustion points with greater clarity and confidence.
One of the best things about the ABCD pattern is its versatility. You’ll find it on charts for forex, stocks, crypto, and commodities—it’s a universal principle of market movement. Its reliability comes from those Fibonacci ratios that define the exact relationship between points A, B, C, and D.
In a classic bullish ABCD pattern, the BC leg typically pulls back to either the 61.8% or 78.6% Fibonacci retracement of the AB leg. Then, the CD leg pushes on to hit the 127.2% or 161.8% Fibonacci extension of the BC leg. These aren't just arbitrary numbers; they are key levels where price is statistically more likely to react, often aligning with major support or resistance zones. You can dive deeper into the statistical basis of the ABCD pattern at StockGro to see the data for yourself.
The ABCD pattern isn't a one-size-fits-all signal. It has two distinct personalities, and each one tells you a completely different story about where the market might be headed next.
Think of them as two different road signs. One signals a potential U-turn to the upside, while the other warns of a sharp drop ahead. Learning to tell them apart is the first real step to using this pattern effectively.
A bullish setup typically shows up after a downtrend, hinting that the sellers are losing their grip and buyers are getting ready to step in. On the other hand, a bearish setup forms after a strong rally, suggesting that the buying frenzy is fading and a price drop could be coming.
With a bit of practice, their unique shapes become easy to spot.
This chart shows the classic look of both patterns.
Notice how the bullish pattern looks like a downward "lightning bolt," while the bearish one forms an upward bolt. Each one points to a potential reversal right at point D.
The bullish ABCD pattern is your cue to start looking for buying opportunities. It carves out a descending zig-zag on the chart, signaling that a downtrend is probably running out of gas and a reversal higher is on the table.
Picture a ball bouncing down a flight of stairs. It hits a step (A), bounces up a bit (B to C), then drops to a final, lower step (D) before it finally gets enough energy to bounce back up the stairs. That’s the basic idea here.
Here’s the structure you're looking for on your chart:
That final point, Point D, is where the pattern completes. This area is called the Potential Reversal Zone (PRZ), and it's where traders anticipate the downtrend will die out. This is your spot to watch for confirmation to go long (buy).
Flipping the script, the bearish ABCD pattern is a warning sign that a rally is losing steam and a move lower is likely. This pattern looks like an ascending "lightning bolt" and signals a potential chance to sell or short the asset.
Imagine a rock climber scaling a cliff. They make a strong push up (A to B), take a breather by climbing down a little (B to C), then make one last push to a new peak (D) before they get too tired and have to head back down.
To spot a bearish setup, you need to see this sequence play out:
Once the price hits Point D, the pattern is complete. This zone is the PRZ where traders expect the uptrend to fail, offering a high-probability spot to look for an entry to go short (sell).
The core difference is simple: a bullish ABCD pattern makes lower lows (D is below B), signaling an end to a downtrend. A bearish ABCD pattern makes higher highs (D is above B), signaling an end to an uptrend.
One key detail separates a high-quality ABCD pattern from a weak, unreliable one: symmetry.
In a perfect world, the price move and the time it takes to form the AB leg would be almost identical to the price move and time taken for the CD leg. This is what traders mean when they say "AB=CD."
When the length and duration of these two legs are in harmony, it suggests a balanced, rhythmic market structure. This symmetry is a powerful confirmation that the pattern is valid and seriously boosts the odds of a reversal at Point D.
While you'll rarely find perfect symmetry, the closer the AB and CD legs are to being equal, the more reliable the signal becomes.

Spotting that classic zig-zag shape is just the first step. The real magic of the ABCD pattern—the part that separates a weak signal from a high-probability trade—lies in the mathematical relationships between each leg. This is where Fibonacci ratios come into play.
Think of Fibonacci as the underlying blueprint for the market's natural rhythm. By applying these specific measurements, you can confirm whether a pattern is legitimate or just random noise. It’s the difference between guessing and making a calculated, disciplined trade.
This validation process takes the emotion and guesswork out of the equation. You're no longer just thinking a pattern looks right; you're proving it with objective, data-driven rules.
The first real checkpoint for a valid ABCD pattern is the BC leg. This leg is the pullback, the market taking a breath after the initial AB move. But how deep should that pullback be? It’s not random.
For a high-quality setup, the BC leg should retrace to a specific Fibonacci level of the AB leg. The two most important levels to watch for are:
While you might see shallower retracements to 38.2% or 50% in really aggressive trends, the sweet spot for most reliable patterns is that 61.8% to 78.6% zone. If the price action falls short or blows past this area, the pattern's structural integrity starts to weaken, and the signal becomes far less reliable.
Once you've confirmed a valid BC retracement, the next job is to figure out where the pattern will complete. This is Point D, the Potential Reversal Zone (PRZ) where you’ll be looking to enter your trade. We find this zone by projecting Fibonacci extension levels from the BC leg.
The two primary extension levels you'll be watching are:
Simply draw your Fibonacci extension tool from point B to C, and these levels will give you a precise price zone to watch. This is where the market is most likely to run out of steam and reverse. For a full refresher on using these tools, check out our guide on Fibonacci retracement and extension levels.
The beauty of the ABCD pattern isn't just its shape; it's the harmony of its Fibonacci ratios. A valid pattern will almost always see the BC leg retrace to 61.8% or 78.6% of AB, and the CD leg extend to 127.2% or 1.618% of BC.
To help you internalize these rules, here's a quick reference table.
This table outlines the critical Fibonacci retracement and extension levels that define a valid ABCD trading pattern, helping traders confirm setups with precision.
These aren't just loose guidelines; they are the core components that give the ABCD trading pattern its predictive edge.
When you master these ratios, you stop chasing every zig-zag on the chart and start focusing only on the setups that have a high probability of success. It completely transforms your trading from a game of chance into a methodical, rule-based discipline.
Knowing the theory behind the ABCD pattern is one thing, but making money with it is another entirely. So, let's get practical. How do you actually take this knowledge and turn it into a repeatable trading plan?
The goal here is to build a simple, disciplined framework. Following a clear set of rules for finding the pattern, entering the trade, and managing your risk is what separates consistent traders from gamblers. This is how you move from just seeing a setup to confidently pulling the trigger.
First things first, you need to train your eyes to spot that classic "lightning bolt" shape on a price chart. You're looking for a strong initial move (the AB leg) followed by a clear, but smaller, pullback (the BC leg).
Once you think you've found one, it's time to vet it. Don't just trade any zig-zag you see. Pull out your Fibonacci retracement tool and measure the AB leg. For the pattern to be worth your time, the BC leg needs to pull back to at least the 38.2% level.
Ideally, you want to see that turning point happen somewhere between the 61.8% and 78.6% Fibonacci levels. This is your first and most important filter—it helps you weed out random noise and focus only on structures with real potential.
Okay, you've confirmed a valid BC retracement. Now the question is, where will this pattern likely end? You need to find the Potential Reversal Zone (PRZ), which is just a technical name for point D.
There are two main ways to pinpoint this zone:
First, use the Fibonacci extension tool on the BC leg. The most common targets for point D are the 127.2% and 161.8% extension levels. These prices give you a specific area to watch for the final CD leg to run out of steam.
Second, for extra confirmation, measure the length of the AB leg and project that same distance from point C. In a perfect world, you get a symmetrical "AB=CD" pattern where both legs are equal. When this AB=CD measurement lines up with one of your Fibonacci extension levels, you've found a high-probability reversal spot.
A high-confidence PRZ isn't a single price point. It's a tight cluster where multiple measurements converge. When a Fibonacci extension and an AB=CD projection point to the same area, that's a powerful signal that a reversal could be coming.
When the price finally enters your PRZ at point D, it’s go-time. This is where a solid plan is non-negotiable if you want to manage risk and lock in profits. Your plan needs three simple parts:
Entry: Place your order only when you see signs of a reversal within the PRZ. For a bullish ABCD, you're looking to buy. For a bearish one, you're looking to sell. The key is patience—don't jump the gun before the pattern actually completes at point D.
Stop-Loss: As soon as you're in the trade, set your stop-loss. This is your safety net. For a bullish setup, place it just below point D. For a bearish one, it goes just above point D. This defines your maximum loss if the trade goes against you.
Profit Targets: Know where you're getting out before you get in. A common strategy is to set targets at the 38.2% and 61.8% Fibonacci retracement levels of the entire A-to-D move. For a quicker, more conservative trade, you could even aim for the price level of point C as your first target.
This image breaks down the entire process from start to finish.
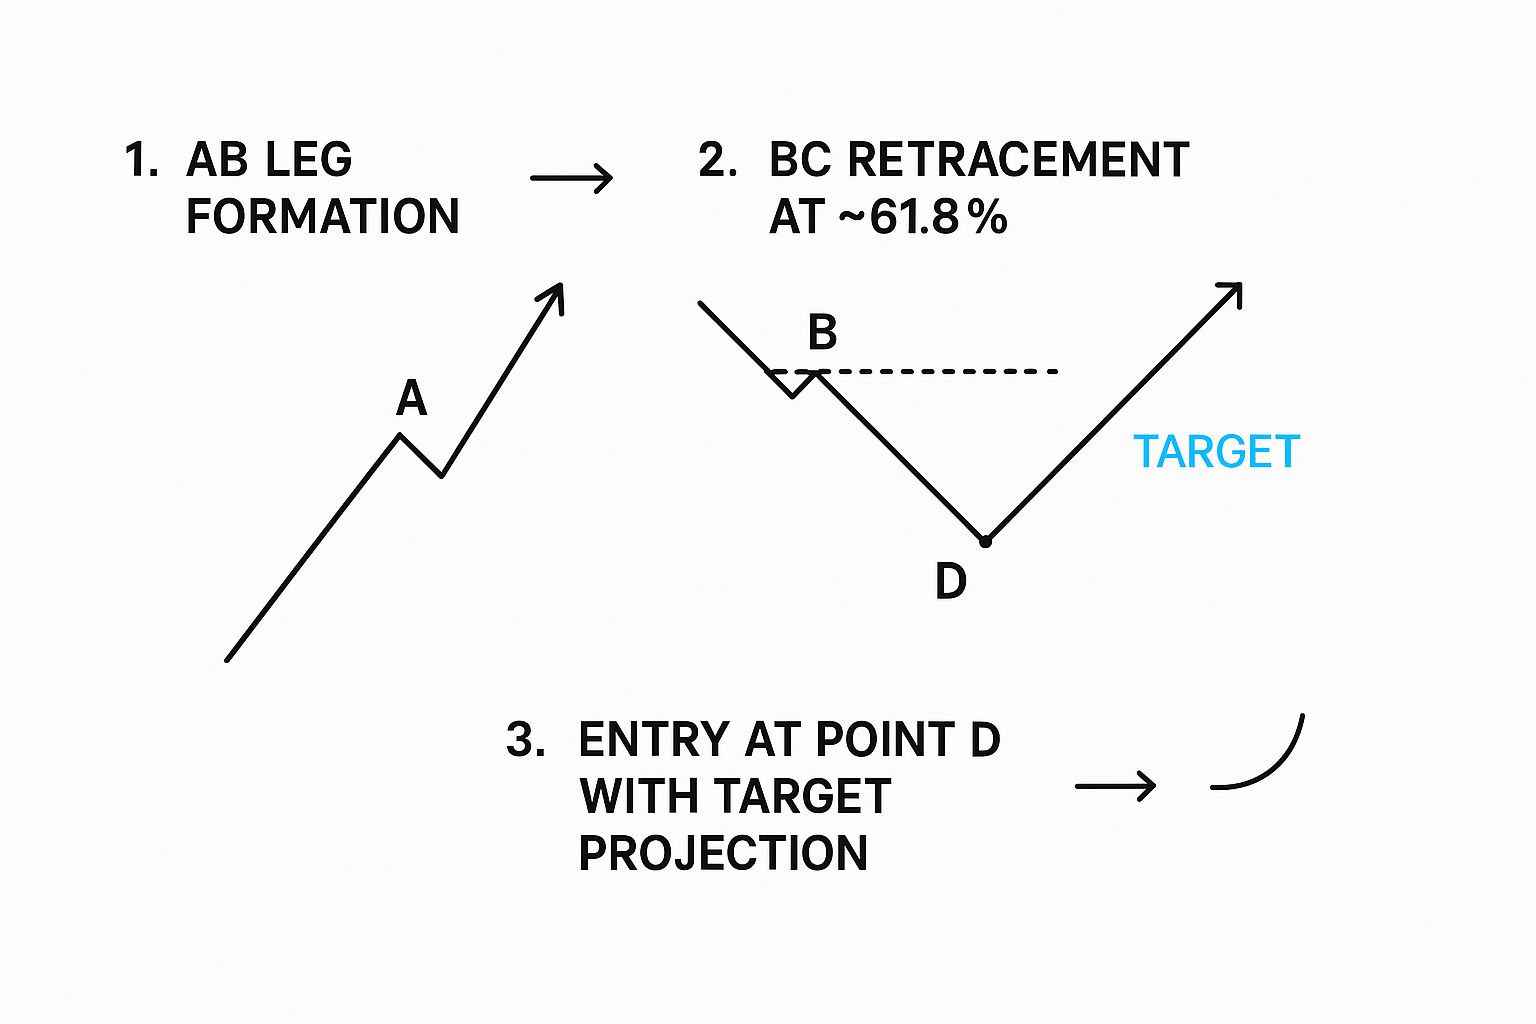
As you can see, the pattern's structure and its Fibonacci ratios give you everything you need: a clear entry signal, a logical place for your stop, and predefined targets for taking profit.
By applying these clear rules for trade entry, exit, and risk management, traders can systematically approach the market. When you enter a long position at point D of a bullish ABCD pattern, you’re not guessing; you’re acting on a harmonic sequence confirmed by specific ratios. As discussed on TioMarkets, these clear rules improve trading outcomes by taking emotion out of the equation.

Knowing the rules of the ABCD pattern is a great first step, but the real key to success is understanding what not to do. It’s easy to get excited and jump the gun, but avoiding a few common pitfalls can be the difference between a winning trade and a frustrating loss.
Let's break down the most frequent errors traders make and how you can steer clear of them.
This is a classic rookie mistake. In an effort to find a trade, you start seeing patterns that aren't really there. You connect a few swing points that vaguely look like an ABCD, even though the proportions are off and the structure is weak.
A high-quality ABCD pattern should jump out at you. If you have to squint and force the lines to fit, it's not a trade you should be taking. The best setups are obvious and meet the specific Fibonacci criteria without any guesswork.
Trading the ABCD shape by itself is like sailing without a compass. It might look good, but you're missing crucial information. The pattern becomes exponentially more reliable when it's confirmed by other signals—a concept known as confluence.
Think of it as gathering evidence. A high-probability setup is one where point D aligns with other major technical factors.
This one is probably the most costly mistake of all: jumping into the trade before the pattern is even complete. Traders see the price getting close to the D completion point and enter out of FOMO (fear of missing out).
This is a massive error. The entire premise of the pattern is that a reversal will happen at a specific price zone. Entering before the price even gets there is just gambling.
The discipline to wait is what separates professional harmonic traders from amateurs. The setup isn't valid until the price action confirms it at the D point. Anything else is just a guess.
By waiting for the price to hit your zone and react, you dramatically stack the odds in your favor. If you want to dive deeper into building solid trading habits, check out our guide on common beginner mistakes in stock trading.
To help you remember these key points, here’s a quick comparison of what to avoid versus what to aim for.
By actively avoiding these blunders, you'll find your accuracy with the ABCD pattern improves significantly. It’s not just about spotting the shape; it's about trading it with discipline and a complete plan.
Even with the best trading plan, questions always pop up when you're trying a new strategy for the first time. Getting clear answers helps build the confidence you need to trade the ABCD pattern well. Let's tackle the questions I hear most often from other traders.
The beauty of the ABCD pattern is its versatility—it shows up everywhere. You'll find it on a 1-minute chart if you're scalping and on a weekly chart if you're swing trading for the long haul. The fundamental structure and Fibonacci ratios don't change.
That said, patterns on higher timeframes, like the 4-hour or daily, tend to be more powerful. They cut through the market "noise" of lower timeframes, giving you cleaner, more reliable signals. If you're just starting out, I'd suggest sticking to the 1-hour or 4-hour charts. It gives you more breathing room to analyze the setup without feeling rushed into a decision.
No chart pattern works 100% of the time, and anyone who tells you otherwise is selling something. The ABCD pattern's reliability shoots up when you find it in the right context. It’s not just about seeing the shape; it’s about the quality of the entire setup.
A high-probability setup is one where the pattern has clean symmetry (the AB leg is nearly identical to the CD leg), completes at a major support or resistance zone, and gets a nod from another indicator, like an RSI divergence.
On the flip side, the pattern is pretty useless in choppy, sideways markets where there’s no clear trend. This is why risk management is non-negotiable. Even the most perfect-looking setup can fall apart.
Yes, absolutely. The ABCD pattern is rooted in market psychology—the natural ebb and flow of fear and greed—which is the same no matter what you're trading. It works across any market with enough liquidity.
This includes:
The rules for spotting, confirming, and trading the pattern are the same whether you're looking at a crypto chart or a blue-chip stock. Just make sure to adjust your position size and risk strategy to match the volatility of whatever you're trading.
Ready to stop guessing and start trading with data-driven precision? EzAlgo equips you with AI-powered signals, real-time momentum alerts, and automated key levels directly on your TradingView charts. Eliminate emotional errors and gain a technical edge in any market. Get started with EzAlgo today.


%201.svg)