


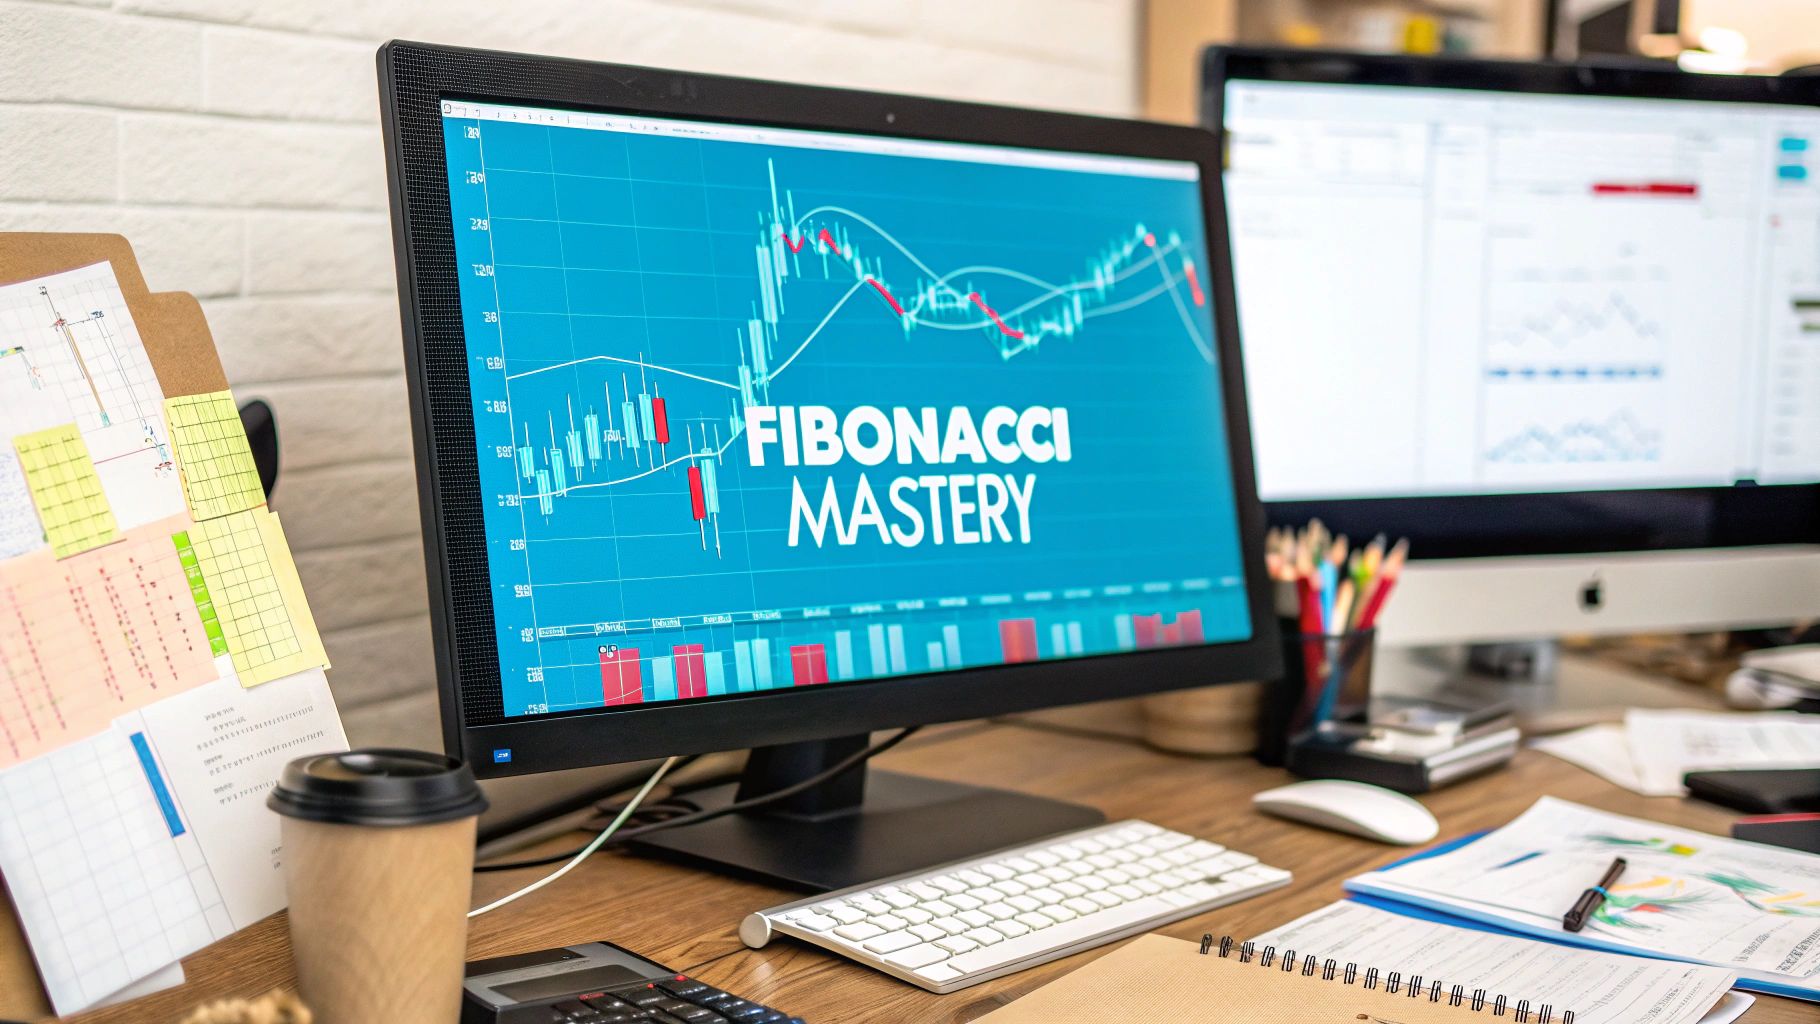
Think of Fibonacci retracement and extension levels as a roadmap for your trades. These are simply horizontal lines drawn on a chart that highlight potential areas where the price might stop, reverse, or find its next target.
At their core, retracement levels help predict where a price pullback might stall, while extension levels project how far the price might run after that pullback.
If you're new to Fibonacci, welcome! You've just stumbled upon one of the most powerful tools in technical analysis. It all boils down to a fascinating number sequence that brings a surprising amount of clarity to the often chaotic world of market charts.
The fundamental truth is that markets rarely move in a straight line. They zig and they zag. After a big surge up or a sharp drop down, prices tend to pull back, or "retrace," a portion of that initial move before carrying on. This is where Fibonacci retracement levels really shine.
The entire tool is built on a few key ratios derived from the famous Fibonacci sequence. These aren't just random numbers; they pop up everywhere in nature, art, and, as many traders have found, right in the heart of market psychology.
The most important ratios you'll encounter are:
By identifying these zones, you can anticipate where buyers might step in during a downtrend or where sellers might emerge during an uptrend.
Essentially, you measure a major price swing from top to bottom (or vice versa), and these ratios instantly draw a grid of potential support and resistance zones. Your blank chart suddenly becomes a strategic map.
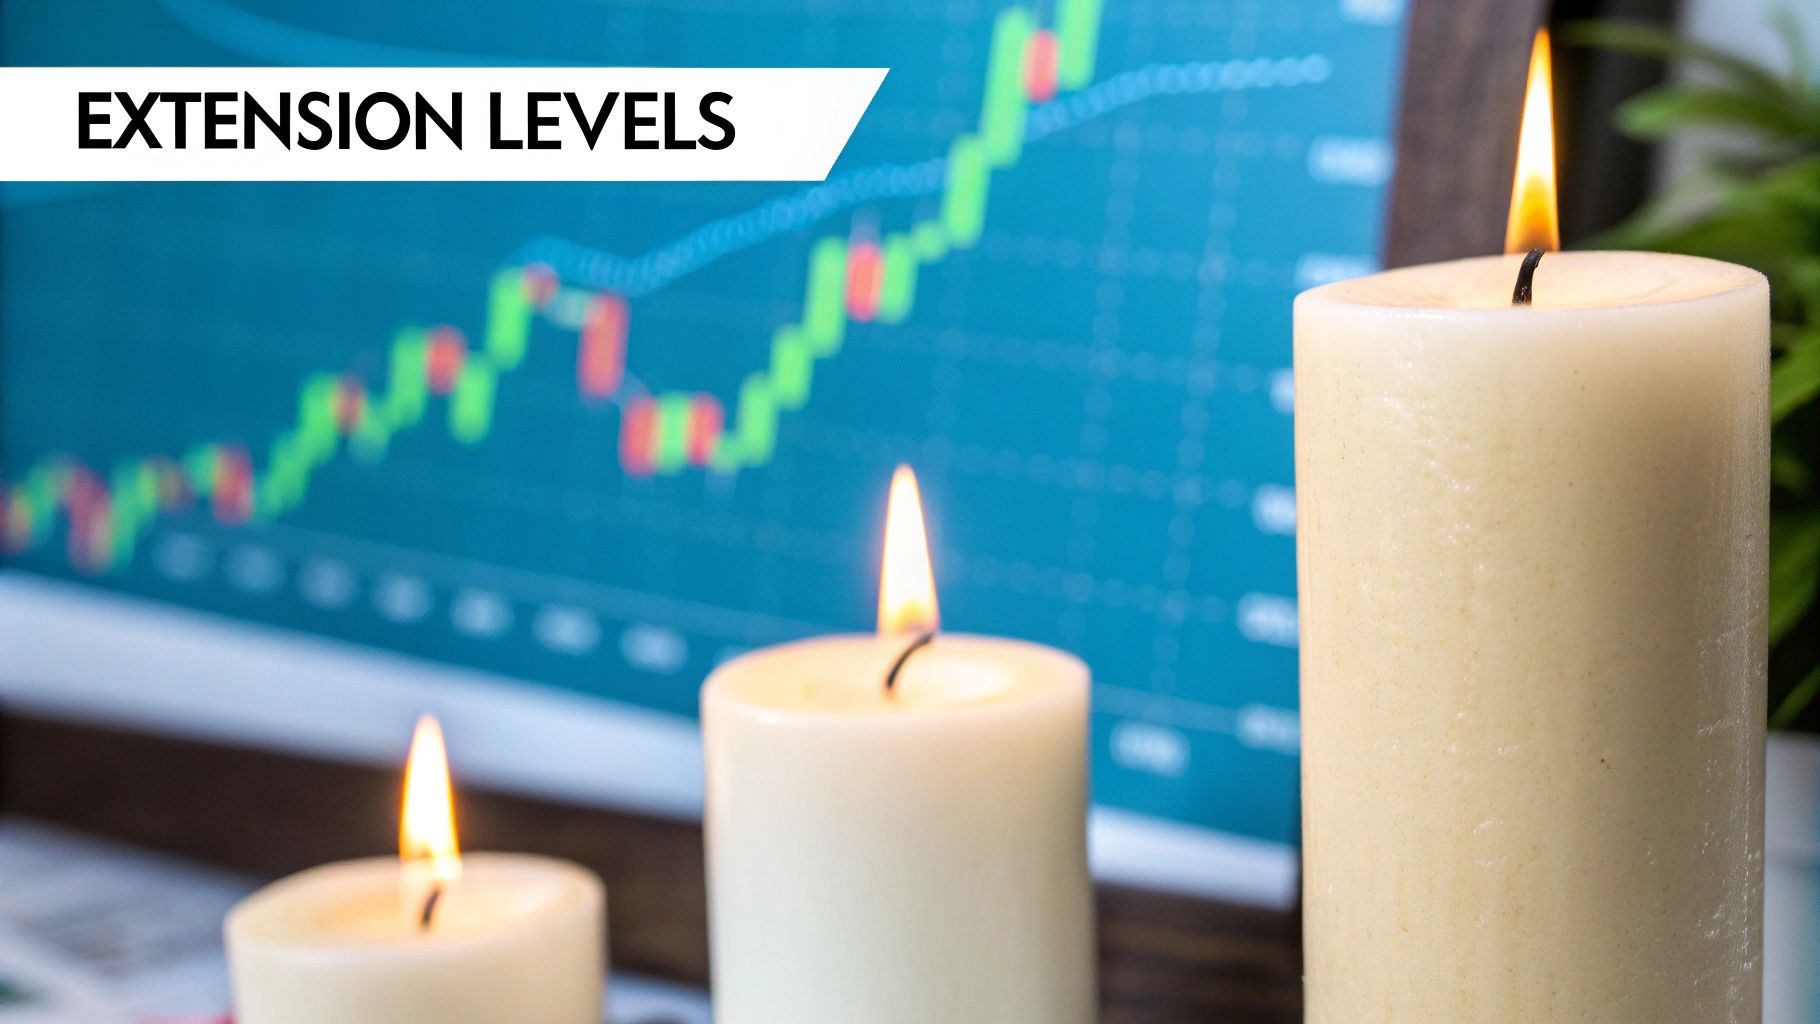
While retracement levels help you find a good entry point during a pullback, Fibonacci extension levels answer a different question: "Where is the price going next?"
They project outward from the initial move to help you set realistic profit targets. Instead of looking for pullbacks, extensions use ratios like 127.2% and 161.8% to forecast how far the next leg of the trend might travel.
To give you a clearer picture, here’s a quick summary of the core ratios and what they typically signify.
Remember, these ratios become most powerful when used alongside other indicators to confirm what you're seeing.
The use of Fibonacci levels in trading isn't new; it has a long and proven history. The key ratios—23.6%, 38.2%, 50%, 61.8%, and 78.6%—are staples in countless trading strategies for a reason. While no tool is perfect, they provide an excellent framework for making more informed decisions. For a deeper dive, you can explore more practical applications in this guide to Fibonacci trading on RJO'Brien.
Getting comfortable with these concepts is your first step toward building a more structured and confident trading plan.
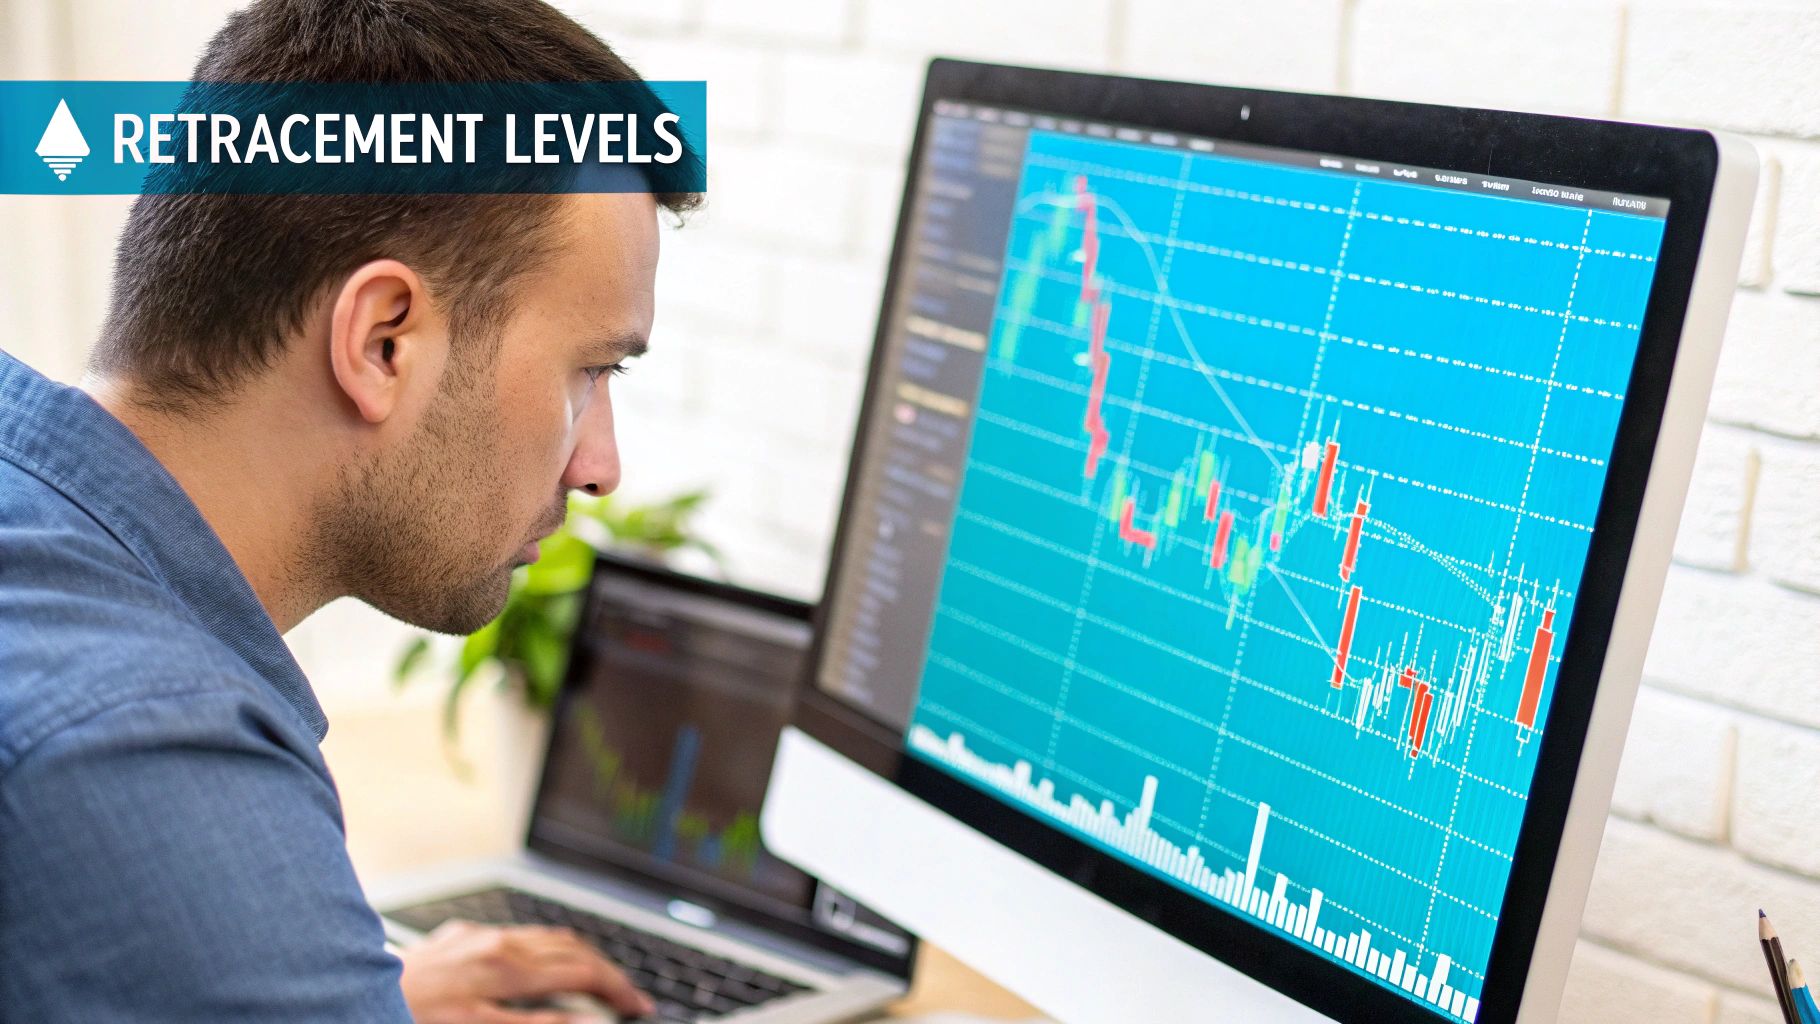
Alright, let's move from theory to what really matters: putting this tool to work on a real chart. Drawing Fibonacci levels is where your skill as a trader comes into play. The process itself is simple, but your results depend entirely on picking the right points to measure.
It all comes down to finding two specific spots on your chart: a swing high and a swing low. These two points bookend a clean, significant price move that you want to analyze for a potential pullback. Thankfully, modern platforms like TradingView handle all the ratio calculations for you. Your only job is to tell the tool where to start and where to stop.
This image shows a trader doing just that—identifying a clear price swing and dropping the retracement tool on it to see where a pullback might find its footing.
As you can see, the core idea is to apply the tool from the beginning of a trend to its end, helping you anticipate where a correction might run out of steam.
So, what are these "swings" we're looking for?
A swing low is simply the lowest point the price hits right before a solid rally kicks off. On the flip side, a swing high is the peak a price reaches just before a major drop. The key here is to ignore the minor, choppy movements. If you focus on small, insignificant wiggles in the price, you'll end up with weak and unreliable levels. You need to train your eye to spot the obvious, substantial trends.
Think of it like this: if a stock shoots up from $100 to $150 without any major dips along the way, your swing low is $100 and your swing high is $150. That $50 move is the price leg you'll be analyzing.
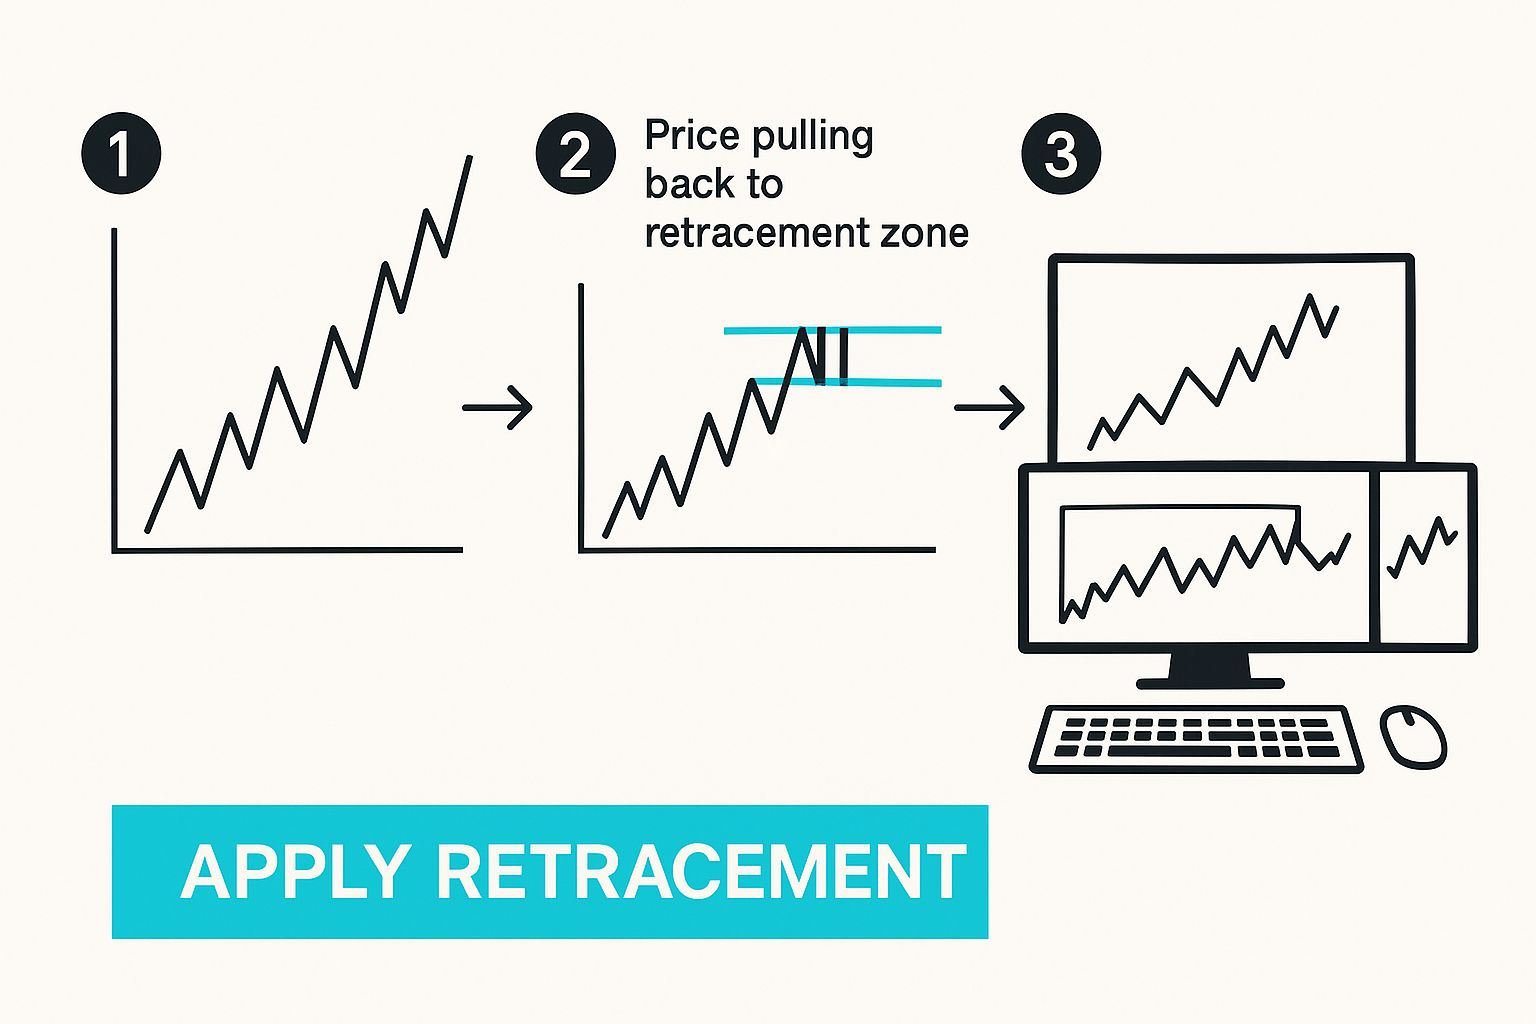
When a market is trending up, it’s making a series of higher highs and higher lows. After a big surge, you can almost always expect a temporary dip. This is the pullback, and it's often a great spot to look for a buying opportunity.
Here’s the step-by-step for drawing your Fib levels in an uptrend:
The software will instantly overlay the key retracement levels (23.6%, 38.2%, 50%, and 61.8%) across that price range. These horizontal lines are your potential support zones—places where a falling price might bounce and resume its climb.
For a more in-depth look, we have a complete guide on how to draw a Fibonacci retracement.
In an uptrend, you're measuring the big move up so you can be ready to catch the corrective dip at a key Fibonacci support level.
For a downtrend, you just flip the whole process on its head. In a bear market, prices are making lower lows and lower highs. Here, you're not looking for a dip to buy; you're looking for a temporary bounce—a retracement—to find a good spot to sell before the price drops further.
Here’s how you draw the levels in a downtrend:
This time, the tool projects the Fibonacci levels as potential resistance zones. Traders will watch for the price to rally up to one of these levels, lose steam, and then potentially enter a short position, betting that the primary downtrend is about to kick back in.
So, you've used Fibonacci retracements to find a great entry point on a pullback. Awesome. But that's only half the battle. Now that you're in the trade and the price is moving in your favor, the million-dollar question becomes: when do I take my profits?
This is where Fibonacci extensions come into play, and frankly, they’re a game-changer.
While retracements measure moves inside a trend, extensions project outward. They help you forecast where the price might be headed next, long after it breaks past its previous high or low. Think of them as a roadmap for your trade, showing you potential destinations where the momentum might run out of steam.
Having this kind of forward-looking guide helps you set logical, data-driven profit targets. It’s the difference between exiting a trade based on a gut feeling and exiting based on a plan.
Just like their retracement cousins, extension levels are all based on ratios from the Fibonacci sequence. The main difference is that since we're projecting beyond the initial move, the ratios are greater than 100%. These levels are common stopping points where a trend’s energy can start to fade.
Here are the big three that every trader watches:
By plotting these levels on your chart ahead of time, you can set "take-profit" orders and walk away. You’ll have a clear, objective exit plan from the moment you enter the trade. If you want to dive deeper, there are some great guides on using Fibonacci extension levels for profit targets that can help you dial in your exit strategy.
Drawing extensions is a little different than drawing retracements. It takes three clicks, not two, because you need to define the entire price structure: the initial move and its pullback.
Let's walk through it for an uptrend:
That’s it! Your trading platform will automatically project the extension levels upward from your third click. Those lines you see—at 127.2%, 161.8%, and so on—are your potential profit targets.
For a downtrend, just flip the logic: start at the swing high (Point 1), drag down to the swing low (Point 2), and then click on the retracement high (Point 3). The extension levels will then point downward.
What you're really doing with those three points is measuring the size of the first impulse wave (from Point 1 to 2) and then projecting that same distance from the end of the correction (Point 3) to see where the next wave might end.
This simple method takes the guesswork out of taking profits. By identifying these high-probability zones where the price is likely to react, you build a much more complete and robust trading plan. It ensures you not only know when to get in but, just as importantly, when to get out and lock in your gains.
Knowing how to draw Fibonacci levels on a chart is just the first step. The real skill lies in turning those lines into a profitable trading strategy. Here's the secret: Fibonacci levels rarely work in a vacuum. Their true power comes alive when you combine them with other technical analysis tools.
Think of a single Fibonacci level as a hint from the market—a suggestion of where the price might turn. But when that same level lines up with another powerful indicator, that hint becomes a high-probability signal. This overlap is a concept traders call confluence, and it’s the bedrock of a professional trading approach.
Confluence is what happens when multiple, independent technical signals all point to the same conclusion in the same price area. It’s like getting a second, third, or even fourth opinion that confirms your initial trade idea. This layering of evidence is what can dramatically stack the odds in your favor.
For instance, seeing the price pull back to the 61.8% Fibonacci retracement level is interesting on its own. But what if that same 61.8% level is also a major historical support zone? And what if the 200-day moving average is sitting right there, too? Now you don't just have a line on a chart; you have a powerful confluence zone. An area like this is far more likely to produce a strong bounce than any of those indicators would by themselves.
Here's another crucial piece of the puzzle: never jump into a trade just because the price has touched a Fibonacci line. That’s just guessing. Instead, you need to wait for the price action itself to confirm that the level is holding. Let the market show you its hand through candlestick patterns.
A few classic confirmation signals to watch for include:
By waiting for one of these patterns to form, you’re getting real proof that other traders see the same level you do. This validates your idea before you put any capital on the line.
The most effective traders don't predict what the market will do. They wait for the market to signal its intentions at key levels, and then they act on that confirmation.
A confluence-based approach helps you filter out low-quality setups and focus only on the trades with the highest probability of success. The checklist below gives you a simple framework for identifying these powerful opportunities.
Using this checklist helps ensure you are not trading based on a single indicator. When two or more of these signals align at a key Fibonacci level, your confidence in the trade setup should increase significantly.
The effectiveness of Fibonacci levels isn't just trading folklore; it's backed by real market behavior. A statistical analysis of the Indian equity market, for example, found that stocks tend to pull back to one of the main Fibonacci levels about 70% of the time.
Even more telling, around 60% of major price reversals occurred near the critical 61.8% retracement level, cementing its reputation as a key zone to watch. A perfect real-world example was the massive market correction in March 2020, where the Nifty 50 index bottomed out almost precisely at the 61.8% Fibonacci level before kicking off its historic recovery. For a deeper dive into these stats, you can find more on the historical success rate of Fibonacci retracements on Alphashots.ai.
This data shows exactly why building strategies around confluence and confirmation is so powerful. The levels themselves are statistically relevant, and when you combine them with other signals, you create a truly robust framework for making smarter trading decisions.
Fibonacci tools can be incredibly powerful for mapping out potential support and resistance, but like any tool in a trader's kit, they're only as good as the person using them. It's easy to fall into a few common traps, especially when you're just starting out. Knowing what these pitfalls are is the first step to avoiding them and using Fibonacci retracement and extension levels like a pro.
The biggest mistake I see is treating Fibonacci levels as some kind of magic, standalone system. They aren't a crystal ball. Just because the price pulls back to the 61.8% level doesn't mean you should automatically slam the buy or sell button. Think of it as an alert—a heads-up that the price is entering a zone where a reversal is more likely, not guaranteed.
Relying on these levels alone without looking for other clues is a fast track to frustration. The sharpest traders use Fibonacci as one piece of a much larger puzzle.
If you want to get weak, unreliable signals, here’s how: zoom way into your chart and start drawing Fibonacci levels on every tiny little price wiggle. You'll end up with a chart so cluttered with lines it becomes useless.
For strong, meaningful levels, you have to identify the major swing high and swing low—the significant move that really defines the trend. You're trying to map the main journey, not every little scenic detour along the way. Your analysis will only ever be as strong as the price swing you choose to measure.
"The quality of your Fibonacci analysis comes down to the quality of the swing points you pick. Weak swings give you weak levels. Major market moves, on the other hand, show you the zones the big players are actually watching."
Another classic error is trying to force Fibonacci tools to work in the wrong market environment. These tools shine in trending markets. They're built to pinpoint potential pullbacks in a clear uptrend or downtrend. When you try to apply them to a market that's just chopping back and forth in a sideways range, you're setting yourself up for failure.
In a ranging market, there's no real momentum. Prices are messy and unpredictable. Fibonacci levels drawn in this kind of environment will probably just get ignored, leading to one false signal after another. Before you even think about pulling out a Fibonacci tool, ask yourself: is this market actually going somewhere?
Confirmation bias is a trader's worst enemy. It’s that human tendency to look for evidence that confirms what we already believe and to ignore anything that contradicts it. A trader who’s feeling bullish might only focus on Fibonacci support levels while completely overlooking obvious signs of weakness. On the flip side, a bearish trader might fixate on resistance levels and dismiss clear bullish reversal patterns.
To use Fibonacci levels the right way, you have to stay objective. Here's how:
By consciously avoiding these mistakes, you’ll stop guessing and start using Fibonacci as a strategic part of a well-rounded trading plan.
Drawing Fibonacci levels by hand is a fantastic way to learn the ropes, but let's be honest—it can be a real drag. It’s not just time-consuming; it's also subjective. You and another trader could look at the same chart, pick slightly different swing points, and end up with completely different levels.
This is where smart trading tools like EzAlgo completely change the game. They take all the guesswork out of the equation.
Instead of you squinting at the chart trying to pinpoint the perfect swing high and low, these platforms automatically scan for the most important price moves. They then plot the key Fibonacci levels with machine-like precision, making sure you’re always working with the most relevant market structure. This frees you up to focus on what really matters: your strategy and your execution.
The real magic happens when you start layering these automated Fibonacci levels with other indicators, like buy and sell signals. This creates a powerful, two-step confirmation system that helps weed out weak or unreliable trade ideas.
Think about it. The price pulling back to a key Fibonacci support level is interesting on its own. It's a potential opportunity.
But what if a bright, clear EzAlgo buy signal pops up right in that same Fibonacci zone? Suddenly, that "maybe" trade becomes a high-conviction setup. You're no longer just trading off a potential support level; you're acting on a level that has been validated by an algorithm telling you that buying pressure is kicking back in.
This one-two punch works so well because it combines two distinct analytical angles:
When you get both to line up, the argument for taking the trade becomes incredibly strong.
By waiting for a buy or sell signal to appear at a critical Fibonacci level, you transform a speculative idea into a data-driven, high-conviction trading setup. This systematic approach helps eliminate emotional decisions and fosters discipline.
One of the toughest parts of trading is being chained to your screen. You can't watch the market 24/7, and it’s way too easy to miss a perfect entry just because you stepped away for a few minutes. Automated tools solve this problem with alerts.
For instance, you can set an alert to ping you the second the price touches a key Fibonacci zone, like the Golden Pocket (between the 61.8% and 66% levels).
But you can get even smarter. Imagine setting up an alert that only goes off if the price enters that zone and a corresponding buy or sell signal prints. This ensures you're only being notified of A+ setups, giving you the freedom to live your life without the fear of missing the next big move.
Even after you get the hang of drawing Fibonacci lines, some questions always seem to pop up. Let's tackle some of the most common ones so you can start using these tools with more confidence.
This is a great question, and the short answer is... kind of. It's one of the fascinating quirks of the market.
Think about it: millions of traders, from small retail accounts to massive institutional funds, are all staring at the exact same Fibonacci retracement and extension levels. When the price approaches a major level like the 61.8% mark, a flood of buy or sell orders often gets triggered automatically. That huge wave of activity is what makes the price bounce, which in turn makes the level look important.
So yes, their popularity definitely helps make them work.
If you had to pick just one, it's the 61.8% retracement level. Many traders call it the "Golden Ratio" for a reason. In a healthy trend, this level often acts as the last line of defense during a pullback.
A solid bounce off the 61.8% line is a classic sign that the original trend is about to kick back into gear. In fact, many seasoned traders will patiently wait for the price to test this specific zone before even thinking about making a move.
But don't get tunnel vision on the 61.8% level. Context is everything. A shallow dip to 38.2% might mean the trend is incredibly strong, while a deep dive to 78.6% could be a warning that the trend is running out of steam.
Absolutely. This is where Fibonacci analysis truly shines—its flexibility. The patterns of human psychology and market movement that these levels tap into are universal.
That means you can confidently use fibonacci retracement and extension levels whether you're trading:
The only rule of thumb is to use them when the market is clearly trending up or down. They lose their magic in choppy, sideways markets where there's no clear direction.
Ready to stop guessing where to draw your lines? EzAlgo automatically plots these key levels and gives you clear buy and sell signals to back up your decisions. It’s a simple way to get a powerful edge. Find a smarter way to trade with EzAlgo.


%201.svg)