


The rising wedge pattern is one of those classic chart formations that every trader should know. It’s a tell-tale sign that a bullish run is losing steam and a bearish reversal could be just around the corner.
Think of it like a story playing out on your chart. The market is climbing, but each push higher gets a little weaker, a little more tired. It’s a visual cue that the upward climb is exhausting itself, hinting that a fall might be coming.
At its core, the rising wedge shows a battle between buyers and sellers where the buyers are slowly losing their grip.
Imagine a ball being squeezed into a corner. The price action gets tighter and tighter, confined by two rising trendlines that are moving closer together. The upper line connects the series of higher highs, and the lower line connects the higher lows.
Even though the price is still inching upward, the momentum is clearly fading. The rallies are becoming shorter, and the pullbacks are getting more significant. This compression signals that the bullish energy is running out, and the bears are quietly building pressure for a takeover. You can find more details on wedge pattern signals on LuxAlgo.com.
This visual "squeeze" is a huge warning sign for anyone in a long position. While the price is technically still making higher highs and higher lows, the shrinking distance between them shows that buying pressure is drying up.
The rising wedge tells a story of fading optimism. Buyers are still pushing the price up, but with less and less conviction, creating a tense setup that often resolves with sellers taking control.
Spotting this pattern early can give you a massive edge, allowing you to anticipate a major market shift before it happens. Let's break down its key components so you can start using it effectively.
Here’s a quick-reference table to help you spot the rising wedge pattern in the wild. Think of it as your cheat sheet for identifying its most important features.
Having these characteristics in mind makes it much easier to distinguish a true rising wedge from simple market noise.

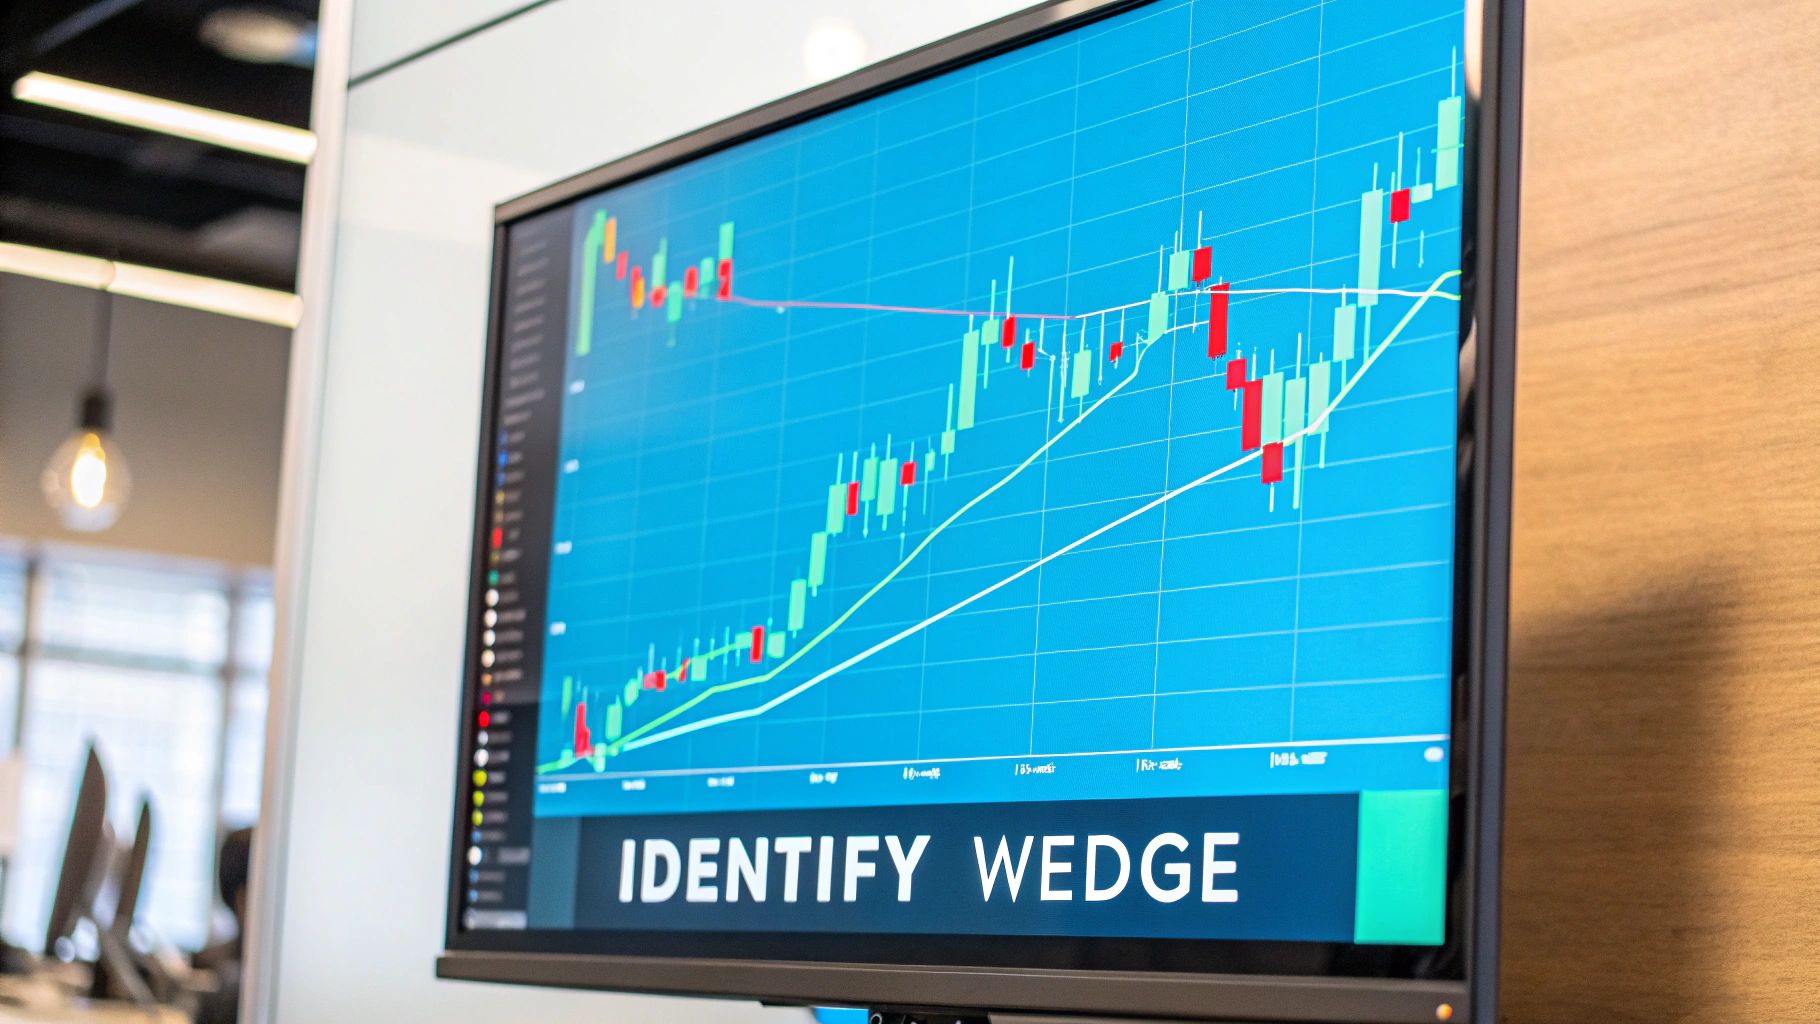
Spotting a rising wedge on a live chart is a bit of an art form, but it's grounded in some very specific technical rules. You're not just looking for any old upward-pointing shape; you need to see the clear anatomy of a pattern that tells a story of bullish power running out of steam.
It all starts with two key trendlines. The first is the upper resistance line, which connects the series of higher highs. Picture this as a ceiling the price keeps nudging against. While the bulls are still pushing the price to new peaks, each new high is a little less impressive than the last.
The second, and arguably more important, piece is the lower support line. This line connects the higher lows, acting as a floor for the price. Here's the critical part: the slope of this support line is steeper than the resistance line above it. This is what creates that classic, narrowing wedge shape.
When that support line starts climbing faster than the resistance line, you get a visual "squeeze" on the price. This tightening action is a dead giveaway that volatility is drying up and buyers are losing their grip. Yes, the price is still technically making higher highs and higher lows, but the shrinking distance between them screams that the bullish momentum is on life support.
Think of it like a spring coiling up—the market is building tension for a big move. The psychology here is a mix of exhaustion and doubt. Early buyers are getting nervous and starting to cash out, while new buyers are getting skittish about jumping in at these highs.
A rising wedge pattern is defined by its converging trendlines, but its story is told by declining volume. The squeeze shows weakening momentum, while the volume confirms it.
The real confirmation—the smoking gun, if you will—is found in the trading volume. In a strong, healthy uptrend, you expect to see heavy volume backing up the rising prices. But with a rising wedge, you’ll almost always see the volume steadily decrease as the pattern forms.
This is a massive red flag. It’s a classic divergence where price is going up, but the participation and conviction are falling off a cliff. It tells you that fewer and fewer traders are willing to buy at these levels. It’s like a car sputtering as it tries to climb a steep hill; the engine is making noise, but it's losing power fast.
The pattern completes when the price finally breaks down through that steep lower support line, usually on a sudden spike in volume. That's the signal that the reversal is on. Getting these lines right is everything, so if you're not confident, take a look at our guide on how to draw a trendline to nail down that fundamental skill.
Every chart pattern isn't just a collection of lines and angles; it’s a living story of human emotion. It's the battle between greed and fear, captured in real-time. The rising wedge tells a classic tale of a market that's losing its nerve—a slow, tense shift from confident buying to creeping doubt.
Think of it as a tug-of-war. At the start of the pattern, the buyers are pulling hard. Optimism is high, and they're easily driving the price to new highs. Every small dip gets bought up instantly, which creates the upward-sloping support line. From the outside, it looks like a healthy, strong uptrend, and it pulls more and more people in.
But then, the story begins to turn. The market's conviction starts to fray at the edges.
While the price is still making new highs, they're becoming less and less impressive. The rallies are shorter, the momentum is gone, and the price action feels heavy. This is the "squeeze" of the wedge, and it’s a visual representation of deep uncertainty.
Early buyers who got in at the bottom are starting to get nervous. They quietly begin to cash out, taking profits and introducing a subtle but constant selling pressure.
This shift from optimism to doubt is a key part of the psychology of a market cycle, where the initial excitement inevitably fades and gives way to anxiety. The once unshakeable bullish belief is now on shaky ground.
A rising wedge tells the story of a market shifting from optimism to doubt. At first, you see higher highs and higher lows. But as the pattern tightens, the buying momentum fades, and selling pressure quietly builds.
Volume is the ultimate lie detector here. When you see volume drying up as the price inches higher, it’s a massive red flag. It tells you that fewer and fewer participants are willing to buy at these elevated levels. The smart money is heading for the exits. You can see more practical examples of this in various analyses of the rising wedge on Tickeron.com.
The final, dramatic break below the lower support trendline is the climax of this story. It's the moment the tension finally snaps. Fear takes over completely.
So, what’s happening behind the scenes during that breakdown?
This perfect storm of selling is why the drop out of a rising wedge can be so violent and swift. It’s the final chapter where the sellers seize control, confirming the bearish reversal the pattern was hinting at all along.
Spotting a rising wedge on your chart is a great start, but that's only half the job. To actually profit from it, you need a solid, repeatable plan. A good strategy takes the guesswork and emotion out of the equation, giving you a clear roadmap for your entry, exit, and risk management.
The single most important rule here? Patience. It's tempting to try and be a hero by shorting the last little rally inside the wedge, hoping to catch the absolute peak. That’s a gamble, not a strategy. Pros wait for confirmation.
This means waiting for a decisive breakdown—a candle that closes with conviction below the lower support trendline. That's your signal. It tells you the sellers are now in control and the pattern is officially in play.
Once you see that confirmed breakdown, you know it's time to act. Some traders will enter a short position right at the open of the next candle. Others prefer to wait for a potential retest, where the price climbs back up to touch the broken support line (which now acts as resistance) before heading down again.
A retest can offer a much better risk-to-reward setup, but be warned—it doesn't always happen. The price might just break down and keep on falling.
Your stop-loss is your safety net, and you should never trade without one. A logical place to set it is just above the last swing high inside the wedge. This way, if the breakdown turns out to be a fake-out and the price snaps back up, your loss is contained and you live to trade another day.
The professional's playbook is simple: wait for the break, confirm the move, and protect your position. Never jump the gun by trying to guess the top of a rising wedge pattern.
This visual gives a great breakdown of why waiting is the smarter play.
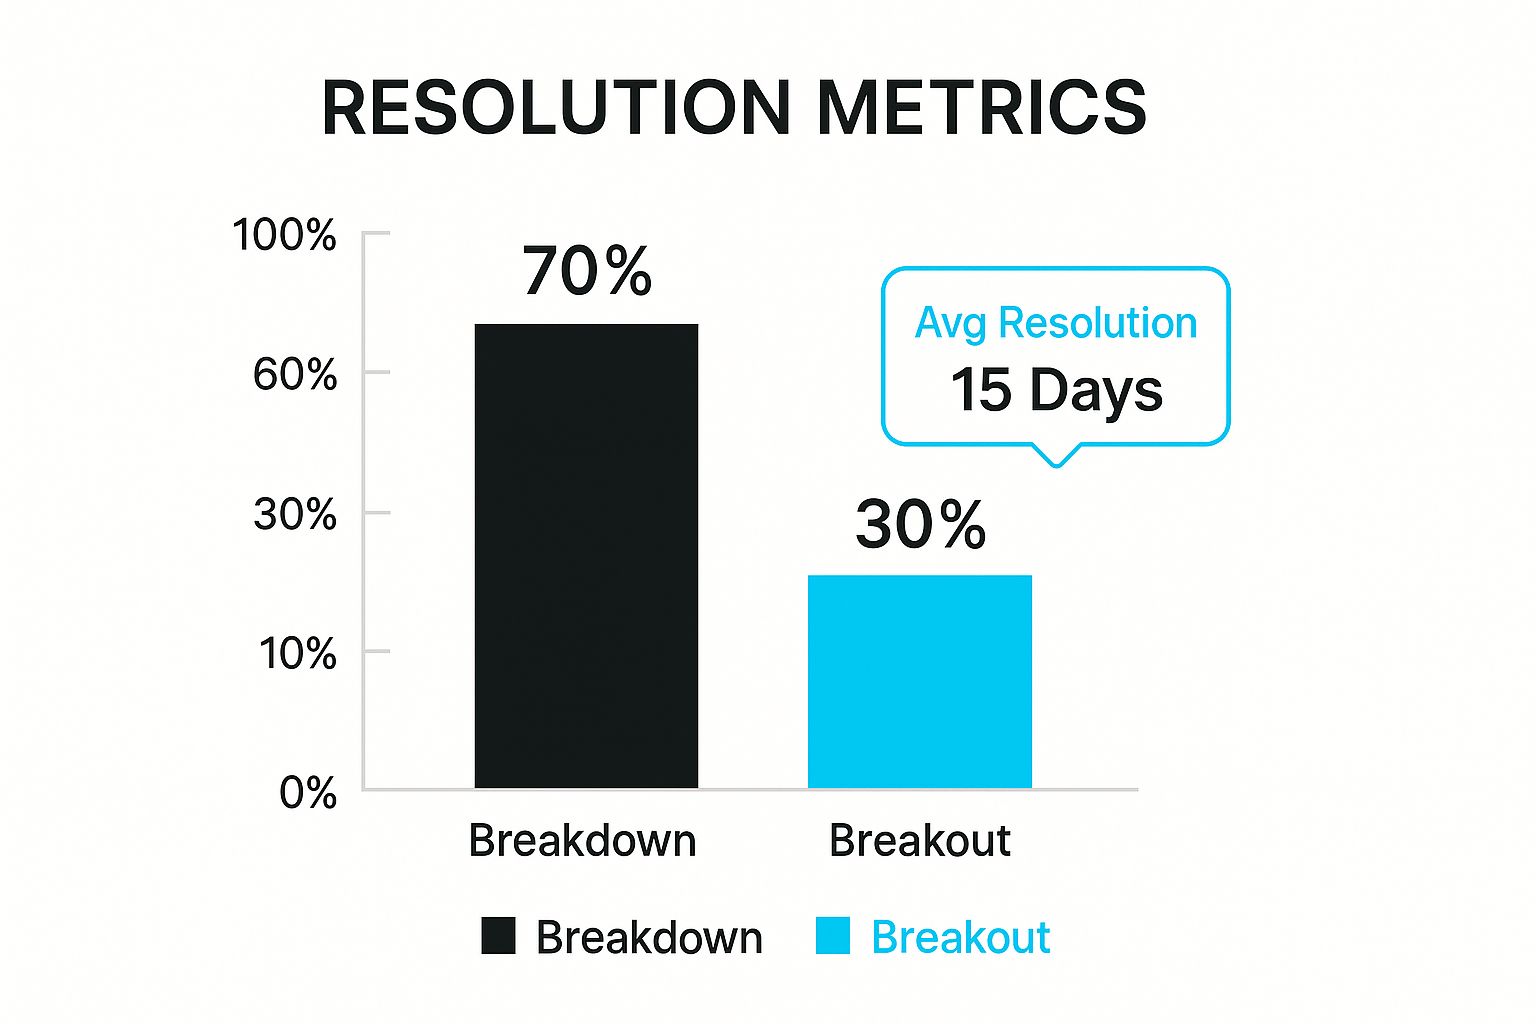
As you can see, the data is clear: a breakdown is the most likely scenario, happening about 70% of the time.
Choosing your entry comes down to your risk tolerance. An aggressive trader might jump in right after the breakdown, while a conservative one will wait for a retest.
Here's a quick comparison of the two approaches.
Ultimately, neither approach is "better" than the other. The right one depends on your personal trading style and how you view the trade's setup.
Knowing where to get in is crucial, but knowing where to get out is how you get paid. For a rising wedge, there are two common methods for setting your profit targets.
The Pattern Height Method: This is a classic technical analysis technique. You measure the vertical distance at the widest part of the wedge (from the first swing high to the first swing low). Then, you project that same distance downward from the point where the price broke the trendline. This gives you a calculated target based on the pattern's own volatility.
Key Support Levels: This one is all about looking left on your chart. Find historical price zones where the asset previously found support—these are old swing lows or areas of consolidation. Buyers stepped in there before, and they are likely to do so again, making these natural spots to take your profits.
The rising wedge has proven to be a surprisingly reliable pattern over time. In fact, multi-year testing shows a success rate of around 81% in bull markets. This means the pattern correctly signals a downward move nearly four out of five times. Typically, it forms over 10 to 50 periods and is often confirmed by declining volume as the wedge tightens, followed by a spike in volume on the breakdown. You can dive deeper into these wedge pattern findings on LuxAlgo.com.
Theory is one thing, but seeing a rising wedge pattern play out on a live chart is where the lightbulb really goes on. This pattern isn't picky; it shows up everywhere. You’ll spot it in individual stocks, major forex pairs, and everything in between because the psychology of fading momentum is universal.
Let's break down a couple of real-world charts to see what I mean.

This chart is a textbook example of a bearish reversal. You can see the price dutifully grinding out higher highs and higher lows, but it’s clearly losing steam. The two trendlines are squeezing closer together, which is a dead giveaway that the buyers are getting tired.
Look at the volume bars at the bottom—they’re shrinking, too. This confirms nobody is really committed to pushing the price higher. When the price finally cracked below that lower support line, it was a fast and sharp drop. That’s the pattern doing its thing.
It’s easy to think that rising wedges only appear at the top of a big bull run to signal a reversal. But they're more versatile than that. They can also pop up in the middle of a downtrend, acting as a "bearish continuation" pattern. Think of it as the market taking a quick breather before heading lower.
A great case study comes from an analysis of Abbott Laboratories (ABT) during a bear market, where analysts found four different rising wedges. The first one didn't quite hit its target, but the next three were spot-on, each one signaling that the bearish trend was about to continue. This is a perfect example of the pattern's reliability in different market environments. You can actually find this specific rising wedge analysis online to dig deeper.
The key takeaway is this: a rising wedge signals exhaustion. Whether that exhaustion flips an uptrend or just pauses a downtrend depends entirely on the bigger picture.
Let's be real—no chart pattern works 100% of the time, and the rising wedge is no different. Sometimes, they fail. A "failed" wedge is when the price does the opposite of what you expect and breaks out to the upside instead of breaking down. It’s less common, but it happens.
This is exactly why discipline and risk management are non-negotiable. An upside breakout completely torches the bearish idea and can trigger a powerful rally, catching anyone who shorted too early in a painful squeeze.
This is why you always wait for a confirmed break below the support line before pulling the trigger on a short trade. It's also why you always set a stop-loss just above the pattern's high. Knowing how a pattern can fail is just as important as knowing how it succeeds. It keeps you trading probabilities, not pipe dreams.
Even after you've got the basics down, the rising wedge can throw a few curveballs. Let's tackle some of the most common questions that pop up when traders are in the thick of it. This will help you clear up any confusion and trade these setups with more confidence.
This is a great question because, at a quick glance, they can look almost identical. Both show price climbing higher, but the story they tell about the market's momentum is completely different. The secret is in the shape of their trendlines.
A bullish channel has parallel support and resistance lines. Think of it like a staircase—the price is climbing in a steady, predictable rhythm. This signals a healthy, sustainable uptrend.
A rising wedge, however, has converging trendlines. The floor (support) is rising faster than the ceiling (resistance), squeezing the price into a tighter and tighter space. This narrowing action is a huge red flag that the buying pressure is running out of steam.
The easiest way to remember it is this: a channel signals trend strength, while a wedge signals trend exhaustion. The converging lines are the market's way of whispering that the buyers are getting tired.
The rising wedge is considered one of the more dependable bearish patterns out there. Time and time again, studies and historical chart data show it has a high probability of breaking to the downside, which is why so many traders love it for finding shorting opportunities. But "high probability" isn't the same as "guaranteed."
No pattern is foolproof, and you should never trade one in a vacuum. To really stack the odds in your favor, always look for extra confirmation:
When you see the pattern and these confirming signals, you've gone from a decent setup to a top-tier trading opportunity.
Absolutely. This is where the pattern shows its versatility. While it’s most famous for being a reversal pattern that kills an uptrend, it can also show up smack in the middle of a downtrend.
When this happens, it acts as a bearish continuation pattern. Think of it as a temporary pause or a "bear market bounce." The bulls try to stage a little rally, but they don't have enough power to really turn things around. The rally is weak, forming that classic, contracting wedge shape.
Once the price breaks down below the wedge's support, it’s a clear signal that the party's over for the bulls. The primary downtrend is back in control, and the breakdown often provides a great spot to re-enter a short position.
The rising wedge is what we call "fractal," meaning you can find it on just about any timeframe you can imagine—from a 1-minute chart all the way up to a monthly one. The psychology of waning momentum and price compression is universal.
That said, the timeframe does change the pattern's significance. A rising wedge that takes months to form on a weekly chart is generally a much bigger deal than one that forms in a few hours on a 15-minute chart.
As a rule of thumb, patterns on higher timeframes tend to lead to bigger, more sustained moves once they break. That’s why many swing and position traders prefer to hunt for them on the 4-hour, daily, and weekly charts to catch the most powerful signals.
Stop relying on guesswork and start trading with data-driven precision. EzAlgo provides AI-powered signals, real-time momentum alerts, and dynamic support/resistance levels directly on your TradingView chart. Eliminate emotional trading and gain your technical edge today.


%201.svg)