6 Powerful Mean Reverting Trading Strategies for 2025
Technical
Educational
Fundamentals
6 Powerful Mean Reverting Trading Strategies for 2025
Posted on
September 17, 2025
In the world of trading, the saying "the trend is your friend" is common advice. But what about when prices stray too far, too fast? This is where mean reverting trading strategies offer a powerful alternative. The core idea is simple: asset prices, over time, tend to return to their historical average or mean. Extreme price moves are often temporary, creating opportunities for traders who can identify when a security is stretched and likely to snap back.
This article cuts straight to the chase, providing a detailed roundup of the most effective and actionable mean reversion techniques. We're moving beyond basic theory to give you a practical playbook. You will learn the specific setup rules, entry triggers, and exit criteria for six distinct strategies, from classic indicator-based approaches to more complex statistical methods.
Forget generic advice. Each section is designed to be a mini-guide, complete with implementation tips and clear examples. Whether you're a technical analyst looking to refine your edge or a retail trader seeking proven, rules-based systems, this guide will equip you with the tools to capitalize on one of the market's most reliable phenomena. Let's explore how to turn price extremes into profitable trades.
1. Bollinger Bands Mean Reversion Strategy
The Bollinger Bands Mean Reversion strategy is one of the most classic mean reverting trading strategies available. Developed by John Bollinger, this technical analysis tool consists of three lines: a simple moving average (SMA) in the middle, and an upper and lower band that are typically set at two standard deviations away from the SMA. The core idea is that asset prices tend to stay within these bands. When the price touches or moves beyond an outer band, it is considered overextended and likely to "revert" back to the average.
This strategy works because the bands dynamically adjust to market volatility. When volatility is high, the bands widen, and when it's low, they contract. This provides a relative definition of "high" and "low" prices. A touch of the upper band suggests the asset is relatively expensive and could be a sell signal, while a touch of the lower band suggests it is relatively cheap, presenting a potential buy signal. The middle band (the SMA) serves as the primary profit target.
How to Implement This Strategy
Implementing this strategy involves a clear set of rules for entry, exit, and risk management.
Bullish (Long) Entry: Look for the price to touch or close below the lower Bollinger Band. This indicates a potential oversold condition.
Bearish (Short) Entry: Wait for the price to touch or close above the upper Bollinger Band. This signals a potential overbought condition.
Profit Target: For both long and short positions, the primary profit target is the middle band (the 20-period SMA).
Stop Loss: A common practice is to place a stop loss just outside the entry band. For a long trade, set it below the low of the entry candle; for a short trade, set it above the high.
Actionable Tips for Success
To enhance the effectiveness of the Bollinger Bands mean reversion approach, consider these practical tips:
Confirm with an Oscillator: Don't rely solely on the bands. Combine them with an indicator like the Relative Strength Index (RSI). For a buy signal, look for the price to hit the lower band while the RSI is in oversold territory (below 30).
Avoid Strong Trends: This strategy performs best in ranging or sideways markets. During a strong, established trend, the price can "walk the band" (repeatedly touch an outer band without reverting), leading to multiple losses.
Adjust Band Settings: The standard settings (20 periods, 2 standard deviations) are a good starting point, but you may need to adjust them based on the asset's volatility and the timeframe you are trading.
Use on Multiple Timeframes: Check the bands on a higher timeframe to confirm the market context. A ranging market on a daily chart provides a better environment for this strategy on a 1-hour chart.
The Relative Strength Index (RSI) Oversold/Overbought strategy is a cornerstone of mean reverting trading strategies. Developed by J. Welles Wilder Jr., the RSI is a momentum oscillator that measures the speed and change of price movements on a scale of 0 to 100. The core principle is that when the RSI reaches extreme levels, it signals that an asset's price has moved too far, too fast, and is due for a reversal or pullback toward its average.
This strategy hinges on identifying "overbought" and "oversold" conditions. Typically, an RSI reading above 70 suggests an asset is overbought and its price may be unsustainably high, presenting a potential short-selling opportunity. Conversely, a reading below 30 indicates an oversold condition where the price may be unsustainably low, signaling a potential buying opportunity. Traders anticipate that once these extreme zones are hit, the price will revert to a more balanced, or mean, level. To learn more about how to use the RSI indicator, you can find in-depth guides that cover its fundamentals.
How to Implement This Strategy
A successful implementation of the RSI mean reversion strategy requires clear rules for market entry, profit-taking, and risk management.
Bullish (Long) Entry: Look for the RSI to drop below the 30 level. This signals the asset is potentially oversold. Enter a long position once the RSI starts to move back up above 30.
Bearish (Short) Entry: Wait for the RSI to climb above the 70 level, indicating a possible overbought condition. Enter a short position as the RSI begins to cross back down below 70.
Profit Target: A common profit target is the 50 level on the RSI, as this represents the midpoint or "mean." Alternatively, traders can target a significant recent price level like a prior support or resistance zone.
Stop Loss: For a long trade, place a stop loss below the recent swing low that formed during the oversold signal. For a short trade, set it above the recent swing high created during the overbought signal.
Actionable Tips for Success
To improve the reliability of this RSI-based mean reversion approach, incorporate these practical tips into your trading plan:
Look for RSI Divergence: A bullish divergence (price makes a lower low, but RSI makes a higher low) is a much stronger buy signal. A bearish divergence (price makes a higher high, but RSI makes a lower high) provides a more reliable sell signal.
Adjust Levels for Volatility: In a strong bull market, an asset can remain "overbought" (above 70) for a long time. Consider adjusting the levels to 80/20 in highly volatile markets or strong trends to filter out weaker signals.
Combine with Support and Resistance: Don't trade on RSI signals alone. A buy signal is more powerful if the RSI is below 30 and the price is at a key support level. An overbought signal is stronger if the price is also at a major resistance zone.
Use Multiple Timeframe Analysis: Confirm the signal on a higher timeframe. If you see an oversold RSI on a 1-hour chart, check the 4-hour or daily chart to ensure you aren't trading against a powerful downtrend.
3. Statistical Arbitrage (Pairs Trading)
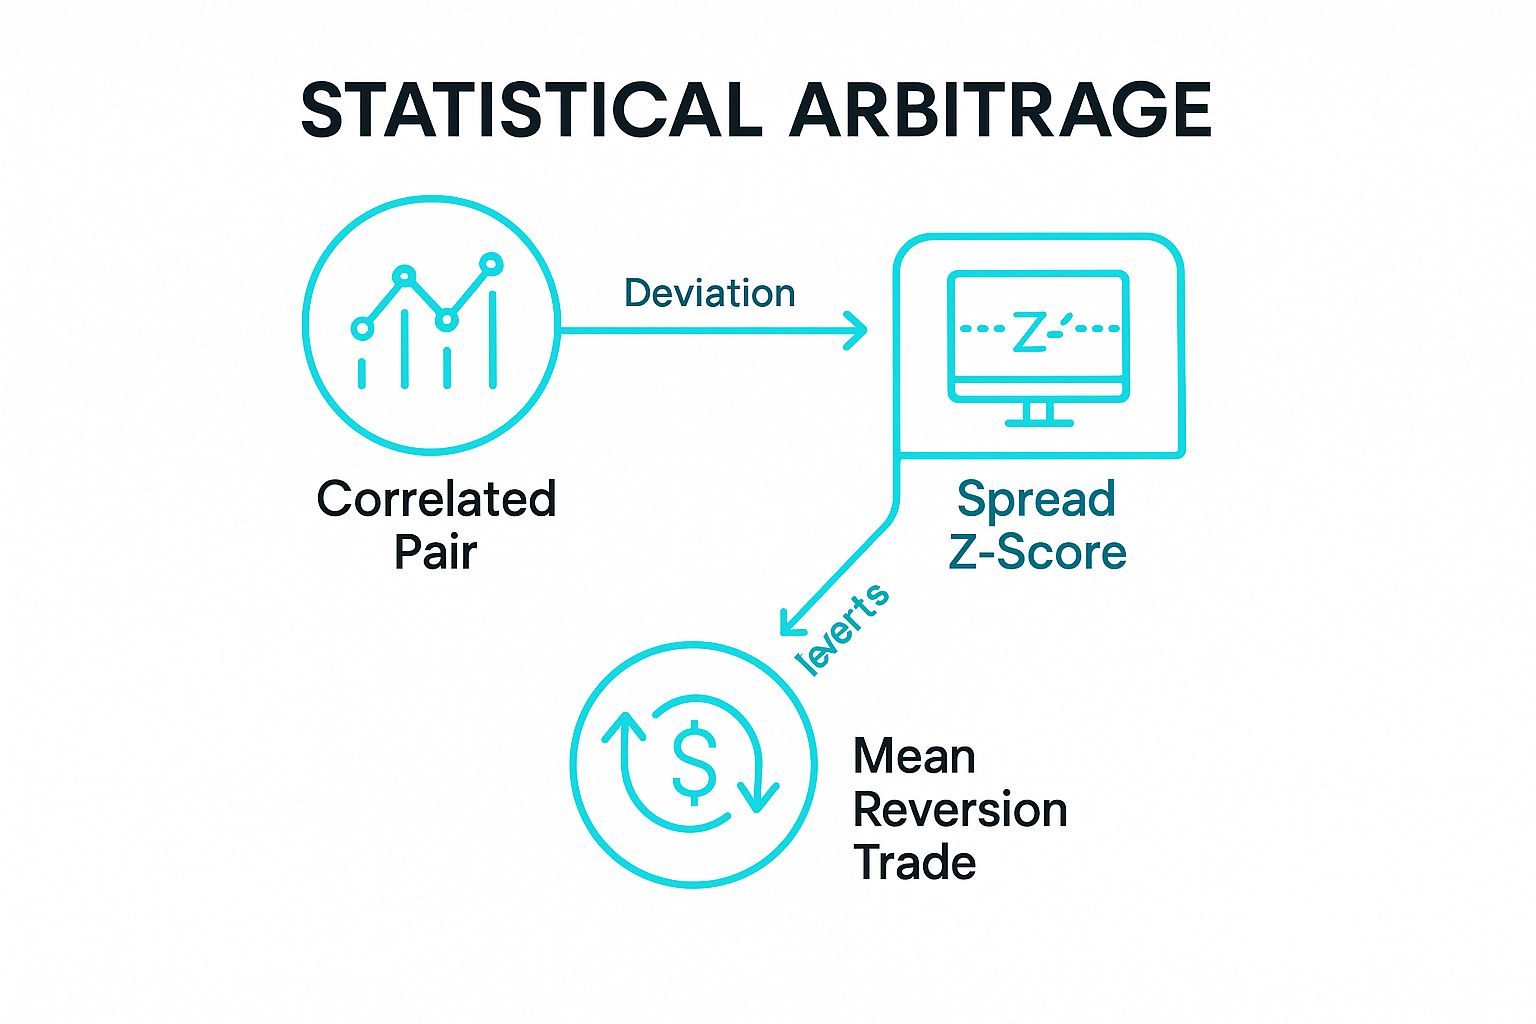
Statistical Arbitrage, commonly known as Pairs Trading, is a sophisticated market-neutral approach that belongs to the family of mean reverting trading strategies. The strategy involves identifying two historically correlated assets, such as Coca-Cola and PepsiCo, and monitoring the spread (the price difference or ratio) between them. The core principle is that this spread will maintain a historical average over time. When a temporary deviation occurs, a trading opportunity arises.
The strategy works by simultaneously taking a long position in the underperforming asset and a short position in the outperforming asset. This creates a market-neutral position, meaning the overall direction of the market has little impact on the trade's outcome. Profit is generated when the spread between the two assets reverts to its historical mean, regardless of whether the individual stock prices rise or fall. This method was popularized by quantitative trading desks at firms like Morgan Stanley and Renaissance Technologies.
The following infographic illustrates the core workflow of a typical statistical arbitrage trade.
This visualization highlights how identifying a correlated pair is the first step, followed by monitoring for a statistical deviation in their relationship, which then triggers the mean reversion trade itself.
How to Implement This Strategy
Implementing a pairs trading strategy requires a quantitative approach to identifying and executing trades.
Bullish (Spread Widening) Entry: Identify a pair whose price spread has narrowed significantly below its historical average. Go long the asset that has underperformed (the "cheaper" one) and short the asset that has overperformed (the "expensive" one).
Bearish (Spread Narrowing) Entry: Identify a pair whose price spread has widened significantly above its historical average. Short the asset that has overperformed and go long the one that has underperformed.
Profit Target: The profit target is reached when the spread reverts back to its historical mean. Close both the long and short positions simultaneously.
Stop Loss: A stop loss should be placed if the spread continues to diverge beyond a predefined threshold (e.g., 3 standard deviations). This indicates the historical correlation may have broken down.
Actionable Tips for Success
To effectively execute statistical arbitrage strategies, consider these essential tips:
Focus on Fundamentally Related Pairs: Choose pairs from the same industry with similar business models (e.g., Exxon vs. Chevron). This increases the likelihood that their historical correlation will hold.
Monitor Correlation Regularly: Correlations are not static and can change over time due to market events or company-specific news. Continuously monitor the correlation coefficient of your pairs to ensure the relationship remains valid.
Use the Z-Score: The Z-score is a standard statistical tool used to measure how far the current spread is from its historical mean in terms of standard deviations. A common entry signal is when the Z-score moves beyond +/- 2.
Have a Clear Exit Plan: Know precisely when to exit, not just for profit but also for a loss. If a correlation breaks down permanently, it is crucial to exit the trade to prevent significant losses.
4. Moving Average Convergence Divergence (MACD) Mean Reversion
While often viewed as a trend-following momentum indicator, the Moving Average Convergence Divergence (MACD) can be brilliantly adapted for mean reverting trading strategies. This approach focuses on identifying when momentum has become overextended and is likely to revert. The strategy uses the MACD histogram and signal line to pinpoint moments when price has moved too far, too fast from its short-term average, signaling an impending pullback.
The core principle is that when the MACD histogram reaches an extreme peak or trough, it indicates that the short-term price movement has significantly outpaced the longer-term trend. This divergence creates an imbalance that is often corrected by price "reverting" back toward its mean. Traders can anticipate this correction by looking for the histogram to begin contracting back toward the zero line, which acts as the equilibrium or "mean" in this context.
How to Implement This Strategy
Implementing a MACD mean reversion strategy requires watching for momentum exhaustion rather than trend continuation.
Bullish (Long) Entry: Identify a significant downward move where the MACD histogram prints an extreme low (a deep trough). Enter a long position when the histogram "ticks" up, printing a bar that is less negative than the previous one.
Bearish (Short) Entry: Look for a strong upward price move that creates an extreme peak in the MACD histogram. Enter a short position as the histogram "ticks" down, printing a bar that is less positive than the one before it.
Profit Target: The primary profit target is the MACD zero line. As the price reverts to its mean, the MACD lines will converge and cross the zero line, signaling the completion of the move.
Stop Loss: Place a stop loss just beyond the recent price extreme. For a long trade, set it below the recent swing low; for a short trade, set it above the recent swing high.
Actionable Tips for Success
To improve the reliability of MACD-based mean reversion signals, incorporate these practical tips:
Look for Divergence: The strongest signals occur when there is a divergence between price and the MACD. For instance, if the price makes a new low but the MACD histogram makes a higher low (bullish divergence), the subsequent reversion is likely to be more powerful.
Combine with Support/Resistance: Use established support and resistance levels to validate entry points. An extreme MACD reading at a major resistance level provides a high-probability setup for a short trade.
Use Multiple Timeframe Confirmation: Check the MACD on a higher timeframe to understand the broader market context. A reversion trade is more likely to succeed if it aligns with the larger trend or occurs within a ranging market on the higher timeframe.
Focus on Histogram Peaks: Instead of waiting for a signal line crossover, which can lag, use the first contracting bar of the histogram after a peak or trough as a more aggressive and timely entry signal.
5. Support and Resistance Mean Reversion
The Support and Resistance Mean Reversion approach is a foundational technique among mean reverting trading strategies. This method is built on the core principle that prices often respect historical levels where buying or selling pressure has previously been strong enough to reverse a trend. Support is a price level where a downtrend can be expected to pause due to a concentration of demand, while resistance is a level where an uptrend is likely to pause due to a concentration of supply. Traders anticipate that when the price reaches these key zones, it will "revert" back toward the middle of its recent trading range.
This strategy capitalizes on market psychology and order flow. When price approaches a well-established support level, traders who missed the last rally may see it as a buying opportunity, while short-sellers may start covering their positions, creating upward pressure. The opposite occurs at resistance. The reversion trade is based on the assumption that these historical levels will hold, causing the price to bounce off them and return to a more "normal" or average value.
How to Implement This Strategy
Successfully trading support and resistance mean reversion requires identifying valid levels and setting precise entry and exit points.
Bullish (Long) Entry: Identify a strong support level where the price has reversed multiple times in the past. Enter a long position when the price tests this level and shows signs of rejection (e.g., a bullish candlestick pattern like a hammer or engulfing candle).
Bearish (Short) Entry: Find a clear resistance level with a history of stopping price advances. Enter a short position after the price reaches this zone and shows bearish rejection signals.
Profit Target: The profit target is often set at a recent minor support/resistance level or halfway back to the opposite major level, effectively targeting the "mean" of the trading range.
Stop Loss: Place the stop loss just beyond the key level. For a long trade at support, set it slightly below the support zone; for a short trade at resistance, place it just above the resistance zone to account for potential false breakouts.
Actionable Tips for Success
To improve the reliability of this classic strategy, apply these practical tips:
Confirm Levels with Volume: A true support or resistance level is often accompanied by a spike in trading volume as the battle between buyers and sellers intensifies. Low volume at a key level may signal it is weak and likely to break.
Use Multiple Touches to Validate: The strongest support and resistance levels are those that have been tested and have held multiple times. A level with only one touch is less reliable than one with three or more.
Look for Confluence: Increase your trade's probability by finding confluence, where a support or resistance level aligns with another technical signal, such as a Fibonacci retracement level, a moving average, or an indicator signal. For a deeper understanding, you can learn more about mastering pullbacks on ezalgo.ai.
Pay Attention to Price Action: Do not trade a level just because the price has reached it. Watch for candlestick patterns that confirm rejection, showing that other market participants are also respecting the level.
6. Stochastic Oscillator Mean Reversion Strategy
The Stochastic Oscillator Mean Reversion strategy is a popular momentum-based approach used in mean reverting trading strategies. Developed by George Lane, this indicator doesn't follow price or volume but rather the speed or momentum of price. It operates on the principle that as prices move up, the closing prices tend to cluster near the high of the recent range, and as they move down, they cluster near the low. When the oscillator reaches extreme levels, it signals that the price momentum is overextended and a reversal back toward the mean is likely.
This strategy identifies overbought and oversold conditions by measuring the level of the close relative to the high-low range over a set period. The oscillator is plotted on a scale of 0 to 100. Readings above 80 are considered overbought, suggesting the asset is trading at the top of its range and may be due for a pullback. Conversely, readings below 20 are considered oversold, indicating the asset is at the bottom of its range and could be poised for a rally.
How to Implement This Strategy
Implementing the Stochastic Oscillator for mean reversion requires clear entry and exit points based on its readings.
Bullish (Long) Entry: Look for the Stochastic Oscillator to drop below the 20 level, indicating an oversold market. The entry signal is often triggered when the oscillator lines cross back above 20.
Bearish (Short) Entry: Wait for the Stochastic Oscillator to rise above the 80 level, signaling an overbought market. The entry signal occurs when the oscillator lines cross back below 80.
Profit Target: A common profit target is the 50 level on the Stochastic Oscillator, as this represents the midpoint or "mean" of the recent price range. Alternatively, traders can target a key moving average or a recent support/resistance level.
Stop Loss: For a long position, place the stop loss below the recent swing low. For a short position, place it above the recent swing high to protect against a continued momentum move.
Actionable Tips for Success
To improve the reliability of the Stochastic Oscillator mean reversion strategy, consider these practical tips:
Wait for the Turn: Don't enter a trade simply because the oscillator is in an extreme zone. Wait for it to exit the overbought (below 80) or oversold (above 20) area to confirm that momentum has actually shifted.
Use the Slow Stochastic: The "Slow" Stochastic, which includes a 3-period smoothing, is generally preferred as it filters out much of the market noise and reduces the number of false signals compared to the "Fast" version.
Confirm with Divergence: Look for bullish or bearish divergences for stronger signals. A bullish divergence occurs when the price makes a lower low, but the Stochastic Oscillator makes a higher low, signaling waning downward momentum and a potential reversal up.
Avoid Strong Trends: Like many mean reversion tools, the Stochastic Oscillator performs best in ranging or consolidating markets. In a strong uptrend or downtrend, the indicator can stay in the overbought or oversold zone for extended periods.
Mean Reverting Strategy Comparison Guide
Strategy
Implementation Complexity 🔄
Resource Requirements ⚡
Expected Outcomes 📊
Ideal Use Cases 💡
Key Advantages ⭐
Bollinger Bands Mean Reversion Strategy
Moderate; requires understanding of bands and volatility measures
Combines trend and mean reversion, reduces false signals, visual momentum cues
Support and Resistance Mean Reversion
Low; requires chart reading and identifying horizontal levels
Low; no special tools needed
Reliable reversals near psychological price levels
All timeframes, day trading, swing trading, options
Based on market psychology, easy to identify, clear entry/exit points
Stochastic Oscillator Mean Reversion Strategy
Moderate; understanding %K/%D and smoothing settings
Low; commonly available on trading platforms
Early reversal signals in range-bound conditions
Sideways/range markets, scalping, swing trading
Early signals, clear overbought/oversold levels, fine-tunable sensitivity
Integrating Mean Reversion into Your Trading Toolkit
Throughout this guide, we've explored the core principle that prices, after significant moves, tend to return to their historical average. From the elastic boundaries of Bollinger Bands to the oscillator-driven signals of the RSI and Stochastics, the common thread is clear: markets are cyclical. Extreme highs and lows are often temporary, presenting strategic opportunities for the disciplined trader.
We've broken down six powerful mean reverting trading strategies, each offering a unique lens through which to view market behavior. You've learned how to identify overextended conditions using the MACD, trade the predictable relationships in pairs trading, and capitalize on the psychological battlegrounds of support and resistance levels. The key takeaway is that these aren't just abstract theories; they are actionable frameworks built on quantifiable market data.
Key Insight: The success of any mean reversion strategy hinges not just on identifying the entry point, but on having a crystal-clear plan for risk management. Because you are trading against the immediate trend, a defined stop-loss is non-negotiable.
Your Actionable Path Forward
Mastering these strategies requires practice, patience, and a commitment to rigorous testing. Here’s how you can start integrating them into your own trading system today:
Pick One Strategy: Avoid overwhelming yourself. Choose the strategy that resonates most with your trading style and market of choice, whether it's the visual clarity of Bollinger Bands or the mathematical precision of Statistical Arbitrage.
Backtest Extensively: Before risking a single dollar, use historical data to test your chosen strategy. Analyze its performance across different market conditions (trending, ranging, volatile) to understand its strengths and weaknesses.
Start Small on a Demo Account: Transition from backtesting to paper trading. This crucial step helps you get a feel for executing trades in a live environment without financial risk. Pay close attention to how you manage your emotions when a trade moves against you.
Refine Your Rules: No strategy works perfectly out of the box. Use your backtesting and demo trading results to fine-tune your entry triggers, profit targets, and stop-loss placements. Document every adjustment and the reason behind it.
Ultimately, adopting mean reverting trading strategies is about adding a powerful, counter-cyclical perspective to your analytical toolkit. It teaches you to look for moments of market exhaustion and to see opportunity where others see panic or euphoria. By understanding the ebb and flow of market prices, you position yourself to act with confidence when assets deviate too far from their baseline, turning volatility into a strategic advantage rather than a source of fear.
Ready to supercharge your analysis and find high-probability mean reversion setups faster? EzAlgo provides a suite of advanced indicators, including our signature EzReversal signals, that automatically detect overbought and oversold conditions right on your TradingView charts. Take the guesswork out of your strategy and let our algorithms do the heavy lifting by visiting EzAlgo to learn more.


%201.svg)