


Mean reversion strategies all boil down to one core belief: what goes up, must come down (and vice-versa). Think of it like a rubber band. Stretch it too far in one direction, and it’s bound to snap back. In trading, this means that after a wild price swing, an asset will likely gravitate back toward its long-term average price.
This simple, powerful idea helps traders spot when an asset looks seriously overbought or oversold.

At its core, mean reversion is all about the natural ebb and flow of the market. Prices don't just move randomly; they're pulled toward their historical average by the forces of buying and selling. It's human psychology in action.
When a stock's price rockets past its usual value, savvy traders start to cash in their profits. This selling pressure increases supply and nudges the price back down to earth. On the flip side, if a price crashes due to a panic sell-off, bargain hunters often jump in, sensing an undervalued opportunity. Their buying creates new demand, pushing the price back up toward its average.
This constant cycle of overreaction and correction is what creates the patterns that mean reversion trading strategies are built on.
The "mean" is just a trader's term for the average price over a certain timeframe, and it serves as a crucial baseline for an asset's fair value. We use technical indicators, like moving averages, to actually see this baseline on a chart.
For example, many traders rely on the 50-day or 100-day moving average to define a "normal" price range. When the price strays too far above or below that line, the theory suggests it will eventually return, creating a potential trade. For a more academic dive into this financial concept, you can check out the explanation on Wikipedia.
The core assumption is simple: extreme price movements are often temporary. The challenge for a trader is distinguishing a temporary stretch from the beginning of a powerful new trend.
A winning strategy isn't just about spotting a price that looks too high or low. It's about timing. The real skill lies in entering the trade when that rubber band is stretched to its absolute limit and getting out just as it snaps back to the average.
To really make this work, you need to internalize a few foundational concepts. These principles are the bedrock of any solid mean reversion strategy, guiding everything from finding a setup to managing your risk.
Here’s a quick breakdown of what you need to master.
Core Principles of Mean Reversion Trading
Nailing these three steps is what separates guessing from a calculated, repeatable trading process. It's about letting the market show you its hand before you place your bet.
So, how do you actually spot a mean reversion trade in the wild? It takes more than just a gut feeling that a price has shot up "too far, too fast." Experienced traders use a specific toolkit of technical indicators to get an objective read on when an asset is truly stretched to its limit.
Think of these tools as your diagnostic instruments. They help you measure, not just guess, when a market is overbought or oversold. While there are countless indicators out there, a few have really stood the test of time for mean reversion strategies: Moving Averages, Bollinger Bands, and the Relative Strength Index (RSI).
Each one gives you a slightly different angle on the price action. The real magic happens when you start layering them together.
The simplest place to start is with a Moving Average (MA). It cuts through the noise of daily price swings by smoothing everything out into a single, flowing line, giving you a clear picture of the average price over a set period. For our purposes, the distance between the current price and its MA is a direct measure of how far things have strayed.
When a price rockets significantly above its moving average, it’s a sign the asset is getting ahead of itself and might be due for a breather. On the flip side, a price that plummets far below the MA is a classic oversold signal, creating the perfect setup for a potential bounce.
Just picture the MA as a center of gravity. The further an object flies away from it, the stronger the pull to snap back. A common tactic is to watch for the price to stretch a specific percentage or point value away from a key MA, like the 20-period or 50-period, as a trigger to start looking for an entry.
Bollinger Bands are like moving averages on steroids because they factor in volatility. They're made up of three distinct lines:
Standard deviation is just a fancy way of measuring how spread out prices are—in other words, volatility. This is brilliant because the bands automatically get wider when the market is choppy and tighten up when things are quiet. For a mean reversion trader, those outer bands are where the action is.
When the price touches—or even better, pokes through—an outer Bollinger Band, it’s a statistical flare gun. It signals that the price has reached a significant extreme. A tag of the lower band screams "severely oversold," while a push past the upper band yells "extremely overbought."
This isn't a blind signal to jump in. Treat it as a high-alert that the rubber band is stretched tight and a snap-back could be coming. Many traders will wait for the price to actually move back inside the band to confirm the reversal has begun before they place a trade.
The image below gives a great visual of how different statistical indicators tie together to pinpoint these moments.
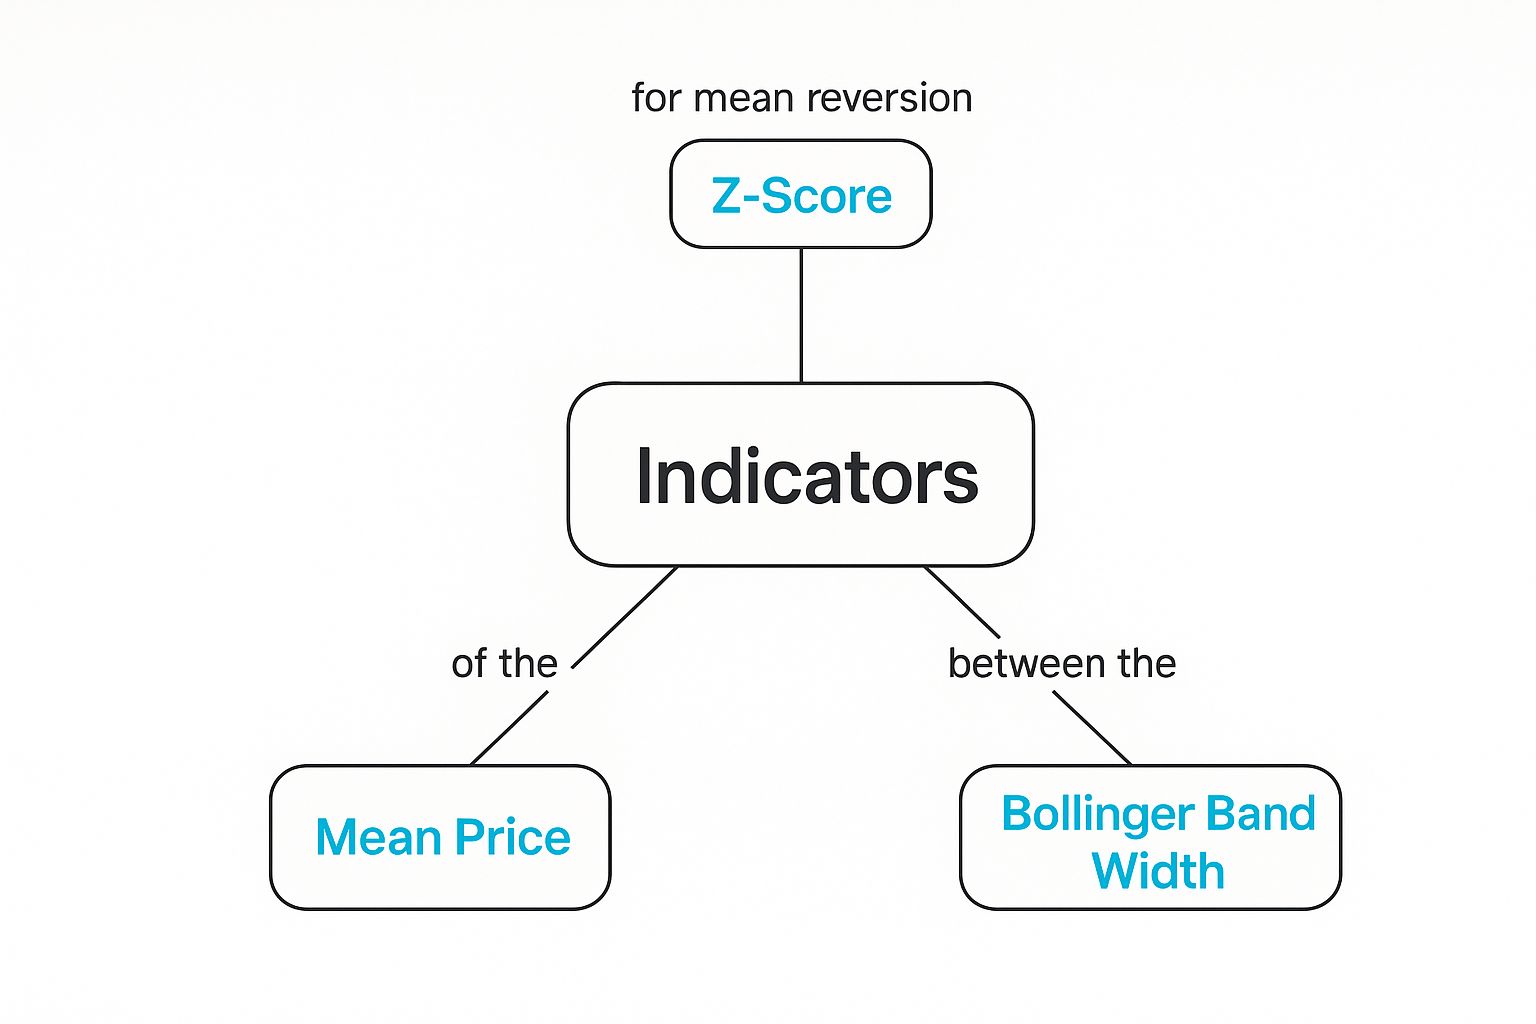
This map shows how tools like Z-Score and Bollinger Band Width help measure these deviations from a central price, which is the analytical bedrock of any mean reversion strategy.
Finally, we have the Relative Strength Index (RSI). This is a momentum oscillator, which means it measures the speed and strength of price changes on a scale from 0 to 100. Its main job is to tell you when a trend is running out of steam.
The RSI adds crucial context to your analysis. Is that big price drop a sign of a new downtrend, or is the selling pressure just getting exhausted? The traditional readings are simple and effective:
Let's say a stock has been tanking and its RSI hits 25. A mean reversion trader sees more than just a cheap price; they see quantifiable proof that the selling is likely unsustainable. This gives you a solid reason to believe a reversal is probable.
Now, imagine combining an RSI below 30 with the price tagging its lower Bollinger Band. That’s a much more powerful signal than either indicator could give you alone. This is how you build a high-probability setup—by layering evidence until the story the chart is telling you becomes impossible to ignore.
The core concept of mean reversion feels timeless. For as long as there have been markets, traders have noticed that prices tend to snap back toward an average. But for most of history, that was just an observation, a piece of market folklore. Turning it into a concrete, data-driven strategy was nearly impossible before personal computers hit trading desks.
Think about it. Before the early 1980s, trying to spot subtle patterns was grueling, manual work. Traders had their hand-drawn charts, some basic arithmetic, and a whole lot of gut feeling. If you wanted to test an idea, you’d have to sift through years of dusty price books by hand. It was so slow and imprecise that finding a true statistical edge was more art than science.
Then, everything changed. The rise of accessible computing power meant traders could suddenly do what was once unthinkable: rigorously backtest their theories across decades of historical data. And they could do it in minutes, not months.
This ability to run simulations is what elevated mean reversion from a general hunch into a powerful quantitative tool. Instead of just feeling that a price was "too high," a trader could now define exactly what that meant with precise rules. More importantly, they could see how that rule would have performed over thousands of past examples.
This data-first approach started uncovering patterns that were completely invisible to the naked eye. The game was no longer about broad observations; it was about digging through the data to find specific, repeatable edges.
The quantitative revolution essentially gave traders a microscope to examine market behavior. Mean reversion was one of the first concepts they put under that lens, and the results were stunning.
For example, this newfound analytical power let traders experiment with indicators in ways that were never practical before. They could test unconventional settings, like a very short 2-period RSI, to pinpoint fleeting, high-probability setups that would have otherwise been missed. This systematic testing finally separated what actually worked from what just sounded good.
The impact of this technological shift wasn't just theoretical—it left clear footprints in the market data. When you look back, you can see that the consistent profitability of certain mean reversion trading strategies really started to take shape in the early 1980s, right when computer-based analysis became a thing.
For instance, the data shows a clear shift around 1983. Strategies using a low 4-period RSI to buy oversold dips in major indexes began to consistently outperform the market over the next five days. Before that time, no such reliable pattern existed. This suggests it was the ability to scientifically test and apply these rules that unlocked their predictive power. If you want to dive deeper into this, a detailed study on market behavior breaks down this historical performance shift beautifully.
Understanding this history is crucial for a few reasons:
The ability to backtest didn't just refine old ideas; it gave birth to entirely new ones, cementing the role of statistical proof in modern trading.
Today, every trader has access to computing power that would have been the stuff of science fiction just a few decades ago. Platforms like TradingView, paired with sophisticated tools, empower anyone to backtest and fine-tune mean reversion strategies with incredible precision. This is the direct legacy of the quantitative revolution that kicked off in the 1980s.
Knowing this history helps you frame mean reversion correctly. It’s not a simple market trick. It's a scientific approach to identifying statistical probabilities, and its power comes from technology, data, and rigorous testing.
Alright, let's get down to business. Moving from theory to practice is where a trading idea actually starts to matter. A solid trading plan is what makes that happen. Think of it less like a set of loose guidelines and more like a strict, mechanical rulebook that dictates your every move—especially when your money is on the line and emotions are running high.
A good plan turns trading from a guessing game into a repeatable process. It forces you to answer three critical questions before you ever risk a single dollar: When do I get in? When do I take profits? And most importantly, when do I cut my losses? If you don't have crystal-clear answers to these, you're not trading; you're gambling.
This framework is your best shot at building consistency. Let's break down the essential pieces and put together a hypothetical plan you can use as a starting point.
Your entry rules are the specific market conditions that have to line up perfectly before you even think about placing a trade. These need to be black and white, leaving zero room for interpretation. The goal is to stack signals from different indicators to find a high-probability setup.
For our example, let's create what I call a "deeply oversold" entry signal. We're looking for multiple pieces of evidence telling us the same story.
Only when all three of these conditions are met, in order, do we have a valid entry. This layered approach is designed to filter out the noise and the weaker setups, which should improve our odds.
Once you’re in a trade, you need an equally clear rule for getting out with a profit. With mean reversion, the objective is simple: get out when the price has snapped back to its "mean" or average. Trying to squeeze more out of the move often goes against the very principle of the strategy.
A common and incredibly effective profit target is the middle line of the Bollinger Bands—the 20-period Simple Moving Average. This is the statistical "mean" we expect the price to gravitate back toward.
Your exit rule could be as simple as this: "Sell the position as soon as the price touches the 20-period moving average." This has to be a non-negotiable rule. It doesn’t matter if you feel like the price will keep running. The plan dictates the exit, which helps ensure you capture the most probable part of the move and don't let greed turn a winner into a loser.
Let's be clear: no strategy wins 100% of the time. Your stop-loss is your safety net. It's the pre-defined exit point that protects your capital when a trade inevitably goes south. This is the single most important part of any trading plan because it's what prevents a small, acceptable loss from snowballing into a disaster.
For a long mean reversion trade, a logical place for a stop-loss is just beneath the recent price action that gave you the entry signal in the first place.
By defining your stop-loss before you enter, you know exactly how much you stand to lose on that trade. This lets you size your position correctly and turns risk from a scary unknown into a calculated business expense. Sticking to your stop-loss, no matter what, is the hallmark of a disciplined trader.

Mean reversion strategies can feel like a sure thing, but they hide one major pitfall that catches even experienced traders off guard. The biggest risk isn’t getting your entry timing slightly wrong. It’s mistaking a powerful new trend for a simple pullback.
This is the classic scenario of trying to catch a falling knife.
What looks like a perfectly "oversold" asset might be dropping for a very good reason—a surprise earnings miss, bad industry news, or a major economic shift. In these moments, the "mean" itself is actually changing. The price isn't snapping back; it's finding a new, lower floor.
Without a solid risk management plan, one mistake like this can easily erase the profits from ten good trades. That's why managing your downside isn't just a part of the strategy; it's the most important part.
The first rule of risk management is simple and non-negotiable: always use a stop-loss. Think of it as your emergency exit. It’s the pre-set point where you accept the trade isn't working and get out to protect your capital.
When you place a mean reversion trade, you're betting that the price will revert. If it keeps moving hard against you, breaking past a key support or resistance level, your theory is wrong. A stop-loss forces you to accept that fact and prevents a small, manageable loss from turning into a disaster.
A stop-loss isn't just about limiting financial damage. It's about taking emotion out of the equation when you're under pressure. It’s a hard rule that saves you from the dangerous hope that "it will come back."
For mean reversion trades, a good spot for a stop-loss is just beyond the recent high or low that triggered your entry. If the price pushes past that point, it’s a clear sign that the momentum is stronger than you thought. Time to step aside. For a deeper look at this, our complete guide offers practical advice on risk management for traders.
Just as crucial is position sizing. Even with a tight stop-loss, you can still get hurt if you bet too much on a single trade. Professionals think in percentages. A common rule is to risk only a tiny fraction of your trading capital on any one idea, typically just 1% to 2%.
This means you calculate how many shares to buy based on your stop-loss distance. If your plan allows you to risk $100, and your stop-loss is $1 from your entry, you can trade 100 shares. This disciplined method ensures that a string of losses won't knock you out of the game.
To really grasp the risk, it helps to see how mean reversion stacks up against its philosophical opposite: trend following. One bets on reversal, the other on continuation. Understanding the difference is key to knowing which tool to use for the job.
Knowing when to apply each strategy—or when to stay out entirely—is what separates consistently profitable traders from the rest of the pack. They aren't just one-trick ponies; they adapt to what the market is giving them.
Fundamental news can be the catalyst that flips a mean reversion setup into a runaway trend.
Take October 2023, for example. Major US banks like JPMorgan posted earnings that crushed expectations, and the E-mini S&P 500 futures took off. The price shot up nearly two standard deviations above its 20-day moving average—a textbook overbought signal. This attracted plenty of mean reversion traders looking to short the market, expecting a quick drop.
They set up their shorts, saw bearish signals, and placed their stop-losses just above the recent highs to protect themselves. This risk-first mindset is essential when trading sharp, news-driven moves.
This example shows the tightrope you have to walk. The technicals screamed "reversion," but the strong fundamental news was a huge warning sign that a new uptrend was forming. Traders who shorted without a strict stop-loss got run over as the market kept climbing. But those with a clear risk plan took a small, controlled loss and lived to trade another day.
You’ve got a trading plan. You know your entry, your exit, and where you’ll place your stop-loss. But here’s the million-dollar question: does it actually work?
Think of it this way: you wouldn't pour your life savings into a business idea without crunching the numbers first. It would be reckless. In trading, our version of "crunching the numbers" is called backtesting, and it's just as critical.
Backtesting is your strategy's trial run. You take your rules and apply them to historical price data to see how they would have held up in the past. It’s the only way to know for sure if your mean reversion idea has a real statistical edge or just looked good on paper.
This process gives you the hard data you need to trade with conviction. A solid backtest gives you the confidence to pull the trigger when your setup appears. A failed one? That's a blessing in disguise—it just saved you a ton of real money.
The concept is simple. You’re essentially hopping in a time machine with your rulebook and trading past market action as if it were live.
Here’s what that looks like:
Get Your Hands on Data: You need clean, reliable historical price data for the asset and timeframe you want to trade. The more, the better. You want to see how your strategy handles everything—bull runs, bear markets, and those frustrating sideways periods.
Define Your Rules: This is where you translate your strategy into a testable format. Modern platforms have made this much easier, so you don't need to be a coding wizard. You just need to be precise about every single condition, from the exact RSI level for an entry to the Bollinger Band touch for an exit.
Run the Simulation: The backtesting software takes over from here. It scrolls through all the historical data, executing a trade every single time your rules were met. It keeps a perfect log of every entry, exit, win, and loss along the way.
When the test is done, you'll get a performance report. Don't just glance at the total profit and call it a day. The real insights are buried in the details—the metrics that reveal your strategy's personality, warts and all.
A high win rate feels great, but it can be incredibly misleading. A strategy might win 80% of its trades, but if that one big loss wipes out all the small wins, you're still losing money. You have to see the whole picture.
Make sure you dig into these critical performance stats:
For a much deeper dive, our guide on how to backtest a trading strategy walks you through this entire process.
Backtesting is a powerful tool, but it's dangerously easy to fool yourself if you aren't careful. There are two major traps that can give you a beautiful report that means absolutely nothing in the real world: overfitting and curve-fitting.
This is what happens when you keep tweaking your strategy's settings until they perfectly match the historical data you're testing. The backtest will look incredible, of course, but it's almost guaranteed to fall apart in live trading. Why? Because you didn't find a real market edge; you just molded your rules to fit the random noise of the past.
An honest, unfiltered backtest is the only way to build a strategy that has a fighting chance out in the wild.
Mean reversion really shines in markets that tend to move sideways or in clear cycles. Think of markets that are more "choppy" than "trendy."
Major stock indices like the S&P 500 are a classic example, as they often get pushed and pulled within a broader range. Certain forex pairs that are known for their sideways movement also fit the bill perfectly. You'll generally want to steer clear of assets that are famous for their strong, long-lasting trends, as that's where trend-following strategies will have the upper hand.
These are typically short-term plays. The whole idea is to catch that quick snap-back to the average price, not to ride a long trend.
A trade might last anywhere from a few days to a couple of weeks, all depending on the timeframe you're looking at. For instance, if you spot a setup on a daily chart, you might expect the move to play out over 2 to 10 days. Once the price gets back to its mean—say, the 20-day moving average—that's usually your cue to take profits and close the trade.
Ready to stop guessing and start trading with data-driven precision? EzAlgo equips you with advanced indicators, real-time alerts, and proven strategies to master mean reversion. Upgrade your TradingView experience and join EzAlgo today.


%201.svg)