


The inverted cup and handle pattern is one of those classic chart formations that every trader should know. It's a strong bearish signal that essentially tells you an asset's price is probably going to keep falling. Think of it as a red flag popping up on your chart, warning you that the buyers are running out of steam and the sellers are about to take over.
So, what does this pattern actually look like?
Picture a rollercoaster that's just climbed a big hill. It forms a rounded peak, makes a tiny little jump upwards, and then dives. That’s the inverted cup and handle in a nutshell. It isn't just a random squiggle on your screen; it’s a story about the tug-of-war between buyers and sellers, and it usually ends with the sellers winning.
This pattern is what we call a "continuation" pattern. It typically shows up in the middle of an existing downtrend, signaling that the asset is just taking a breather before heading lower again. Getting good at spotting this shape is a huge advantage, and the first step is knowing its parts. If you want to brush up on the basics, our guide on how to read trading charts is a great place to start.
The pattern has four distinct pieces that come together to tell the full story of the market's shifting mood. Let's break them down.
Here’s a quick summary of what you're looking for:
Each of these components plays a crucial role. Without a prior downtrend, it’s not a continuation pattern. Without a clear handle, the signal is weak. And without a break of the neckline, there’s no confirmation.
So, what’s the psychology here? The inverted cup and handle pattern is all about a loss of upward momentum. The "cup" shows the market tried to rally but failed, slowly rolling over as buyers gave up. The "handle" is a classic bull trap—it looks like a small recovery, luring in hopeful buyers right before the price drops again.
The signal is officially confirmed when the price breaks decisively below the neckline.
The Bottom Line: A break below the neckline is your signal. It means the sellers have officially won the battle, and a significant downward move is likely on its way. This is the moment when traders looking to short the asset will typically make their move.
Spotting an inverted cup and handle pattern in real-time takes a trained eye, but it’s a lot more methodical than you might think. It isn't just about finding a shape that looks like an upside-down "U" on your chart; it's about understanding the story the price action is telling you. By breaking down its key components, you can learn to tell a genuine, high-probability setup from a misleading lookalike.
Think of yourself as a detective at a crime scene. You need to gather specific pieces of evidence before you can make a call. The first piece is always the context: a clear, pre-existing downtrend. This pattern signals a continuation of bearish momentum, so it needs a downward trend to continue in the first place. If an asset is in a strong uptrend, an inverted cup shape is probably just a temporary pullback, not a full-blown bearish pattern.
Once you've confirmed the downtrend, the next step is to dissect the pattern itself. Each part has specific characteristics that build the case for a valid trade. A textbook inverted cup and handle pattern should have a smooth, rounding top. Jagged, "V-shaped" peaks often signal panic selling and quick reversals, which don't fit the psychological profile here. This pattern is about a gradual loss of buying pressure.
After the cup forms, you need to look for the handle. This part is a crucial validation point.
This image really simplifies the three core stages of how the pattern comes together, from the initial rounding top to the final confirmation.
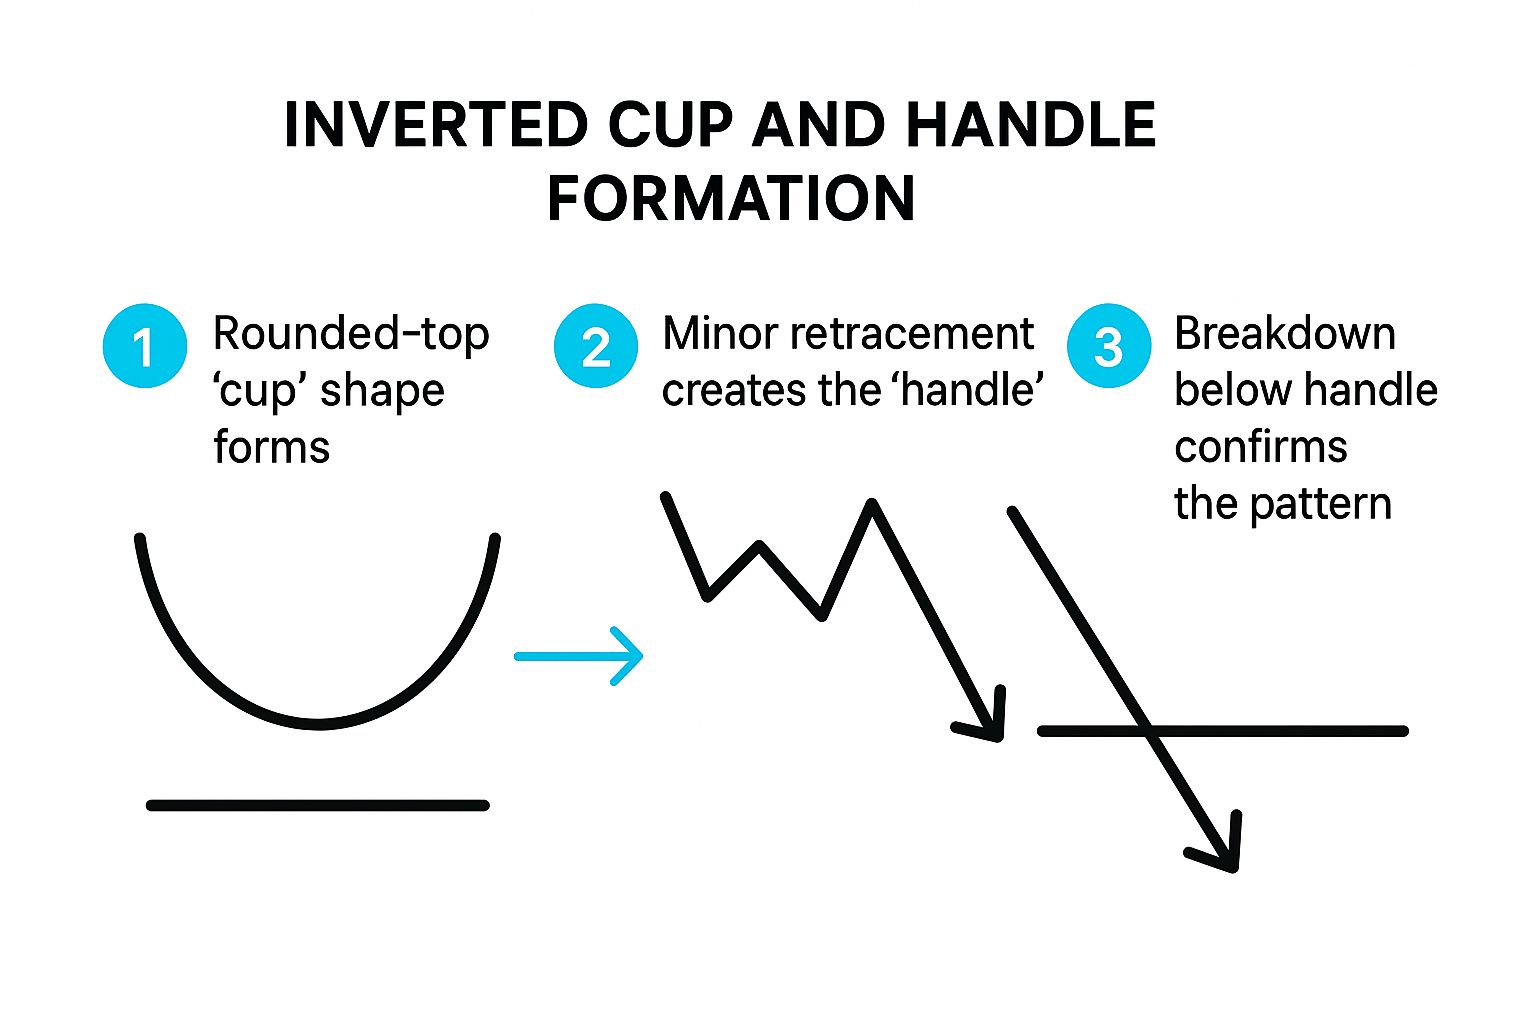
Visualizing the pattern this way helps train your eye to see the sequence of events: buyer exhaustion (the cup), a feeble recovery attempt (the handle), and finally, the breakdown driven by sellers.
The final and most critical piece of the puzzle is the neckline. This is simply a support level drawn horizontally, connecting the low points at the beginning and end of the cup. Think of it as the line in the sand.
All the evidence you've gathered so far—the downtrend, the rounded cup, the weak handle—is just circumstantial until this line is broken.
A decisive, high-volume break below the neckline is your confirmation. It’s the market screaming that sellers have absorbed all the buying pressure at that support level and are now in complete control, ready to push the price much lower.
This is the trigger point for a potential short entry. Without a clean break of this support, the pattern is incomplete and isn't worth trading. If the price bounces hard off the neckline, the entire bearish setup is invalidated, and it's time to move on.

Spotting the shape of an inverted cup and handle pattern is a great start, but it's only half the story. A pattern by itself is just a shape on a chart. What really gives it teeth are the two crucial context clues: volume and time. Think of them as the market's lie detector, helping you figure out if the pattern is telling the truth.
Volume, in particular, shows you the conviction behind the price action. Are traders piling in, or are they quietly backing away? A truly valid pattern will have a clear volume signature that backs up the story of buyers losing steam and sellers getting ready to pounce.
Without this confirmation, you're essentially trading blind and could easily get faked out by a misleading shape.
The ideal volume profile for an inverted cup and handle should make perfect sense. It acts like a supporting character, confirming what the main actor (the price) is doing at every turn. When you see price and volume telling the same story, your confidence in the trade setup should shoot up.
Here’s the classic sequence you want to see:
Key Takeaway: A breakdown on low volume is a massive red flag. It signals a lack of conviction from sellers and dramatically raises the odds of a false breakout—where the price snaps right back above the neckline.
Just as volume gives you confirmation, the time frame gives the pattern its strength and significance. Patience is a virtue in trading, and patterns that build over longer periods are almost always more reliable. Why? Because they reflect a much bigger, more fundamental shift in market sentiment.
A pattern that takes several weeks or months to form on a daily or weekly chart carries far more weight than one that pops up over a few hours on a 15-minute chart. Longer-term patterns involve more money and a wider consensus among traders, making their outcome more meaningful. Shorter time frames, on the other hand, are full of "market noise" and can generate a lot of unreliable signals.
The relationship between volume, time, and price is a cornerstone of technical analysis. For the inverted cup and handle pattern, a setup that forms over weeks to months, with dwindling volume in the cup and a sharp volume spike on the breakdown, has historically been a very high-probability trade. You can dive deeper into these validation techniques on sites like TradingView.
Ultimately, learning to see a pattern through the lens of time and volume elevates you from a simple chart-spotter to a true market analyst. These elements help you filter out the weak setups, zero in on the best opportunities, and trade this powerful bearish signal with real confidence.
Seeing a clear inverted cup and handle pattern take shape on your chart is a great start. But let's be honest, spotting it is the easy part. The real skill is in knowing exactly how to trade it—turning that pattern into a successful, profitable move.
You can't just jump in the second you think you see the shape. You need a solid game plan. Think of it like a pilot's pre-flight checklist; every step is there for a reason. Having a plan for your entry, your exit, and your risk management removes the emotion and guesswork, giving you a clear, repeatable process for every trade.
The classic entry for an inverted cup and handle is the breakdown below the neckline, but you need to be smart about it. A "breakdown" isn't just the price dipping a penny below support. That can easily be a fakeout. You're looking for a real, decisive move.
So, what does a good entry look like? It needs two things:
When you see a breakdown on volume that's at least 50% higher than its recent average, that's your green light. It's strong evidence that the bearish move has serious momentum.
No pattern is a sure thing. The market loves to throw curveballs, which is why a stop-loss is non-negotiable. It's your safety net, the predefined point where you say, "Okay, this idea didn't work out," and get out to protect your capital.
For the inverted cup and handle, the most logical place to set your stop-loss is just above the high of the handle.
Why there? The handle was the buyers' last real attempt to push the price up before sellers took complete control. If the price rallies back and breaks above that handle, the entire bearish setup is busted. Buyers are back in charge, and you definitely don't want to be short anymore. This placement keeps your risk defined without choking the trade.
Okay, so you're in the trade and your stop-loss is set. Now what? You need a goal. Where are you planning to take your profits? Thankfully, the pattern itself gives us a simple, objective way to figure that out.
Here’s the two-step process:
This "measured move" technique gives you a logical, data-driven target. It’s not a guarantee, of course, but it provides a disciplined way to plan your exit. Many experienced traders will take some profit off the table at this first target and then let the rest of the position run with a trailing stop-loss, just in case the stock decides to fall even further.

There’s nothing worse than seeing a perfect inverted cup and handle pattern, entering your short trade as the price breaks the neckline, and then—whiplash. The price snaps right back up, stopping you out for a loss. It’s not just frustrating; it’s a quick way to drain your account.
But here’s the secret: you don’t have to fall for these traps. The key is to stop seeing the pattern in a vacuum. A breakdown of the neckline isn't a guaranteed signal; it's more like an early clue. Before you put your money on the line, you need to gather more evidence to confirm that the bears are truly in charge.
By building a simple, repeatable confirmation process, you can learn to filter out the weak signals and focus only on the high-probability setups where the odds are stacked in your favor.
One of the best ways to validate a breakdown is to look under the hood at the market’s momentum. A classic tool like the Relative Strength Index (RSI) works perfectly for this. The RSI tells you about the speed and conviction behind price moves, showing if an asset is running out of steam.
For an inverted cup and handle, you want to see bearish momentum building before the price even cracks the neckline.
A breakdown confirmed by bearish momentum is infinitely stronger than one based on price alone. Think of it as getting a second opinion that confirms your diagnosis.
Another powerful tactic, especially for more patient traders, is to wait for a retest of the broken neckline. It’s very common for the price to break down, then pop back up to "kiss" the old support level goodbye. If that level holds as new resistance and the price gets rejected, the downtrend is truly on.
Trader's Insight: The retest gives you a second shot at entering the trade, often with a much tighter stop-loss and a better risk-to-reward ratio. It’s the market’s way of proving that the buyers tried to regain control and failed, confirming the sellers are now firmly in command of that price level.
Sure, you might miss the first part of the move by waiting, but you dramatically cut your risk of getting caught in a nasty fakeout. It’s a trade-off that experienced traders are often happy to make.
Now, let's pull all these concepts together into a simple checklist you can run through before ever clicking the "sell" button. Thinking through these steps is a core part of sound risk management for traders.
Before you jump into a trade, you need to be confident that the signal is solid. The following table provides a quick checklist to help you verify the strength of a potential breakdown.
Using a checklist like this isn't just about avoiding losses; it's about systematically improving your odds. Remember, historical analysis shows that a properly confirmed inverted cup and handle has an impressive 82% success rate in predicting further downside, with price drops averaging around 17%. By being patient and waiting for confirmation, you align your trades with these powerful probabilities.
Even after you get the hang of spotting and trading the inverted cup and handle pattern, you're bound to have some questions. It’s only natural. Let's walk through some of the most common "what ifs" that traders run into.
Think of this as your go-to cheat sheet. Getting these details straight will give you that extra bit of confidence when you see this bearish setup taking shape on a live chart.
This is usually the first thing people ask: "Does this thing actually work?" The short answer is yes, but there's a big "if" attached. The inverted cup and handle is a very reliable signal if you identify and confirm it correctly.
In fact, some studies of historical price action have shown it can predict a continued drop with over 80% accuracy. That’s why short-sellers love it. But that high success rate depends on getting all your ducks in a row:
Of course, no pattern is a crystal ball. The market can always surprise you, which is why smart risk management is a must—even with a setup that has the odds in your favor.
This is a crucial question because the time frame you're watching can completely change the game. You’ll find the inverted cup and handle on pretty much any chart, from the 1-minute charts that scalpers use all the way up to monthly charts for long-term position traders.
A Trader's Rule of Thumb: The longer the time frame, the more significant the pattern. A cup and handle on a daily, weekly, or monthly chart carries a lot more weight.
Why? A pattern that takes months to form represents a huge shift in market sentiment. It involves far more money and a stronger consensus among traders, so when it finally breaks, the move is often much more explosive. While you can definitely trade it on shorter time frames, you have to be extra careful. The constant noise of intraday price action means you're much more likely to get faked out by a false signal.
This scenario is exactly why you should never, ever trade without a stop-loss. If the price dips below the neckline only to snap back and climb above the high of the handle, the bearish party is over. The signal is now invalid.
A reversal like this tells you that the buyers have stormed back in unexpectedly. The downtrend you were banking on is probably not going to happen. The right move here is simple: cut the trade immediately. Sticking to your stop-loss ensures a small, manageable loss doesn't turn into a catastrophic one.
Yes, you absolutely can. One of the best things about the inverted cup and handle is its versatility. It’s not just a stock market pattern. You can find and trade it just as effectively in:
The reason it works everywhere is that it’s a picture of human psychology—hope turning into fear. That dynamic is universal in any market driven by people. Just remember to adjust your strategy for the unique volatility and trading volume of whatever asset you're focused on.
Tired of squinting at charts, trying to spot these patterns by hand? EzAlgo takes the guesswork out of it. Our tools automatically pinpoint key patterns, momentum shifts, and critical support and resistance levels directly on your TradingView chart. It's time to stop guessing and start making decisions with confidence. Check out EzAlgo and get instant access today!


%201.svg)