


You've probably noticed that markets don't move in a straight line. A stock that's soaring will inevitably pull back a bit before climbing higher. Likewise, a plunging asset will often bounce up temporarily before continuing its slide. This natural rhythm of the market—the ebb and flow of trends and counter-trends—is precisely what Fibonacci retracement levels help us understand.
Think of it like a rubber band. When you stretch it out (a big price move), it tends to snap back a certain distance before it settles or continues stretching. Fibonacci levels act as a guide, showing us the most likely points where the price might snap back to.
These aren't just random lines on a chart. They are key horizontal levels that pinpoint potential support and resistance areas. For traders, they are invaluable for figuring out where a pullback might run out of steam and reverse, making them a true cornerstone of technical analysis.
So, where do these magical lines come from? Their foundation lies in a famous number sequence discovered centuries ago by Leonardo Fibonacci. In this sequence, each number is the sum of the two preceding ones: 0, 1, 1, 2, 3, 5, 8, 13, 21, and so on.
What’s fascinating is that the ratios between these numbers appear everywhere—from the spiral of a seashell to the petals on a flower, and, as many traders believe, in the psychology of financial markets. By dividing numbers within the sequence, we get the key ratios used in trading:
While not an official Fibonacci ratio, the 50% level is also included by most traders because it represents the halfway point of a price move—a significant psychological barrier.
The core idea is simple: after a significant price move up or down, the price will often "retrace" or pull back to one of these percentage levels before continuing in its original direction. These levels act as a roadmap, highlighting where traders are likely to step in and push the price back on its original course. For a deeper dive, check out our guide on Fibonacci trading for beginners.
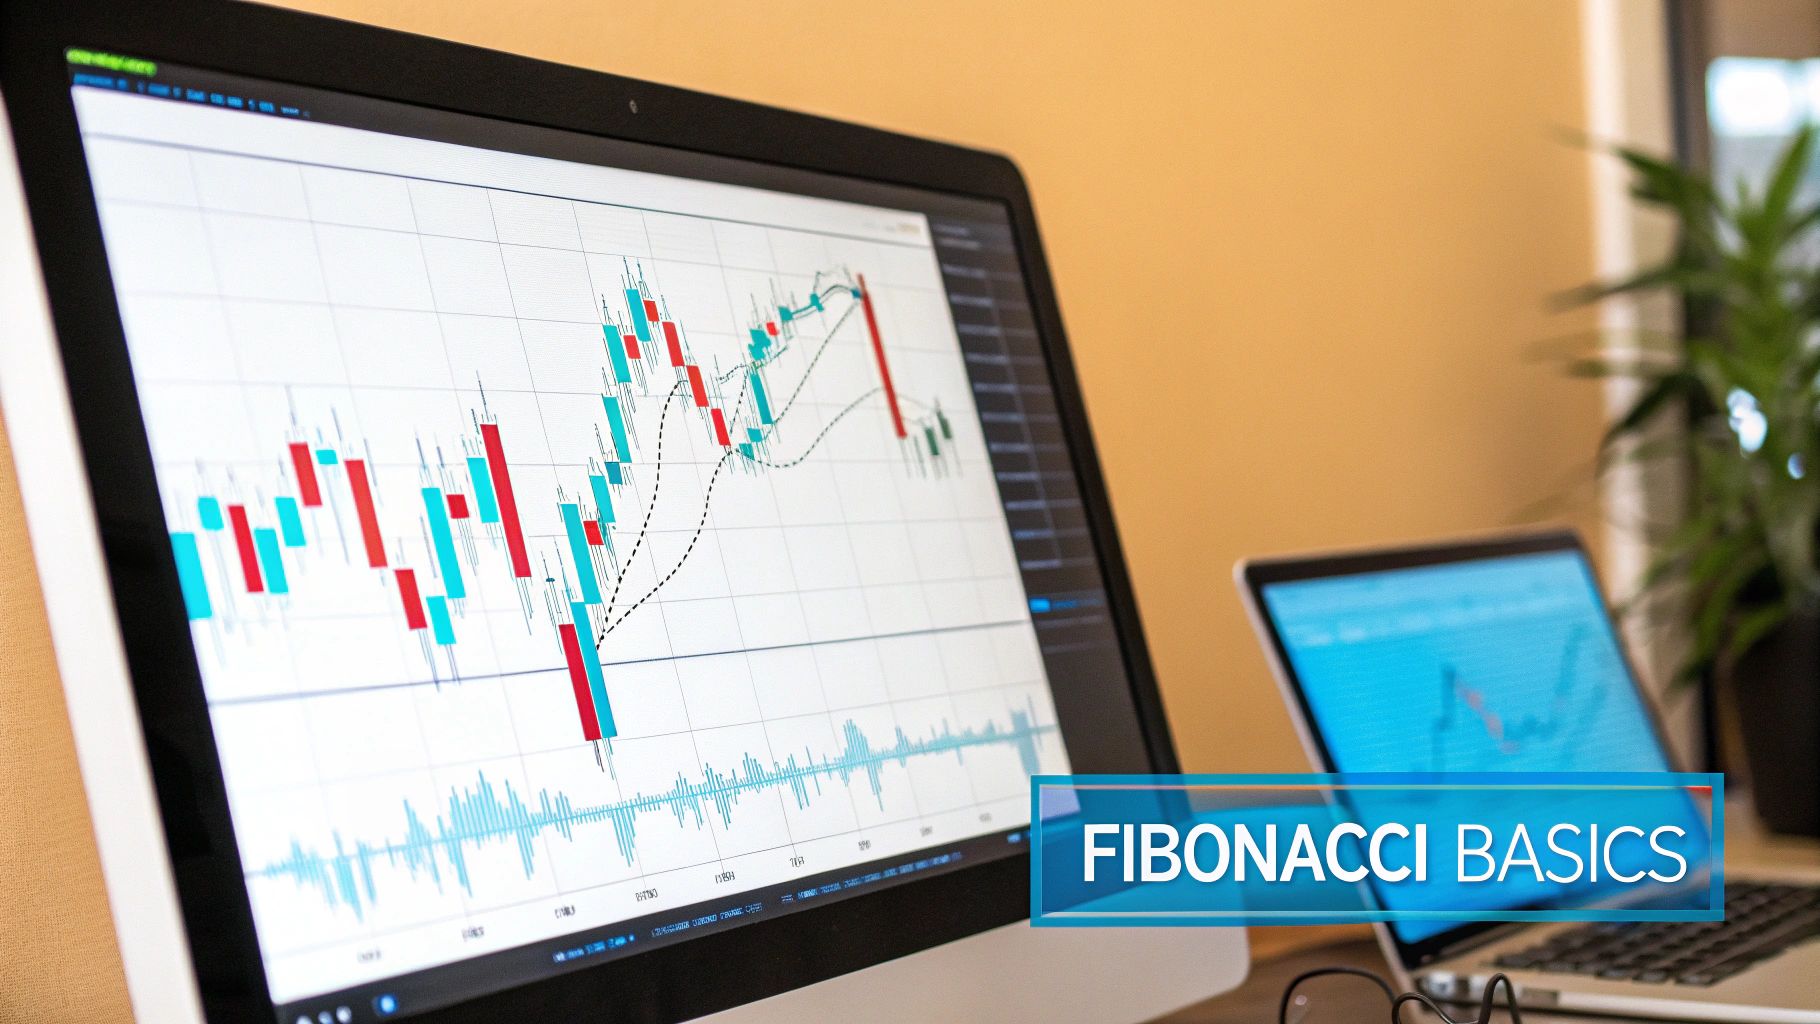
In the chart above, you can see these levels in action. After a strong move up, the price pulled back and found support right around the 0.618 (or 61.8%) level before resuming the uptrend. This is a classic example of Fibonacci levels helping a trader spot a prime entry point.
To help you keep these levels straight, here’s a quick reference table outlining what each level typically signifies during both uptrends and downtrends.
Think of this table as your cheat sheet. When you see a price approaching one of these key zones, you know it’s a potential decision point for the market, giving you a critical edge.
Getting your Fibonacci levels drawn correctly is the single most important step. The good news? It's much simpler than most new traders think. The accuracy of your Fibonacci retracement levels hinges entirely on picking the right starting and ending points.
Think of it like building a bridge—you need two solid anchor points on either side for it to be stable and useful. In trading, we call these the swing high and swing low. These are simply the highest peak and lowest valley within the specific trend you're analyzing. The entire Fibonacci structure gets built between these two points.
Nailing these anchor points is non-negotiable. If you choose the wrong swing high or low, you'll get inaccurate levels, which can lead to bad trades and missed opportunities. Let’s walk through how to find them and draw the levels for both uptrends and downtrends.
First things first, you need to spot a clear and significant price move. You can't draw meaningful Fibonacci levels in a choppy, sideways market where the price isn't really going anywhere. Look for a distinct uptrend or downtrend on your chart.
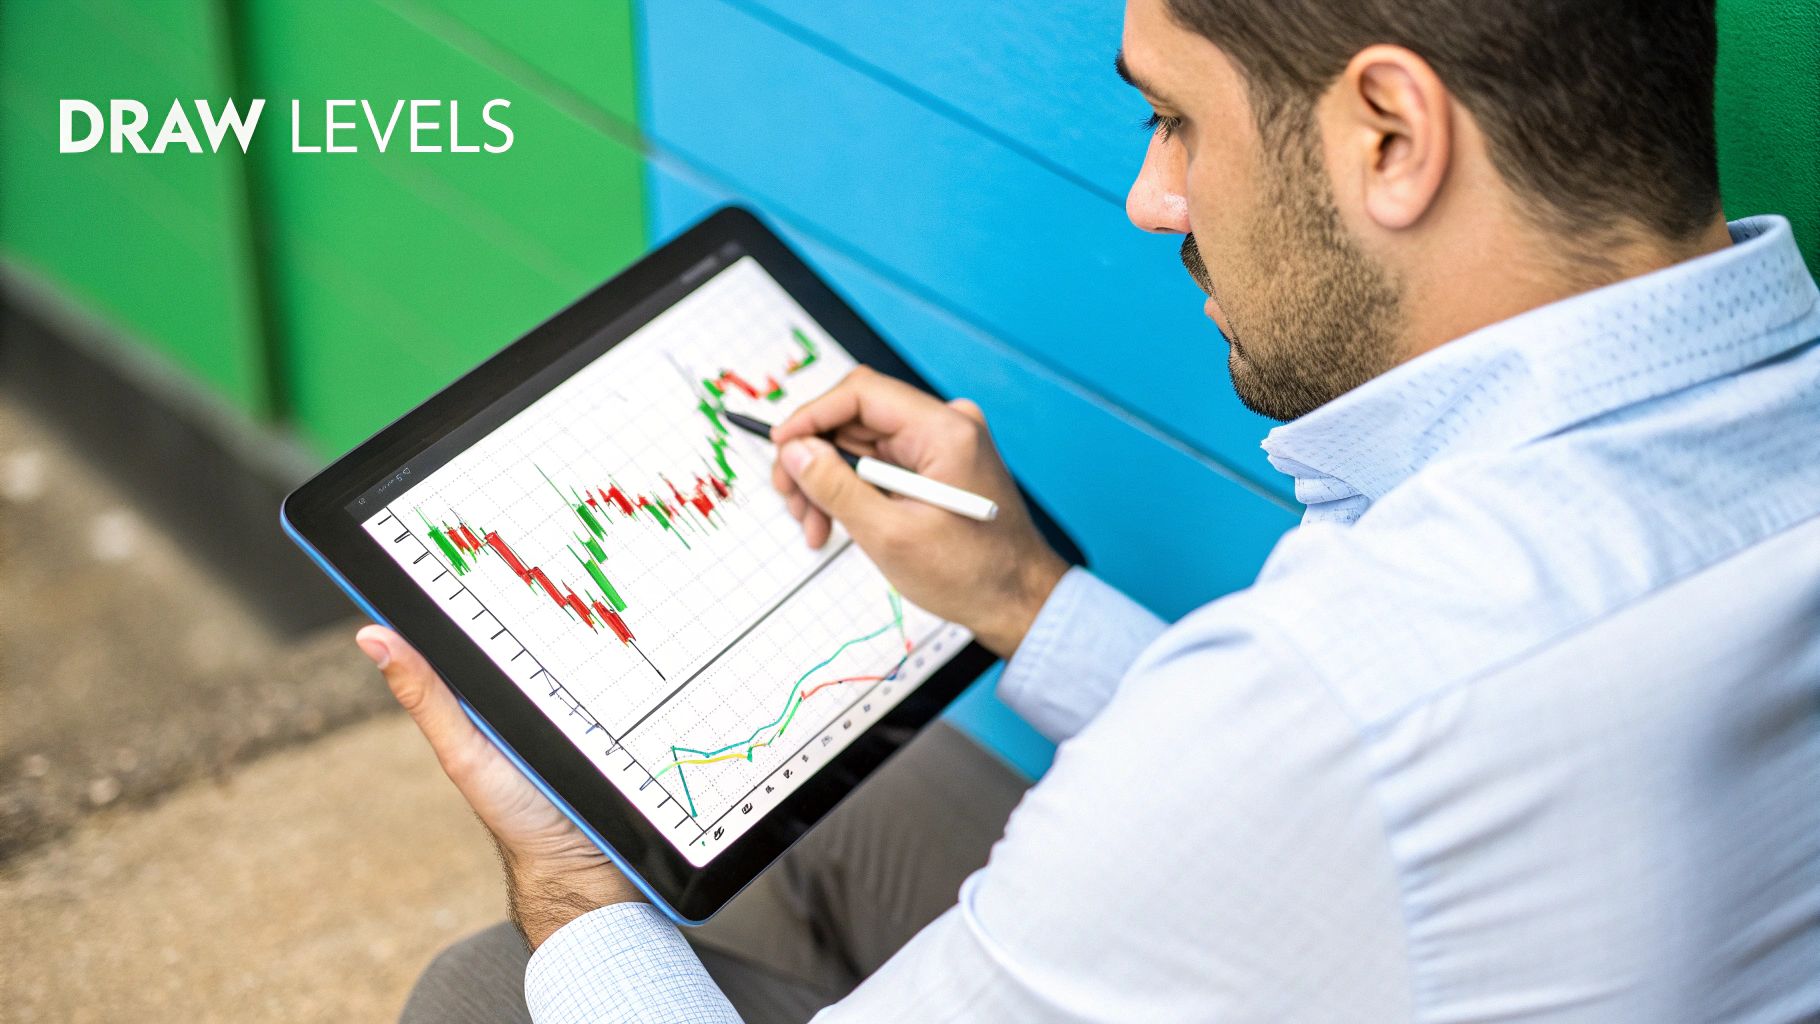
Once you've found a clear trend with a definite start and end, you're ready to grab the tool. The direction you draw the lines—from low to high or high to low—is crucial and changes depending on the trend.
In a bullish trend, you're trying to find potential support levels where a pullback might stop and the uptrend could kick back in. To do this, you draw the Fibonacci tool from the bottom to the top.
Your charting software will then automatically draw the key retracement levels (23.6%, 38.2%, 50%, 61.8%, etc.) between these two points. These horizontal lines are your potential support zones.
For a bearish trend, you just flip the process. Here, you're on the lookout for potential resistance levels where a temporary bounce might run out of steam before the price heads lower. To do this, you draw the Fibonacci tool from the top to the bottom.
This will plot the levels that could act as resistance, showing you where to watch for a potential short entry or signs that the downtrend is ready to continue.
This simple infographic sums up the core process for drawing your Fibonacci levels.
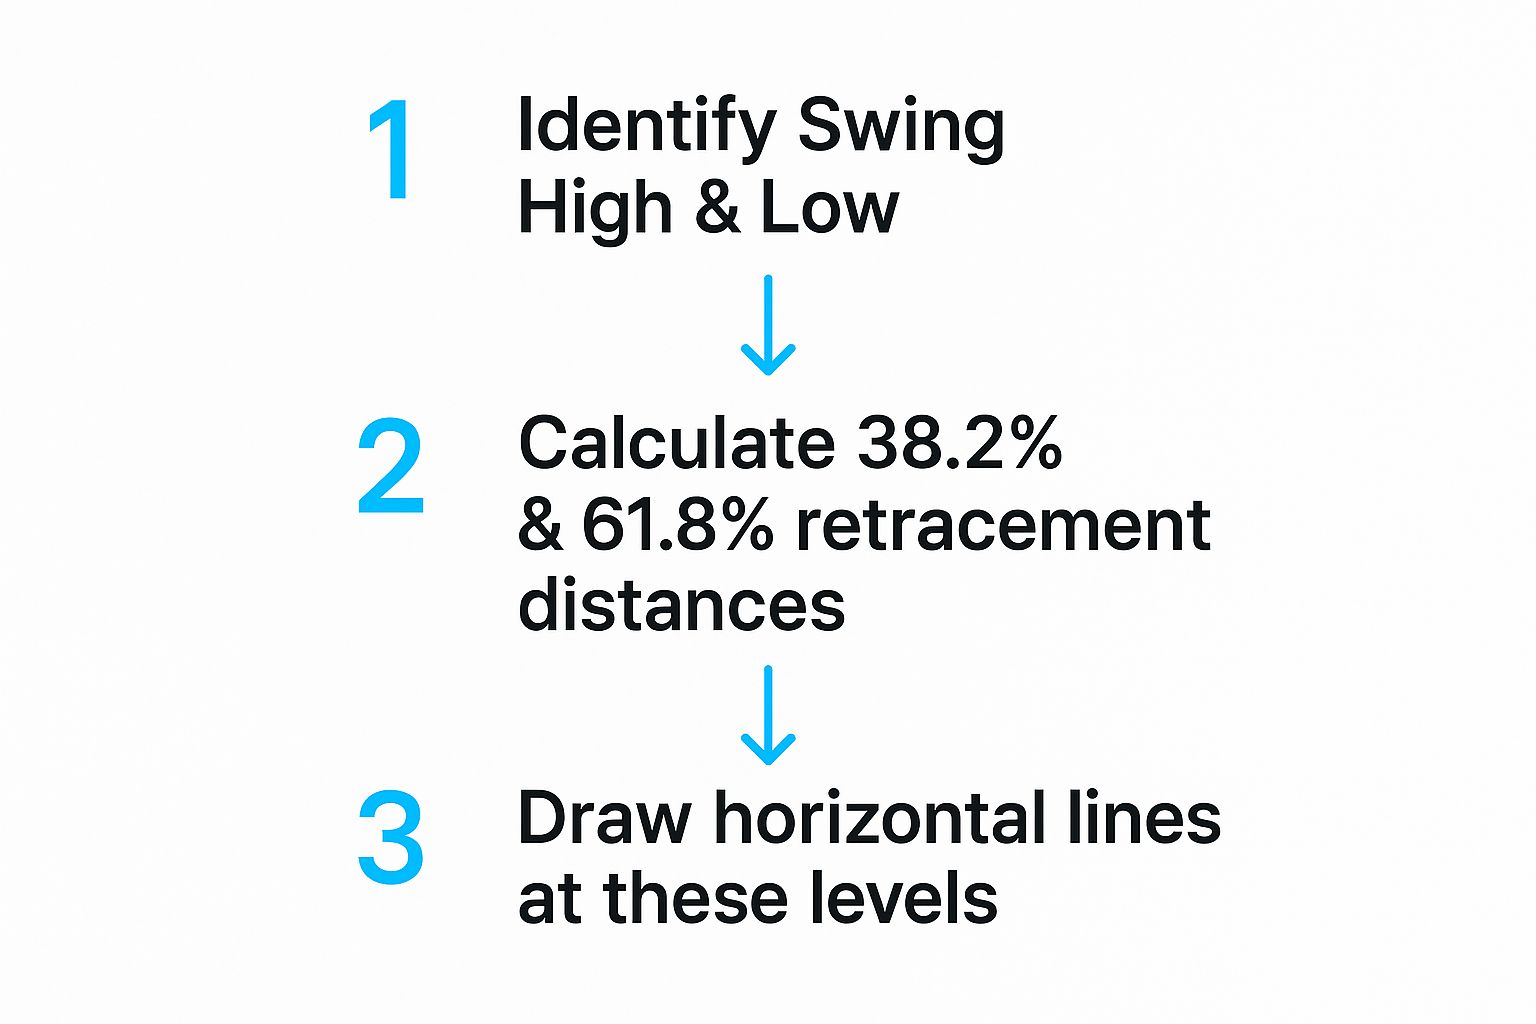
The key takeaway is that it’s all logical and sequential. It starts with finding the trend and ends with these incredibly useful horizontal levels appearing right on your chart.
Trader's Insight: Once drawn, these levels are static. They don’t change or "repaint" like many other indicators, giving you fixed reference points for your analysis.
This fixed nature is a huge advantage. Fibonacci retracement levels act as static price benchmarks that help traders see potential pullbacks and reversal points. Unlike indicators that are constantly changing with every new candle, these levels—including 23.6%, 38.2%, 61.8%, and 78.6%—stay put once you draw them. As CenterPoint Securities explains, this offers an objective framework rooted in both mathematics and market psychology.
As useful as Fibonacci retracement levels are, they rarely tell the whole story on their own. The most successful traders I know almost never use them in isolation. Instead, they look for moments when multiple signals point to the same conclusion, creating what we call confluence.
Think of it like building a case in court. A single piece of evidence might be interesting, but it's not enough to convince a jury. But when you have several independent pieces of evidence all pointing in the same direction? Your case suddenly becomes incredibly strong. In trading, that’s exactly what confluence is—when a key Fibonacci level lines up perfectly with another technical signal.
This approach transforms a simple line on your chart into a high-probability zone of interest. It gives you a much stronger reason to act, turning a potential support or resistance level into a validated one. You're no longer just relying on one tool; you're confirming its message with others, which dramatically improves your odds.
A solid trading strategy is all about layering different tools to see if they agree. When a Fibonacci level intersects with another key indicator, that price area deserves your full attention. Here are a few practical ways to find that overlap.
Moving Averages: A popular moving average, like the 50-day or 200-day MA, often acts as a dynamic floor or ceiling for the price. If a stock pulls back to the 61.8% Fibonacci level and that level just so happens to be where the 50-day MA is sitting, you've found a powerful confluence zone.
Support and Resistance Zones: These are the classic horizontal levels drawn from previous price highs and lows. When a Fibonacci level lines up with a well-established support zone, it creates a doubly reinforced floor that’s much harder for the price to break through.
Relative Strength Index (RSI): The RSI is a fantastic tool for gauging momentum and spotting overbought or oversold conditions. Picture this: the price drops to the 38.2% Fibonacci level right as the RSI dips below 30, signaling it's oversold. This combination suggests that selling pressure might be drying up right at a key support level, hinting at a potential reversal.
By combining these tools, you graduate from simply identifying potential levels to pinpointing high-probability reversal zones. This is the bedrock of a much more methodical and disciplined trading plan. For a deeper dive, our guide on developing a Fibonacci trading strategy covers even more advanced methods.
In the world of Fibonacci trading, you’ll hear traders talk about one area more than any other: the golden pocket. It’s a specific, high-interest zone that many pros watch like a hawk for powerful reversals.
The golden pocket is the area between the 61.8% and 78.6% Fibonacci retracement levels. It’s seen as a prime reversal zone because it represents a deep pullback that often traps emotional traders before the primary trend kicks back in with force.
Think of this zone as the market's final stress test for a trend. A dip into the golden pocket can shake out the nervous traders right before the real move happens. It's such a critical area that tools like EzAlgo even have features that auto-generate these golden pocket levels, saving you time and making sure you don't miss them.
Finding a great entry point is only half the battle. You also need a clear plan for taking profits. That's where Fibonacci extensions come in. While retracements help you figure out how far a price might pull back, extensions project how far the price might run after the pullback is over.
Once the price bounces off a retracement level (your entry), you can switch to the Fibonacci extension tool to set logical profit targets. The most common extension levels traders watch are:
These levels provide predefined targets to aim for, which helps you lock in profits systematically instead of just guessing when to get out. It turns a simple entry signal into a complete trading plan with a clear beginning, middle, and end.

It’s one thing to understand the theory, but seeing how Fibonacci retracement levels actually perform in the chaos of a live market is what builds real confidence. When you watch these levels hold up under pressure, the whole concept just clicks. Suddenly, they're not just abstract lines on a screen anymore; they become real, actionable points that can guide your trading decisions.
Think about it: these levels are so widely used that they almost become self-fulfilling prophecies. Millions of traders, from individual investors to huge institutional funds, are all watching the very same levels. This collective attention creates a powerful psychological effect, often providing the exact buying or selling pressure needed to make the price react right where you'd expect.
Let’s rewind to the sharp market correction in early 2018 for a classic example in the S&P 500. After a fantastic run-up, the market suddenly turned, and prices started falling fast. Panic was in the air, and everyone was asking the same question: where is the bottom?
Traders who knew their stuff immediately drew a Fibonacci retracement from the previous major low to the recent high to map out potential support zones. As the S&P 500 tumbled, it blew past the 23.6% and 38.2% levels without much of a fight. But then it approached the 61.8% level—the golden ratio. This is where things got interesting. The selling pressure started to dry up.
The 61.8% zone acted like a line in the sand. Buyers saw an opportunity and jumped in, creating a solid floor under the market. The index found its footing right there, reversed, and kicked off another powerful rally. It was a textbook case of the golden ratio saving a major bull trend.
This isn't just a U.S. market phenomenon, either. Research into other major markets shows similar patterns. For example, during the 2008 financial crisis and the 2020 pandemic crash, India's Nifty 50 index repeatedly found support at key Fibonacci levels. In fact, some analyses show that Indian stocks retrace to a key Fibonacci level about 70% of the time. The March 2020 crash famously turned around right at the 61.8% support. You can dive deeper into the historical success rate of Fibonacci retracements on blog.alphashots.ai.
The wild world of cryptocurrency offers even more dramatic proof of Fibonacci's power. Since crypto markets are so heavily influenced by technical analysis and trader sentiment, Fibonacci retracement levels are a huge deal. Take a classic Bitcoin rally, for instance.
After an explosive, near-vertical run, Bitcoin inevitably began to pull back. Traders drew their Fib levels from the start of the rally (the swing low) to the very top (the swing high) and waited. The price eventually sank into the "golden pocket"—that critical area between the 61.8% and 78.6% levels. This zone is a hot spot for reversals, and tools like EzAlgo even highlight it automatically for traders.
Here’s what typically happens in this scenario:
You'll see this pattern play out over and over again, whether you're looking at big-name stocks like Apple (AAPL) or major forex pairs like EUR/USD. A downtrend might hit a wall at the 38.2% resistance, or a major uptrend might find its footing at the 50% level. The more you study these real-world examples, the better you'll get at seeing these levels for what they are: a roadmap to market psychology.
Knowing how to use Fibonacci retracement levels is a fantastic skill, but honestly, knowing what not to do is often more valuable. So many traders, especially when they're new to the game, stumble into the same predictable traps. Getting a handle on these common slip-ups can save you a ton of frustration and help you build the discipline needed for long-term success.
The first and most common mistake? Picking the wrong anchor points. If you don't draw your levels from a truly significant swing high and swing low, the levels themselves are basically useless. It’s like building a house on a shaky foundation—the whole thing is doomed from the start.
Another classic error is trying to force Fibonacci levels onto the wrong type of market. This tool really shines in markets with a clear direction, whether that's a strong uptrend or a defined downtrend. If you try to apply it to a choppy, sideways market where the price is just bouncing around aimlessly, you're going to get a lot of noise and very few reliable signals.
This next one is probably the most dangerous mistake of all: trading a Fibonacci level the second price touches it. Seeing the price hit the 61.8% level and immediately jumping into a trade is a recipe for getting burned. A Fib level is just an area of interest, not a green light to buy or sell.
Key Takeaway: A Fibonacci level is a potential reaction zone, not a command to trade. Always wait for the market to confirm your idea before you put your money on the line.
So, what does confirmation actually look like? You’re looking for evidence that other traders are thinking the same thing you are—that buyers (in an uptrend) or sellers (in a downtrend) are actually showing up.
Here are a few things to watch for:
Waiting for that extra piece of the puzzle takes patience, but it can dramatically improve your odds. It's the difference between gambling on a number and making a strategic entry when the market validates your analysis.
On the flip side, we have "analysis paralysis." This happens when traders throw everything but the kitchen sink onto their charts. You see it all the time: Fibonacci levels drawn on every tiny swing, multiple moving averages crisscrossing each other, and three different oscillators at the bottom. It's just a mess.
When your chart is that cluttered, you can't see what really matters: the primary trend and the price action. You end up with a dozen conflicting signals that make it impossible to make a clear decision.
Keep it simple. Focus on one major trend and one primary set of Fibonacci retracement levels. Then, add just one or two other tools for confluence, like an RSI or a key moving average. A clean chart lets you focus, think clearly, and trade with confidence. Sidestep these common mistakes, and you’ll be in a much better position to use this amazing tool the right way.
Even after you get the hang of the basics, it's natural to have questions about using Fibonacci retracement levels in the heat of a real trading day. Let's tackle some of the most common ones I hear from traders, so you can start applying these levels with more confidence.
Ask ten traders this, and you might get ten different answers, but most will agree that the 61.8% level, the "golden ratio," is a heavyweight contender. It’s where you often see significant, trend-defining bounces. Think of it as a major psychological line in the sand where the battle between buyers and sellers really comes to a head.
But here’s the thing: the "best" level really depends on the personality of the trend you're watching. A super strong, runaway trend might only dip its toes in the water at the 38.2% level before taking off again. A weaker, more hesitant trend might need to pull all the way back to the 61.8% or even the 78.6% level to gather steam.
Trader's Insight: The most reliable level isn't a magic number. It's the one that lines up with other clues on your chart—like a key support area, a moving average, or a trendline. Don't just trust the level; wait for the price to prove it's respecting it.
Absolutely. That's one of the most beautiful things about them. The math behind Fibonacci is universal, which means the tool works just as well on a 1-minute chart for a quick scalp as it does on a weekly chart for a long-term investment. The underlying principle doesn’t change.
That said, there's a definite hierarchy you need to respect.
A powerful strategy many pros use is to find major Fibonacci retracement levels on a high timeframe, then drill down to a lower one to fine-tune their entry and manage the trade with more detail.
This is a common point of confusion for new traders, but the difference is simple and crucial. Although they both use Fibonacci ratios, they answer two completely different questions.
Fibonacci Retracement
Fibonacci Extension
Put simply: retracements are for your entry, and extensions are for your exit.
This is the million-dollar question, isn't it? The answer has less to do with magic and more to do with mass psychology. Fibonacci levels work because of a powerful market dynamic: the self-fulfilling prophecy.
Think about it. Millions of traders all over the world, from small retail accounts to giant hedge funds, have been taught to use this exact same tool. They are all drawing the same lines and watching the same levels.
So, when the price starts nearing a key level like 61.8%, what happens? A huge number of traders place their buy or sell orders right there. This sudden flood of orders is what creates the support or resistance the tool was predicting in the first place. They aren't foolproof, but their widespread use gives them a real, measurable edge in the market.
Ready to stop guessing and start seeing these critical levels on your charts automatically? EzAlgo integrates advanced algorithms directly into your TradingView charts, instantly identifying high-probability zones like the golden pocket. Eliminate the manual work and trade with the precision of AI. Get EzAlgo and supercharge your trading today.


%201.svg)