


For many new traders, looking at a stock chart can feel like trying to decipher a chaotic, unpredictable puzzle. Prices jump up and down, seemingly at random, making it tough to make decisions with any confidence. But what if you had a tool that could act like a map, highlighting probable areas where the market might pause or change direction? This is exactly what Fibonacci trading for beginners offers. It doesn't give you a crystal ball, but it does provide a logical way to anticipate potential turning points, helping to turn market noise into actionable insights.
This method is grounded in a mathematical sequence discovered nearly 800 years ago by the Italian mathematician Leonardo Fibonacci. This sequence (0, 1, 1, 2, 3, 5, 8, and so on) appears everywhere in nature, from the spiral of a seashell to the petals of a flower. For traders, the magic isn't in the numbers themselves but in the ratios derived from them, especially the golden ratio of 1.618 and its inverse, 0.618. Analysts observed that financial markets often react at levels corresponding to these same ratios. You can learn more about the mathematical origins of these powerful trading tools.
Think about stretching a rubber band. The farther you pull it, the stronger the force snapping it back. Financial markets often move in a similar way. After a strong push in one direction, a "pullback" or a breather is a normal and healthy part of the trend. Fibonacci analysis gives us a way to measure how deep that pullback might go before the original trend is likely to continue.
From this simple mathematical progression, we get key percentages like 23.6%, 38.2%, and 61.8%. These become the core of Fibonacci retracement levels. They aren’t just arbitrary lines drawn on a chart; they represent potential zones of balance where the battle between buyers and sellers could shift.
So, why do these levels seem to work so often? A large part of the answer is human psychology. Millions of traders, from retail investors to massive hedge funds, are all watching the same Fibonacci levels on their charts. When a price dips to a well-known level like the 61.8% retracement, it triggers a collective response.
This shared awareness creates a powerful market dynamic:
This collective action is what turns a mathematical theory into a practical tool for the markets. By learning to spot these zones, you can move from simply reacting to price swings to anticipating where the next wave of activity is likely to occur. It helps you see the underlying structure in what once looked like chaos.
Think of a major market move as a story. The initial surge is the rising action, but every good story has moments of tension and suspense—this is the pullback. A pullback is where the price takes a breather before its next big move. Fibonacci levels act as chapter markers, showing you where the plot might turn next. Learning Fibonacci trading for beginners is about reading these crucial signposts.
The core of Fibonacci trading is understanding key retracement levels derived from the famous number sequence, like 23.6%, 38.2%, 50%, 61.8%, and 78.6%. These percentages highlight potential support and resistance zones where a price trend might pause or reverse. For example, if a stock rallies from $10 to $20 and then pulls back to $15, it has just completed a 50% retracement of that initial climb. You can get more details on how Fibonacci retracements work on johnrothe.com.
The infographic below shows how the key retracement levels are connected to the core Fibonacci sequence.
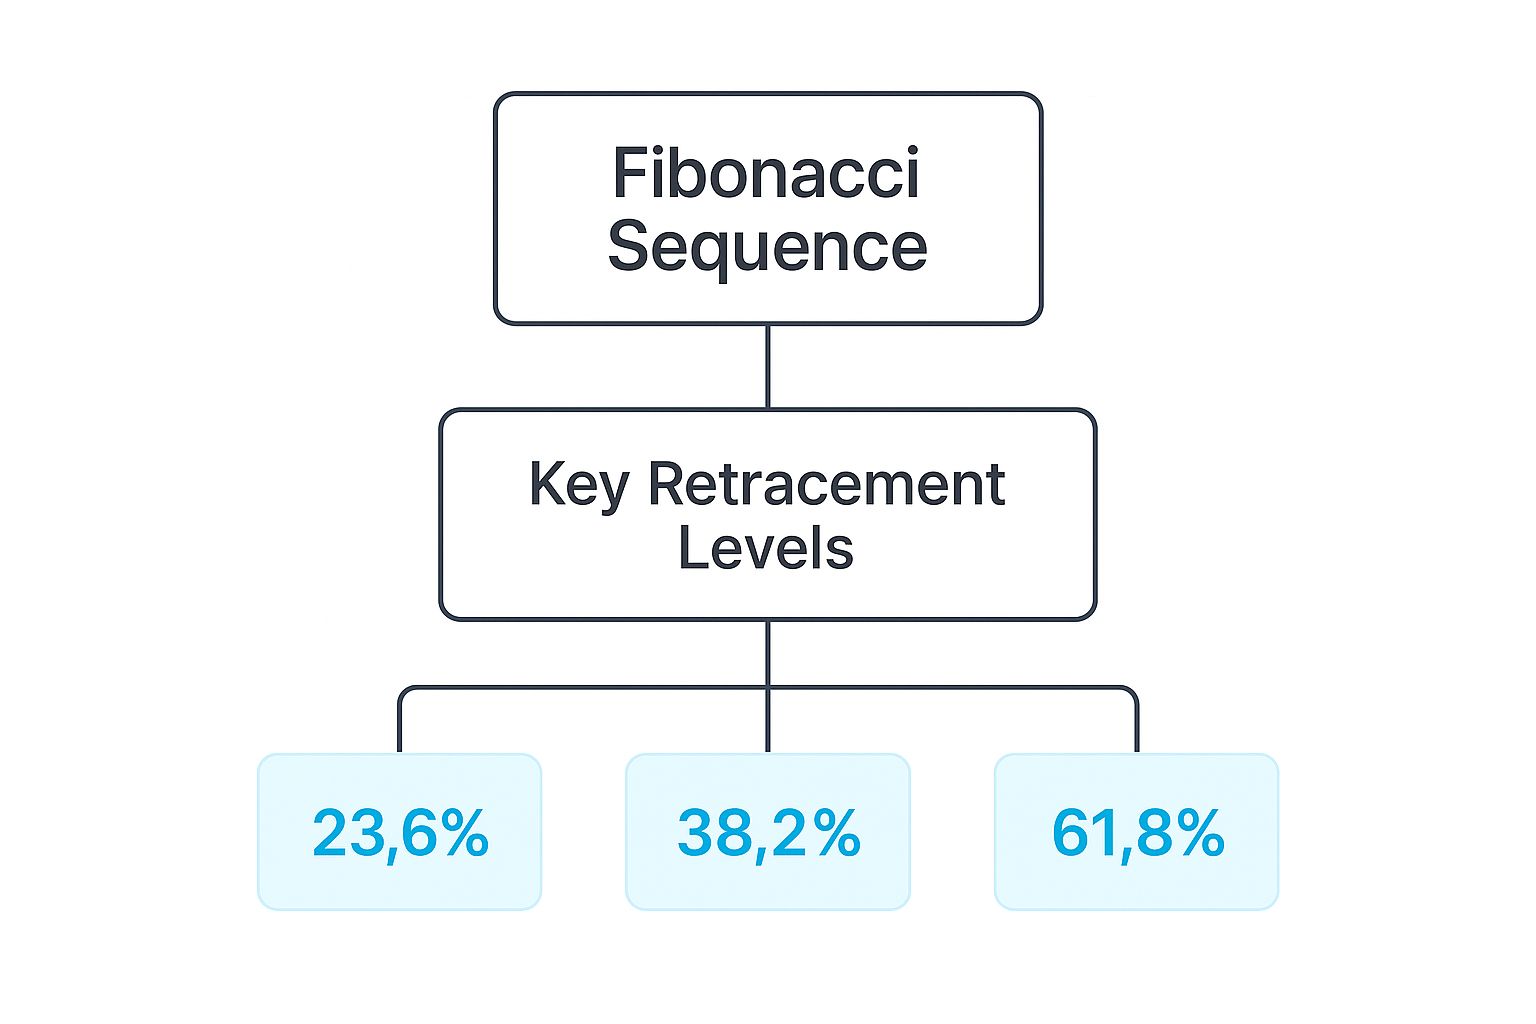
This visual makes it clear that the sequence is the foundation, giving rise to the practical retracement levels that traders draw on their charts.
Each Fibonacci level signals something different about the strength of the current trend. They aren't all equal, and a skilled trader interprets them based on the market context. Imagine a stock climbing from $50 to $100. The point where buyers step in during the pullback reveals their commitment and confidence.
To help you keep these levels straight, here is a detailed table breaking down their significance and how traders use them.
Essential guide to each Fibonacci level and how professional traders use them for entries, exits, and risk management
This table shows that each level has a distinct personality. The shallow levels (23.6%, 38.2%) signal strength, the 50% level shows balance, and the deeper levels (61.8%, 78.6%) represent critical tests of the trend's resolve.
By understanding what each level means, you can move from guessing to anticipating. You see a shallow 38.2% pullback and recognize it as a potential sign of strength. You spot the price nearing the 61.8% golden pocket and know that a decisive battle between buyers and sellers is about to happen.
These insights are fundamental building blocks for many effective trading strategies for beginners. This is how you can transform a chaotic chart into a readable map of market sentiment, giving you an edge over those who only see random price movements.
Knowing the theory behind Fibonacci levels is one thing, but applying them accurately on a live chart is where the real skill lies. This is where a platform like TradingView becomes essential, as its tools make plotting these key levels straightforward. Getting this step right is the foundation of effective Fibonacci trading for beginners—if your lines are off, your analysis will be flawed from the start.
The whole process comes down to correctly identifying two points: a significant swing high and a significant swing low. Think of these as the major peaks and valleys in the price's journey. You're looking for a clear, uninterrupted price move to measure. An uptrend is a series of higher peaks and valleys, while a downtrend is marked by lower ones.
Below is an example of where to find the Fibonacci Retracement tool in the drawing panel within TradingView.

This screenshot shows the tool's location on the left-hand toolbar, making it easy to access and apply to your charts.
Let's walk through the exact process for drawing Fibonacci retracement levels during an uptrend. The goal is to measure a potential pullback, so we need to define the main upward move.
For a downtrend, you simply reverse the process. Click the swing high first, then drag down and click the swing low. This will project potential resistance levels where a temporary rally might lose steam.
Drawing perfect lines takes practice. A common mistake is connecting minor, insignificant price wiggles, which creates unreliable levels. Always use major, obvious swing points that define the primary trend you are analyzing. For better precision, many traders use the magnet tool in TradingView, which automatically snaps your drawing point to the nearest candle high or low.
You can also customize the tool to improve how you read the chart. In the tool's settings, you can easily change the colors of your levels. Some traders make the 61.8% level a distinct color, like gold, to emphasize the importance of the "golden pocket." With a little practice, drawing these lines will become second nature, giving you a clear view of the market's underlying structure.

Drawing Fibonacci lines on your chart is just the first step. The real skill is in learning to translate those lines into smart trading decisions. Seeing the price simply touch a Fibonacci level isn’t a signal to trade. You need to become a market detective, watching how the price behaves at these important zones.
Is it bouncing off the level with strength, or is it hovering with indecision? This price action is the market's language, telling you whether a trend is likely to continue or reverse. For example, a sharp bounce off the 38.2% level during a strong uptrend is a classic sign of continuation. It suggests that buyers are still in control and ready to push the price higher.
However, if the price cuts through that same level on high volume without pausing, it could be a warning that the trend is losing its power. Mastering Fibonacci trading for beginners is about learning to tell the difference between a healthy pullback and the start of a reversal.
The most seasoned traders rarely rely on a single indicator. Instead, they search for confluence—a scenario where several independent signals all point to the same conclusion. This is how you can stack the probabilities in your favor and avoid the false signals that often trap new traders.
Imagine a stock is falling toward its 61.8% golden pocket retracement level. On its own, that’s an interesting area to watch. But what if that same price level also aligns with other factors?
When multiple signals line up like this, it creates a high-probability trade setup. Each extra factor adds another layer of confirmation, giving you more confidence to enter a position. This method changes Fibonacci levels from simple lines into reinforced zones of market interest. Our EzAlgo tools at EzAlgo.ai are designed to automatically spot these key areas, including auto-generated golden pockets, helping traders identify confluence zones without the manual work.
To add another layer of certainty to your trades, professionals use multi-timeframe analysis. Before acting on a Fibonacci level seen on a 1-hour chart, they'll check the 4-hour or daily chart. Does the longer-term chart show a strong trend that supports your trade idea?
If the daily chart is in a solid downtrend, trying to buy a small bounce on the 1-hour chart is like swimming against a strong current—it’s a low-probability move. Real confirmation comes when the story is consistent across multiple timeframes, which provides a much stronger reason to act.
To help you get started, this table breaks down how to interpret price action at key Fibonacci levels, turning charts into actionable insights.
This table serves as a guide for building your confidence. As you gain experience, you'll learn to read these signals more intuitively, combining them with your overall market analysis for better results.
Theory is important, but seeing a strategy work with real money on the line is what truly builds confidence. The real power of Fibonacci trading for beginners becomes clear when you see it applied during major market events. These mathematical levels aren't just abstract lines on a chart; they often represent key battlegrounds where the direction of huge companies like Apple, Microsoft, and Google is decided.
Think about the major market corrections that have tested every investor's courage, like the steep downturns in 2008 and March 2020. During these chaotic times, the S&P 500 found crucial support at key Fibonacci levels. As the market dropped, traders who drew retracement levels from the previous major low to the recent high were watching the 61.8% level very closely.
Again and again, this "golden pocket" acted as a solid floor. It attracted a flood of buyers who saw it as a discount opportunity, which helped spark a powerful rebound. These examples demonstrate that even in moments of extreme fear, Fibonacci analysis offered a logical roadmap for potential turning points.
This isn't just a U.S. market trend; it's seen worldwide. Historical data shows a convincing success rate for Fibonacci retracement levels across international markets. For instance, in the Indian stock market, studies reveal that stocks pull back to one of the main Fibonacci levels about 70% of the time before either continuing their trend or reversing. This consistency shows why so many traders depend on this tool. You can find more details on the historical performance of Fibonacci retracements.
Let's walk through a typical successful trade using a popular stock like Apple (AAPL) as an example.
These real-world examples aren't about discovering a magic formula. They are about using a tool to pinpoint high-probability zones where risk is managed and the potential for reward is clear. By studying these success stories, you can train your eye to spot similar patterns as they unfold in live markets, giving you the confidence to act when a great setup appears on your own charts.
Even with a powerful tool like Fibonacci analysis, the road to successful trading has its share of pitfalls. Learning Fibonacci trading for beginners isn't just about how to draw the lines, but also how not to. Avoiding common errors is just as important as finding the perfect entry point. Too often, traders excited by a new technique make costly mistakes that are entirely preventable.
The most common and expensive mistake is trying to force the Fibonacci tool to fit a chart. A trader who just learned about retracements suddenly sees potential setups everywhere. They start connecting minor price wiggles, creating a confusing web of levels that don't mean anything. This is a classic case of confirmation bias—you see what you want to see, not what the market is actually telling you. Real analysis demands patience; wait for a clear, strong trend with obvious swing high and swing low points before you measure.
Another major trap is depending only on Fibonacci levels without looking at the bigger picture. Seeing the price hit the 61.8% "golden pocket" is noteworthy, but it’s not an automatic signal to buy or sell. Trading on that alone is a gamble. A smart trader always asks more questions:
Forcing a trade just because a price touches a line is a recipe for losing money. This isn't just a Fibonacci problem; it's a hurdle many new traders face. Understanding these psychological traps is a huge part of growing as a trader, as detailed in this guide on 5 common beginner mistakes when stock trading and how to avoid them.
Finally, many beginners don't understand how price behaves around key levels. They expect a perfect, clean bounce the moment a Fibonacci line is touched. But markets are rarely that neat. Price will often dip slightly below a support level—an action called a "wick"—to hunt for liquidity before reversing higher. Panicking and closing your trade at the first hint of a break is a classic rookie move.
Instead, it's often wiser to wait for a full candlestick to close above or below the level to confirm whether it's holding or breaking. Patience is a trader’s greatest asset, especially when a critical level is being put to the test. By sidestepping these common traps, you can dramatically improve your odds and turn Fibonacci analysis into a real analytical advantage.
Turning a collection of trading ideas into a solid, repeatable system is the final and most important step in learning Fibonacci trading for beginners. A trading system isn't just a strategy; it’s the full blueprint that dictates how you find, enter, and manage every single trade. This is what separates traders who find consistent results from those who are just getting lucky.
A well-designed system ensures your choices are driven by logic instead of emotion, whether you're trading for five hours or just five minutes a day. The goal is to build a framework around your own trading style, risk comfort, and personal schedule. It’s about setting non-negotiable rules that guide every move you make in the market.
The first step is to build a clear framework that answers the key questions for any trade you're thinking about taking. Think of this blueprint as your pre-flight checklist, making sure you never overlook a critical step. Your system should clearly outline your process from start to finish.
Core Components of a Fibonacci Trading System:
No trading system is whole without strict money management rules. A fundamental principle here is position sizing: you should never risk more than 1-2% of your total trading account on any single trade. This discipline ensures that an unlucky streak of losses—which is inevitable for every trader—won't knock you out of the game. It allows you to survive long enough for your system's statistical edge to work in your favor.
Finally, you must keep a detailed trading journal. For every single trade, you should log:
This journal is your personal data mine. Over time, it will clearly show you which Fibonacci patterns work best for your style and where your weaknesses lie. This feedback loop—planning, executing, and reviewing—is what will mold you into a disciplined and consistently improving trader.
Are you ready to build a system with tools that do the heavy lifting for you? EzAlgo offers automated Fibonacci levels, including golden pockets and extension targets, directly on your TradingView charts. This helps you spot high-probability setups faster and trade with greater precision. See how EzAlgo can become the core of your trading system.


%201.svg)