


Fibonacci extension levels are a trader's go-to tool for one crucial task: figuring out where a price might be headed after it pulls back and then continues its original trend. They're all about setting profit targets.
While their cousins, the Fibonacci retracement levels, help you spot potential entry points during a pullback, extensions are forward-looking. They help you answer the million-dollar question: "Where should I take my profits?" This makes them a fundamental part of any solid exit strategy.
Here’s a simple way to think about it: imagine a slingshot. The first big price move is you stretching the elastic band forward. The pullback, or retracement, is you pulling that band back, loading it with tension.
The Fibonacci extension levels are your guide to where the projectile is likely to land once you let go and the trend takes off again.
This powerful tool helps you stop guessing and start setting realistic, data-informed profit targets. Instead of closing a winning trade too soon out of fear or too late out of greed, you can identify specific zones where the market's momentum is likely to stall or even reverse.
At its core, using Fibonacci extensions is all about answering one of the most important questions in trading: "If this trend keeps going, how far can it run?" This becomes incredibly useful when a stock or asset breaks into all-time highs or lows—a situation traders call "price discovery." In these moments, there's no past price history to give us clues about support or resistance.
Extensions fill that void by providing a logical roadmap built on mathematical ratios. And here's the key: a lot of other traders are watching these exact same levels. When a critical mass of market participants has their eyes on the same price zones, they often become self-fulfilling prophecies where waves of buying or selling hit the market.
Simply put, Fibonacci extension levels give you a forward-looking map for your trades. They help you see potential destinations for the price once a trend proves it has the legs to continue.
Even though they both spring from the same mathematical sequence, extensions and retracements have completely opposite jobs. Getting this right is critical. We have a complete guide to help you master Fibonacci retracement levels here: https://www.ezalgo.ai/blog/master-fibonacci-retracement-levels, but here’s the quick version:
When you use both tools together, you create a much more complete trading plan. You can use retracements to find a great entry during a pullback, and then immediately use extensions to map out exactly where you plan to exit. It's a systematic approach that helps take the emotion out of your trading decisions.
Ever wondered why the market seems to hit invisible walls or find support at seemingly random price points? It often feels like magic, but the reality is much more grounded in math—a special sequence of numbers that shows up everywhere, from seashell spirals to massive galaxies.
This is the world of Fibonacci, and you don't need to be a math whiz to get it. Understanding the simple logic behind it is all it takes to unlock the power of Fibonacci extension levels.
The whole idea starts with a simple string of numbers: 0, 1, 1, 2, 3, 5, 8, 13, 21, and on it goes. Each number is just the sum of the two that came before it. But the real magic happens when you look at the relationship between these numbers.
As you go further down the sequence, try dividing any number by the one just before it (like 21 divided by 13). You'll notice the result gets closer and closer to 1.618. This isn't just some random number; it's the famous Golden Ratio, a constant that pops up all over nature in patterns of growth and harmony.
This ratio is the beating heart of Fibonacci extensions. It’s the reason why the 161.8% level is such a big deal. When traders see the price moving toward that level, they aren't just looking at a line on a screen. They're watching a target derived from a mathematical principle that's deeply wired into market psychology.
The Golden Ratio (1.618) is the foundation for the most powerful Fibonacci extension levels. It turns abstract lines into logical price targets based on a universal mathematical constant.
This connection gives these levels a real basis for why they so often work. They mirror the natural ebb and flow of human behavior and market dynamics, which tend to play out in rhythmic waves—just like the patterns found in the natural world.
The great thing about Fibonacci extensions is that you don't need a complicated formula. The calculations are based on three simple points on your chart: the start of a trend, the end of that trend, and the bottom of the pullback that followed. From those three points, your trading tool projects the key Fibonacci extension levels outward.
Let's look at the most common ones you'll see:
At their core, Fibonacci extension levels use the Golden Ratio and its derivatives to map out where the price might go next. If you want to go deeper into how these ratios are applied, resources like Tickeron.com offer more detailed explanations on technical analysis.
Once you grasp this simple math, the lines on your chart are no longer a mystery. They become a logical roadmap, with each level telling you something about the trend's strength. This gives you a clear, data-backed way to set your profit targets and manage your trades with a whole lot more confidence.
Knowing the theory behind Fibonacci extension levels is one thing, but actually applying them on a live chart is where the rubber meets the road. It might look technical, but drawing these levels is a straightforward, three-click process that any trader can get the hang of.
The entire trick is to get those three points right. Nail that, and you'll be able to project surprisingly reliable profit targets.
First things first, you need to find a clear, significant price move. This is your starting point, often called a "Swing High" and "Swing Low." Don't get bogged down in the minor wiggles and noise on the chart; you're looking for a substantial, obvious wave of movement that defines the trend.
Think of this first step as defining the market's initial burst of energy. This is the move you expect the price to continue after it takes a quick breather.
After that initial surge, the market almost always pulls back a bit. This is called a "retracement." Your second job is to figure out exactly where this pullback runs out of steam and the price starts heading back in the original direction.
This third point—the end of the retracement—is crucial. In an uptrend, it's a higher low; in a downtrend, it's a lower high. It’s the signal that the brief counter-move is over and the main trend is ready to get going again.
One of the biggest mistakes traders make is jumping the gun and drawing the tool before the retracement has clearly finished. You have to be patient. Wait for the price to confirm its turn before you plot that third point.
Once you have your three points locked in, you're ready to draw. Most trading platforms, like TradingView, have a tool specifically for this, usually called "Trend-Based Fib Extension."
Here’s the simple click-by-click process:
As soon as you make that third click, the platform will automatically project the key Fibonacci extension levels onto your chart. You'll see potential profit targets like 127.2%, 161.8%, and 261.8% appear as if by magic.
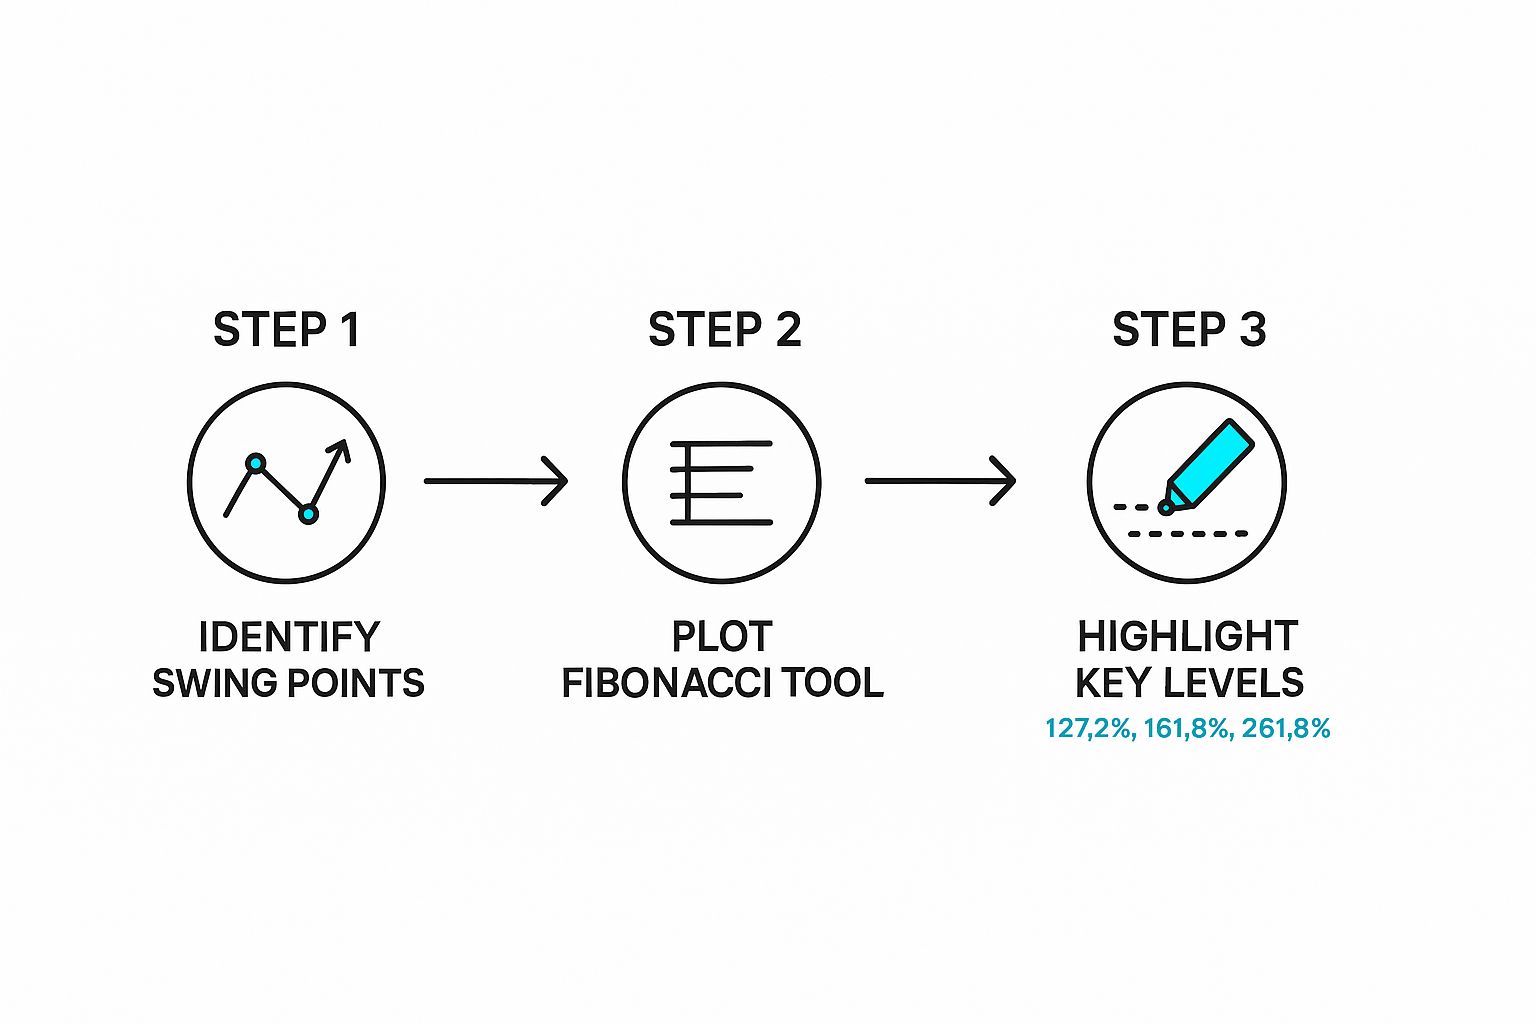
This visual shows you just how systematic it is: identify the trend, spot the pullback, and then project where the price could go next.
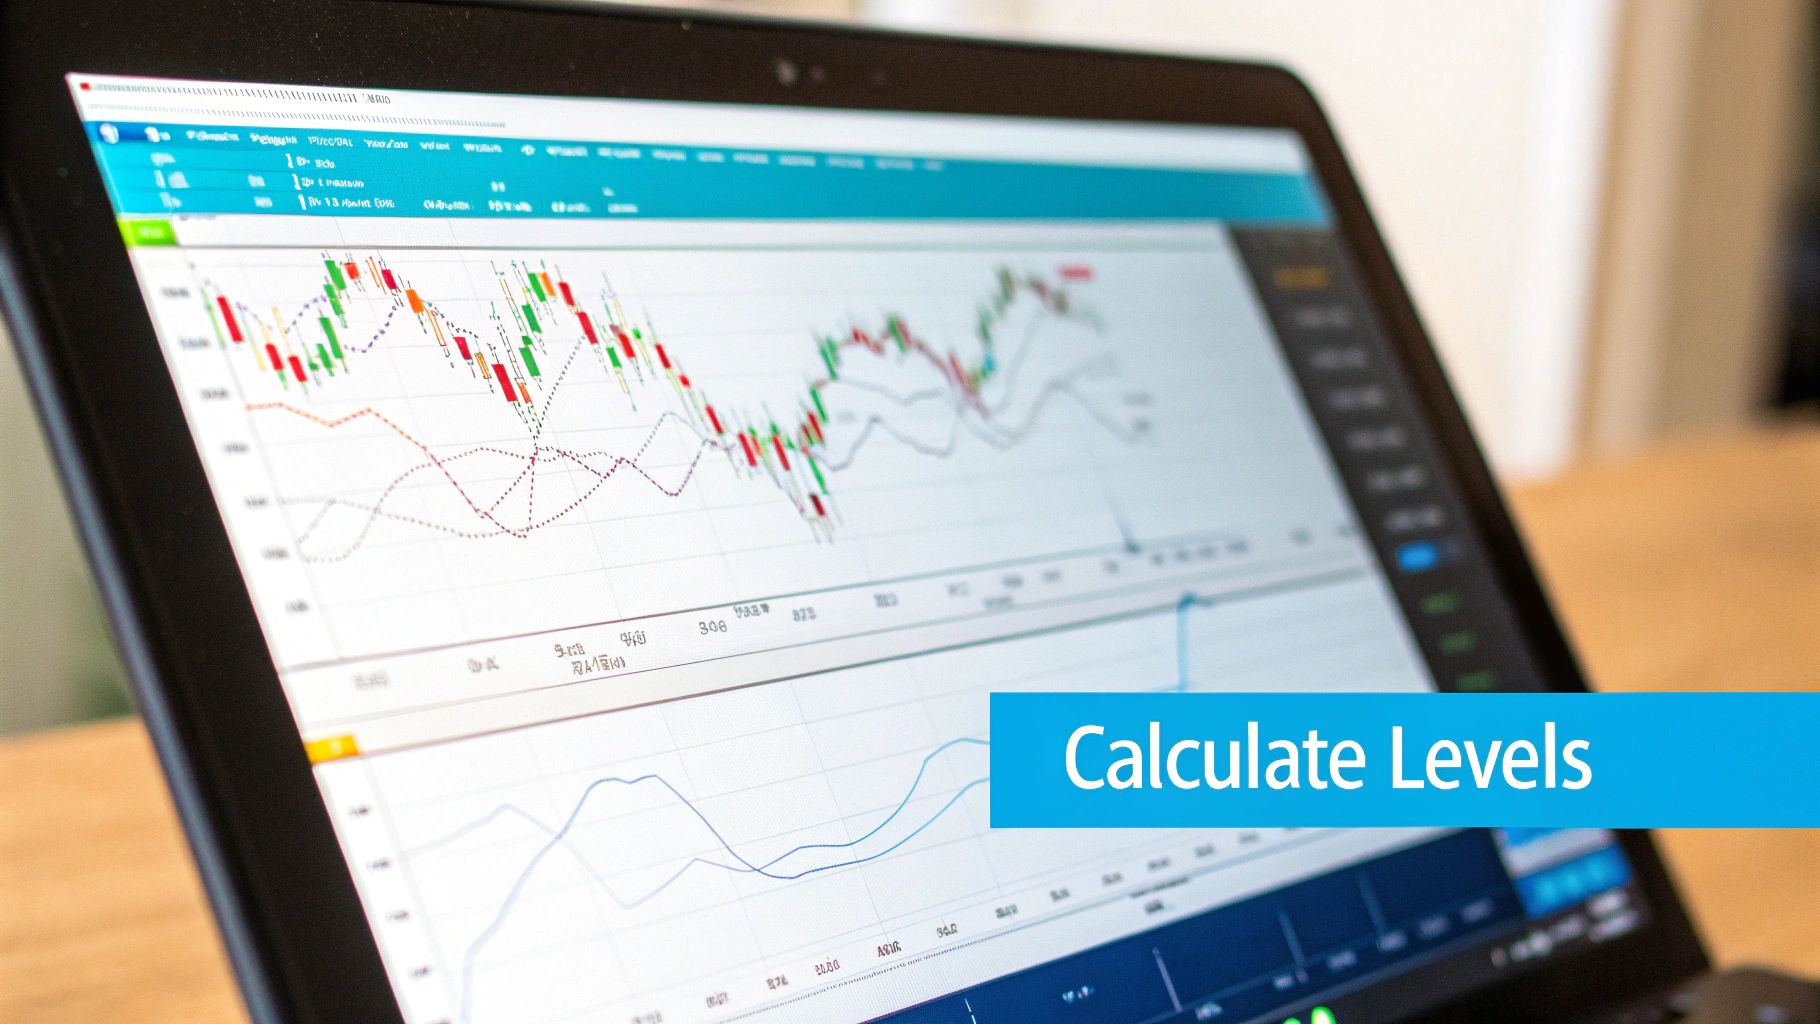
Let’s walk through a quick example. Imagine a stock moves from $100 (Swing Low) up to $150 (Swing High). It then dips to $120 (the end of the retracement) before starting to climb again.
Just like that, your chart will show extension levels above $150, giving you clear, data-driven targets for where the uptrend might be headed.
Now, let's look at a downtrend. A crypto asset falls from $50,000 (Swing High) down to $40,000 (Swing Low). It then bounces back up to $44,000 (the end of the retracement) before starting to drop again.
The tool will now project key levels below $40,000, mapping out potential areas to take profit as the price continues its slide. Once you get this three-click process down, a tool that sounds complicated becomes a simple, repeatable part of your trading routine.

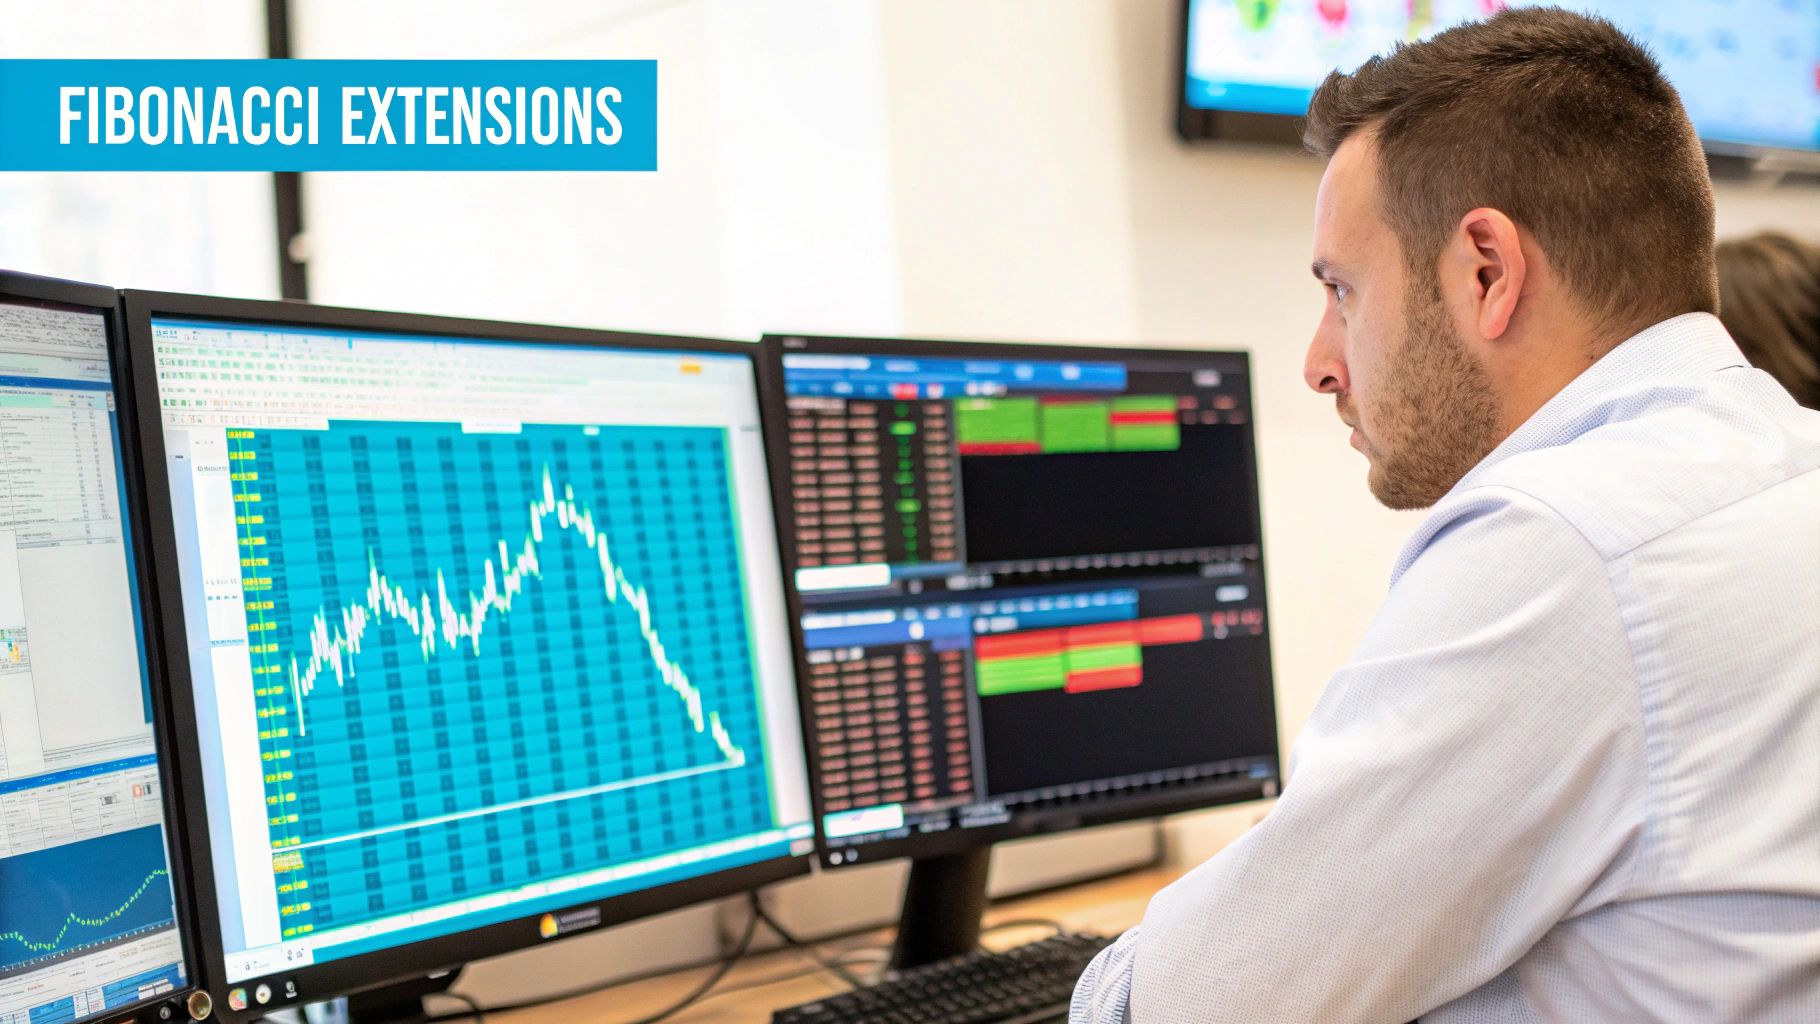
Alright, so you've got those Fibonacci lines drawn on your chart. Now what? The real art isn't just plotting the levels; it's understanding what they're telling you about the market's mood. Each Fibonacci extension level is less of a rigid rule and more of a psychological signpost, hinting at where the current trend might run out of steam.
Imagine the price is climbing a staircase. Each extension level is a landing. Some are just places to catch a quick breath before continuing up, while others are major floors where a lot of people decide they've gone high enough and head for the exit. This selling pressure can stop the climb or even send the price back down.
Remember, these levels aren't magic. They are simply high-probability zones where price is likely to react. The skill comes from blending this knowledge with other analysis to decide when and where to take your profits.
The 100% extension level is a fascinating and often critical juncture. This is the point where the current price move has traveled the exact same distance as the initial one. In a simple uptrend, it means the rally from the bottom of the pullback is equal in size to the first leg up.
Basically, it’s a one-to-one measured move. This level often acts as the first major hurdle for a trend. If the price blasts through the 100% level with conviction, it's a huge vote of confidence. It tells you the trend has serious horsepower and is probably just getting started.
The 100% extension is a benchmark for trend equality. A break beyond this point often signals that the current move is stronger than the initial one, suggesting further continuation.
On the flip side, if the price hits this level and sputters out, it might mean the initial excitement is wearing off. That makes the 100% level a perfectly logical spot for more cautious traders to lock in some early profits.
If Fibonacci extensions have a celebrity, it's the 161.8% level. This number, derived directly from the Golden Ratio, is by far the most watched and respected profit target in a trader's toolkit. When a trend is healthy and moving with purpose, the 161.8% level is often its ultimate destination.
This level carries a lot of psychological weight. Why? Because everyone from retail traders to big-money algorithms is watching it. This can create a self-fulfilling prophecy, as a cluster of take-profit orders often piles up right around this zone. All that selling pressure is often enough to stall or even reverse the trend.
It’s not just theory, either. Statistical studies on major Forex pairs and stock indexes have shown that price action frequently reacts at the 161.8% extension during strong, trending moves. You can dive deeper into how the pros use these levels with insights from TradingFibonacci.com.
To help you get a quick handle on these levels, here's a simple breakdown of what they generally signify.
This table summarizes the typical market interpretation and strategic use for the most common Fibonacci extension levels, helping traders quickly identify potential profit targets.
Think of this table as your cheat sheet. It gives you a solid starting point for building your exit strategy around these key psychological zones.
So what happens when a market is on fire and blows right past the 161.8% level like it's not even there? That's when you look to the higher Fibonacci extension levels, like 261.8% and 423.6%. These are reserved for trends with extreme momentum, usually fueled by major news, wild speculation, or a parabolic breakout.
You can think of these higher levels as "euphoria" or "panic" targets. By the time the price is knocking on the door of 261.8%, the trend is getting pretty long in the tooth and is likely overextended. While it shows incredible strength, it's also a big red flag that the move could be on its last legs.
For traders, these upper levels are the perfect place to take the last of your profits off a home-run trade. They mark the final potential destinations before a major correction or reversal becomes almost inevitable.
Theory is one thing, but the real "aha!" moment comes when you see Fibonacci extensions play out on a live chart. This is where the math meets the market. These aren't just abstract lines; traders across stocks, crypto, and forex rely on them every single day to figure out where a trend might be headed and, more importantly, where to take their profits.
So, let's leave the textbook behind and look at some practical examples. Each one tells a story of a trend, a pullback, and a projection that gave traders a clear roadmap for their exit strategy.
Watching how these levels act as price magnets in different market conditions helps build the confidence you need to use the tool effectively. It’s all about seeing how the market respects these calculated zones time and time again.
Let's picture a popular tech stock—we'll call it "Innovate Corp"—that's been stuck in a trading range for months. Out of nowhere, a stellar earnings report lights a fire under the stock, sending it rocketing from $250 up to $350. That powerful surge is our initial trend wave.
After that big run-up, some traders cash out, and the stock naturally pulls back. It drifts down to $280, finds its footing, and starts to turn around. A sharp trader would spot their three critical points right there:
By plotting the Trend-Based Fib Extension tool using these three points, several potential targets appear on the chart. The 100% extension level lands at $380, while the all-important 161.8% extension projects a target way up near $442.
Once the stock breaks past its old high of $350, it's in what traders call "price discovery"—there’s no recent history to tell us where resistance might be. This is exactly when Fibonacci extensions become a trader's best friend. In our example, the stock rallies hard, takes a quick breather around the $380 mark (the 100% level), and then continues its climb.
Ultimately, the rally runs out of steam and hits a major wall right around $442—the 161.8% "Golden Target." Traders who had set their take-profit orders at this level would have gotten out near the absolute top, just before the next big pullback started.
The crypto market, with its wild volatility, offers some of the best examples of Fibonacci extensions in action. When an asset goes parabolic, these tools are indispensable for projecting just how high it might go.
A classic example of this happened with Ethereum. During one of its historic runs, ETH ripped from around $1,700 to $2,700. After that huge impulsive move, the price corrected, finding solid support near $2,362, which also happened to be a key Fibonacci retracement level.
Once the pullback found its floor, traders could then use Fibonacci extensions to map out the next leg up. Levels like 123.6%, 138.2%, and especially the 161.8% became the new price targets. This shows how retracements and extensions work hand-in-hand to build a complete trading plan. You can see more analysis of how Fibonacci is applied to real market events by checking out articles on platforms like OANDA.com.
Fibonacci extensions are a true staple in the forex world, where currencies often trend in very clean waves. Let's look at a downtrend in the EUR/USD pair.
Imagine the pair falls from a high of 1.1000 down to a low of 1.0800. That 200-pip drop is our main downtrend. The price then bounces back in a corrective rally up to 1.0920 before it starts to look weak again and rolls over.
A forex trader would plot their three points like this:
The Fibonacci tool would project the 161.8% extension level down at 1.0600. With the downtrend back in play, traders would eye this level as a highly probable spot for the move to finally run out of gas. As EUR/USD dropped, you'd likely see the price action get slow and choppy as it neared 1.0600, signaling it was a great place to take profits on a short trade before the buyers stepped back in.
Fibonacci extension levels are powerful, but they shouldn't be used in a vacuum. A single indicator, no matter how good, is like one instrument in an orchestra—it sounds much better as part of a symphony. The real magic happens when you combine extension levels with other tools to create confluence, where multiple independent signals all point to the same conclusion.
This is how you build a robust, high-probability trading strategy. When a key Fibonacci extension level lines up with another technical signal, your confidence in that price zone as a profit target skyrockets. It’s the difference between a wild guess and a well-reasoned plan.
Think of it this way: if a Fibonacci level is a signpost pointing to a destination, confluence is like having a GPS, a local guide, and a detailed map all confirming the same route. Each extra signal validates the path, making it far less likely you'll take a wrong turn.
Weaving Fibonacci extension levels into your broader strategy means layering different types of analysis. Instead of just hoping a projected level holds, you look for confirmation from other indicators that track different aspects of market behavior, like momentum or trend strength. This builds a much stronger case for your trade.
Here are a few powerful combinations to watch for:
By seeking confluence, you graduate from simply using a tool to building a complete trading system. This disciplined approach helps filter out weak setups and focuses your energy on the trades with the highest chance of success.
This methodical layering of signals is a cornerstone of advanced trading. If you're just starting and want to build a solid foundation, you can learn more about the basics in our complete guide to Fibonacci trading for beginners.
Ultimately, using Fibonacci extensions isn't just about drawing lines on a chart; it's about making better decisions. Combine them with other tools, protect yourself with a clear stop-loss, and you'll turn a reactive tool into a proactive part of your trading arsenal.
Even after you've got the basics down, you're bound to have questions when you start putting a new trading tool to work. Let's tackle some of the most common things traders ask about Fibonacci extension levels. Think of this as a quick FAQ to build your confidence.
Getting these details right is crucial. It’s the difference between using the right tool for the right job—like knowing when to look for an entry versus when to set a profit target.
This is probably the number one question, but the difference is actually pretty straightforward. Fibonacci retracement levels help you predict where a price might pull back to within an existing trend. They’re all about finding a good spot to jump in on a dip.
Extensions, on the other hand, are used to project how far the price might run after that pullback is over. They help you look beyond the last high or low to see where the trend might be headed next.
Simply put: Retracements are for finding potential entries. Extensions are for setting potential profit targets. They're two sides of the same coin, working together to frame a trade.
If you had to pick just one, most traders would point to the 161.8% level. It’s often seen as the most significant target because it’s a direct product of the Golden Ratio, which gives it a certain weight in the market.
You'll often see powerful trends pause or even reverse right around this mark. But remember, no single level is foolproof. Always look for other signals to back up what the Fibonacci level is telling you.
Not really. Fibonacci extensions work best when a market has a clear direction—either up or down. The whole idea is to measure a trend, measure its pullback, and then project the next leg of that trend.
In a choppy, sideways market where the price is just bouncing around, the tool loses its edge. There are no clean waves to measure, so the levels it gives you won't be very reliable. The first step is always to make sure you're in a trending market before you even think about drawing your Fibs.
Ready to stop guessing and start using data-driven levels in your trading? EzAlgo provides automated Fibonacci levels, real-time buy and sell signals, and a suite of advanced indicators to give you a technical edge. Eliminate the guesswork and trade with precision by visiting EzAlgo.ai to see how our tools can improve your strategy.


%201.svg)