


Fibonacci extension levels are all about looking forward. Think of them as a trader's roadmap for figuring out where a price might go next, especially after it’s already broken past a recent high or low. They help you answer the crucial question: "How far could this run?"
These levels are plotted out based on the famous Fibonacci sequence, giving you mathematically calculated targets for taking profits or anticipating the end of a move.
Here's a simple way to think about it: Imagine you're stretching a rubber band. The initial stretch is the first price move, and the slight pullback is the retracement. Fibonacci extensions help you predict how far that rubber band will fly in the original direction once it snaps forward again. They are designed to project potential price targets into uncharted territory where no previous price action exists to guide you.
This is what makes them different from their cousins, Fibonacci retracements. Retracements measure how deep a pullback might go within an existing trend. Extensions, on the other hand, forecast how far the trend will continue beyond its previous peak or valley. This makes them incredibly valuable for setting profit targets when you're riding a strong trend.
So, why do these specific numbers seem to matter so much? It's a fascinating mix of math and market psychology. The levels are all derived from ratios found in the Fibonacci sequence, a numerical pattern that pops up everywhere from seashell spirals to galaxies.
At their core, Fibonacci extension levels are a critical tool for forecasting where a price might head after it breaks beyond a prior trend's high or low. The most common extension levels traders watch are 161.8%, 261.8%, and 423.6%.
These ratios have become something of a self-fulfilling prophecy in the markets. So many traders and automated trading systems are programmed to watch these exact levels. When a price surges toward a key extension like 161.8%, a wave of traders will start taking profits. This sudden selling pressure is often enough to stall the price or even cause a reversal, validating the level's importance. You can get a deeper dive into their application on platforms like NordFX.
This collective behavior is what gives the levels their power. By keeping these key zones on your radar, you can start making smarter decisions. Specifically, you can:
To make it even clearer, here is a quick summary of what each key level often suggests to a trader.
Ultimately, using Fibonacci extensions gives you a structured framework for anticipating what comes next. It helps shift your trading from being purely reactive to a more proactive, strategic approach by providing a clear map of potential destinations for an asset on the move.
Drawing Fibonacci extension levels might seem intimidating at first, but it boils down to a simple three-click process. Unlike retracements which only need two points, extensions require three to project where the price might be headed next. Getting this right is crucial for spotting potential profit-taking zones.
The whole idea is to find a clear trend and the pullback that follows it. Your three clicks will mark the start of the trend, the end of that trend, and the end of the pullback. Think of it as giving your charting tool a map of a recent move so it can predict the next one.
Let's start with an uptrend. Say a stock shoots up, pulls back a bit to catch its breath, and then looks ready to climb again. You want to figure out just how high it might go.
Once you make that third click, your trading software automatically draws the Fibonacci extension levels—like 161.8% and 261.8%—above the recent high. These are your potential price targets.
This image really helps visualize the simple three-step process for setting up these profit targets.
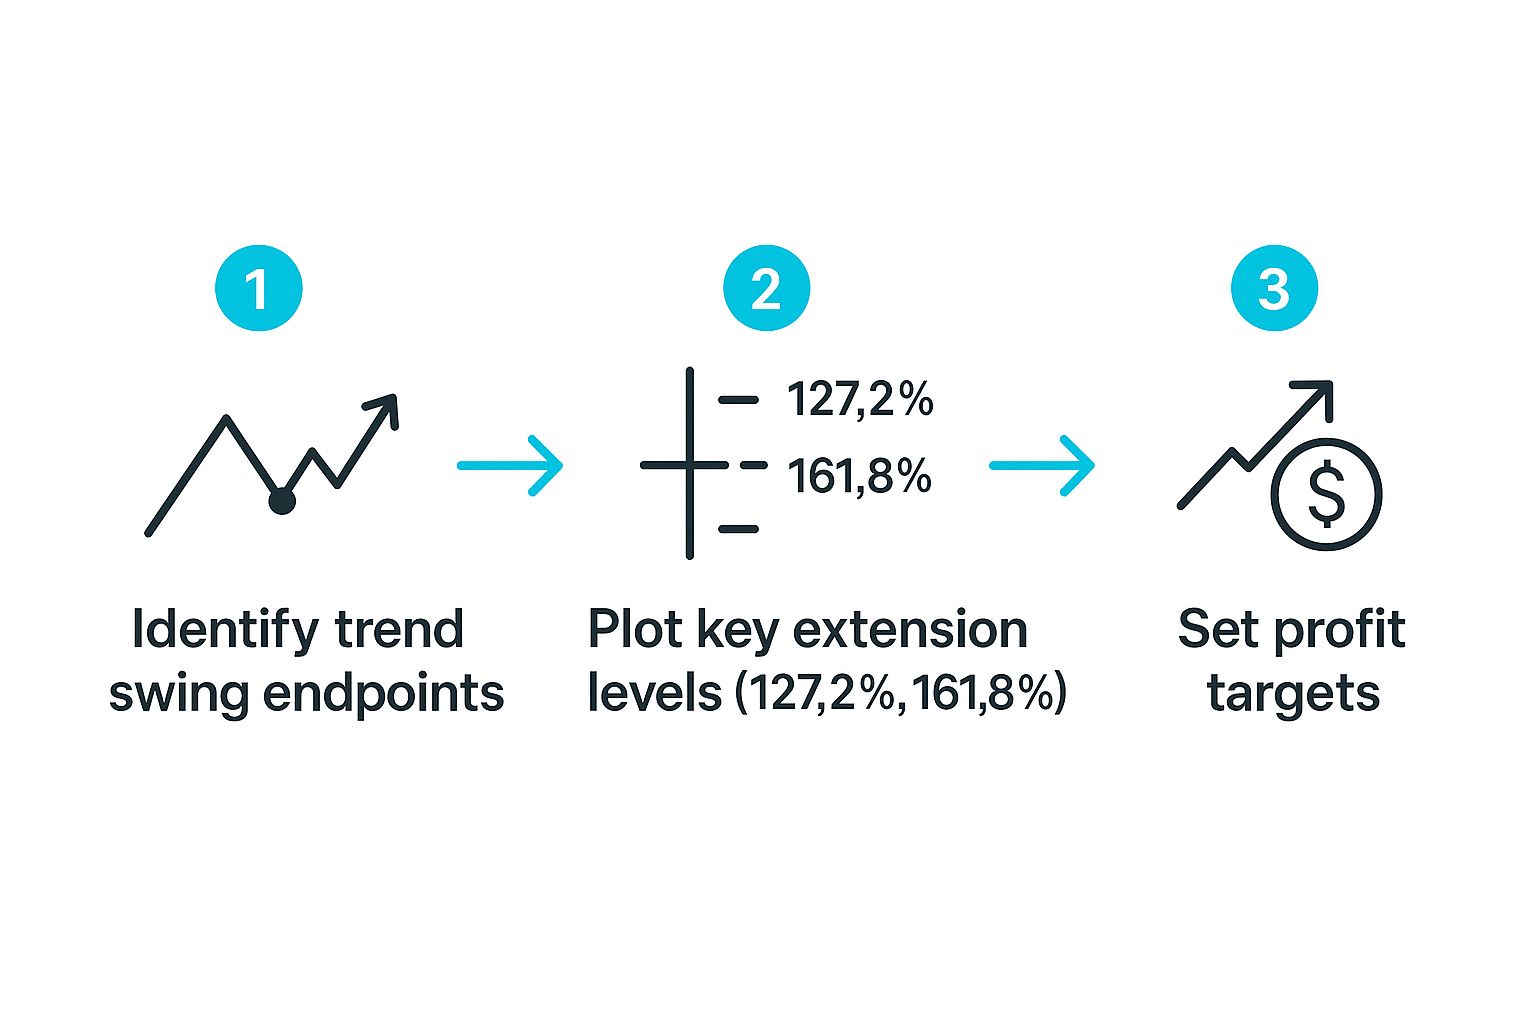
As you can see, once you’ve identified the main trend and its pullback, plotting these points gives you clear, actionable price levels to watch.
The logic for a downtrend is exactly the same, just flipped upside down. Here, you’re looking for price targets below the market as a downtrend continues its push lower.
The core principle remains identical: you anchor the tool to the start of the initial move, its end, and the subsequent retracement. This consistency is what makes the tool so reliable across different market conditions.
Here’s the step-by-step for a downtrend:
This projects the extension levels downward, showing you potential support areas or exit points for a short trade. While this guide is all about extensions, understanding their counterpart is just as important. For the full picture, you should also learn how to draw Fibonacci retracements.
The real secret to accuracy is picking significant swing points. Don't get caught up in the minor wiggles and noise. Focus on the clear, decisive moves the market has made to ensure your Fibonacci levels are meaningful.
Once you’ve drawn your Fibonacci extension levels on a chart, they start to paint a picture of the market’s momentum and psychology. These aren't just random lines; they’re potential destinations where a price trend might hit a wall, turn around, or simply run out of gas.
Think of them as signposts on a highway. They show you the likely exits where traffic—in this case, trading activity—might get heavy.
Instead of treating them as concrete walls, it’s much more practical to see them as zones of probability. As the price gets closer to a key extension level, the odds of a reaction go up. This happens because tons of other traders and automated bots are watching the exact same levels, which creates a sort of self-fulfilling prophecy. All that coordinated profit-taking or new buying/selling is what actually moves the price.
You can plot a lot of different extension ratios, but a few really stand out in everyday trading. Each one tells you something different about the strength of a trend and gives you a hint about where the market could be headed next.
The 138.2% Level: This is usually the first major target traders look for after the price breaks past its old high or low. It’s a conservative, but realistic, goal. It suggests the trend has enough juice to keep going but might not be an explosive move. A lot of traders will take some profit off the table here or slide their stop-loss up to their entry point.
The 161.8% "Golden Extension" Level: This is the big one. Arguably the most important and widely respected of all the Fibonacci extensions, the 161.8% level is a massive psychological and algorithmic target. When the price hits this zone, it often means the move has reached its expected limit for a standard trend, making it a prime spot to cash out completely.
The 261.8% and 423.6% Levels: These are your long-shot targets. They only come into play during incredibly strong, almost parabolic trends. Hitting the 261.8% level signals some serious momentum, the kind you might see in a crypto bull run or a breakout stock that just won’t quit. The 423.6% level is even more extreme and can sometimes mark a "blow-off top," where a trend is about to burn out spectacularly.
So, why do these levels even work? It all comes down to collective human behavior. Statistically, Fibonacci extension levels have a strong correlation with real-world market patterns during strong trends.
In bull markets, it's common to see prices push past old highs only to find resistance near the 138.2% or 161.8% levels. The 161.8% "golden extension" is so popular that an estimated 70% of technical traders use it as a primary profit target when the market is trending. In more volatile situations, like a sharp rally in tech stocks, traders might even start looking toward the 200% or 261.8% levels for where the move could end. You can find more on this in a detailed analysis of Fibonacci in trading.
Essentially, these levels act as focal points. When a huge number of traders all agree—consciously or not—that a certain price is a good place to sell, their combined actions create the very resistance they were all expecting.
By learning to read these signals, you stop just reacting to what the price is doing and start anticipating its next move. You get a much clearer map of where the market might turn, which helps you make smarter decisions about when to lock in profits, manage your risk, or let a winner run just a little bit longer.
It's one thing to talk about Fibonacci levels in theory, but it's another thing entirely to see them work on a live chart. Let's get practical and look at how these levels show up in the real world. You'll find these patterns again and again, not by magic, but because countless traders and algorithms are all watching the same lines.
When price action stops on a dime at the 161.8% extension, you’re not just seeing a coincidence. You're watching a massive, self-fulfilling prophecy play out as big banks and trading bots automatically take profits right at that spot.
The crypto market is famous for its wild swings and powerful trends, which makes it a perfect place to see Fibonacci extensions in action. Let's look at the huge Bitcoin bull run from 2020 to 2021.
If you drew the extension tool from the COVID-19 crash low in March 2020 up to the 2021 peak, and then back down to the next major low, you could have projected some interesting targets. Incredibly, the 161.8% extension level nearly nailed the top of Bitcoin's next major rally in 2024. It pinpointed the exact area where the momentum finally gave out and a major reversal kicked in. That's a powerful example of these levels forecasting huge turning points years in advance.
This isn't just a crypto phenomenon. The same idea works just as well in traditional markets like the S&P 500. Time and again, the 161.8% extension has stepped in to act as a solid support level after a quick dip in a bigger uptrend.
For an automated trading system, that level is a green light—a high-probability zone where the trend is likely to kick back into gear. For a human trader, it’s a smart place to think about getting into a trade or setting a stop-loss to protect an existing one.
The fact that different markets all seem to "respect" Fibonacci extension levels shows just how baked into the system they are. They've become a shared roadmap for both human emotion and automated trading strategies.
Many of the algorithms used by big financial institutions have levels like 138.2%, 161.8%, and 261.8% hard-coded into their logic for placing massive orders. This is why they're so important; their widespread use makes them a critical tool for any serious trader. If you want to dive deeper, you can explore how these are applied in modern market analysis from OANDA.
Once you start seeing these patterns play out for yourself on a chart, their value becomes obvious. It helps you move from just watching the market to actually anticipating where it might go next—and that’s what successful trading is all about.
While Fibonacci extension levels give you a fantastic map of where the price could go, trading them in isolation is a bit like driving with only one headlight on a foggy night. You can see, but you can’t see everything.
To really light up the road ahead and trade with confidence, you need to combine them with other technical analysis tools. This is where the powerful concept of confluence comes into play.
In trading, confluence is simply when two or more independent signals point to the same conclusion. Think about a major extension level like the 161.8% target lining up perfectly with a strong resistance zone from a few weeks ago. Suddenly, you have multiple reasons to believe the price will react there.
This overlap transforms a simple price level into a high-probability zone. By cross-referencing your signals, you filter out a ton of market noise and build a much stronger case for taking a trade.
The best way to put this into practice is to create a mental checklist. Before you set a profit target at a Fibonacci extension, ask yourself: what else is happening at this price? Look for at least one or two other signals that confirm your analysis.
Here are a few powerful combinations traders often look for:
When multiple technical signals converge on a single price area, it acts like a magnet for trading activity. This intersection is the core of what makes a high-probability setup.
Putting confluence into practice helps you find trade setups with much higher odds of success. The following table breaks down a few ways you can pair extensions with other common tools.
Think of each confirmation as another reason to trust your analysis.
Learning to stack these signals is a foundational skill for any serious trader. If you want to dive deeper, check out our complete guide to using confluence in trading. The goal is to build such a strong case for your trade that taking it becomes a logical, confident decision—not just a hopeful guess.
Fibonacci extensions can be a trader's best friend for mapping out potential price targets, but like any tool in the toolbox, they're only as good as the person using them. Knowing the common pitfalls is the first step to making them work for you, not against you.
One of the easiest ways to get tripped up is by choosing the wrong swing points. If you're drawing your levels based on minor, insignificant wiggles instead of a clear, major swing in the market, your projections will be totally off. The tool's accuracy hinges on correctly identifying the real beginning and end of a trend, plus its main pullback.
Another classic mistake is trying to use extensions when the market just isn't cooperating.
Fibonacci extensions are built for trends. They need a clear uptrend or a solid downtrend to project where that momentum might carry the price next. When a market is just chopping around sideways with no real direction, these levels become nothing more than random noise. Applying them in a range-bound market is a surefire way to get hit with false signals and frustrating losses.
The rule of thumb is simple: if you have to squint to find the trend, it’s not the right time for an extension tool. Just wait for the market to show its hand.
This is probably the biggest mistake of all: seeing Fibonacci extension levels as concrete promises. They're not walls that will magically stop the price. Think of them as zones of probability—areas where a reaction is likely, but never guaranteed. Price can blow right through a level like it's not even there, or it might turn around well before it reaches it.
Always remember that these levels are just one part of your analysis. Relying on them alone without looking for confirmation from other indicators or price patterns is a recipe for disaster. Use them to build your case for a trade, not as a standalone magic bullet.
Even after you get the hang of a new trading tool, some questions always seem to surface once you start using it for real. Let's tackle some of the most common ones that come up with Fibonacci extensions.
It all comes down to direction. Think of it this way: Fibonacci retracements look backward. They help you measure how far a price might pull back inside an established trend, flagging potential support or resistance areas for an entry.
On the other hand, Fibonacci extension levels are all about looking forward. They project where the price could go after that pullback is over, giving you logical spots to think about taking profits. They answer the question, "Where is this trend headed next?"
Absolutely. You'll see traders using them everywhere, and for a good reason. The tool isn't based on a specific asset's fundamentals but on the collective psychology of traders, which tends to be pretty consistent across the board.
You can apply them effectively in:
A big part of why they work is because so many traders and automated systems are watching the exact same levels. This creates a sort of self-fulfilling prophecy when price approaches them.
First off, remember that these are areas of probability, not concrete walls. If you see the price slice right through a major level like 161.8% with a lot of volume and momentum, don't panic. That’s actually a huge clue.
It’s telling you that the trend you're in is much stronger than you might have thought.
A classic trading principle is that old resistance becomes new support. When a key level is broken, traders will often watch for the price to come back and test it from the other side. This "retest" confirms the trend's power.
So, a broken level isn't a failure of the tool; it's fresh intel. It means the market's conviction is high, and the next level up (like 261.8%) is probably the new target. As always, let the price action be your ultimate guide.
Stop guessing and start mapping your trades with precision. EzAlgo automatically generates key Fibonacci levels, including the golden pocket, directly on your TradingView charts to give you a clear technical advantage. Find your edge today at EzAlgo.


%201.svg)