


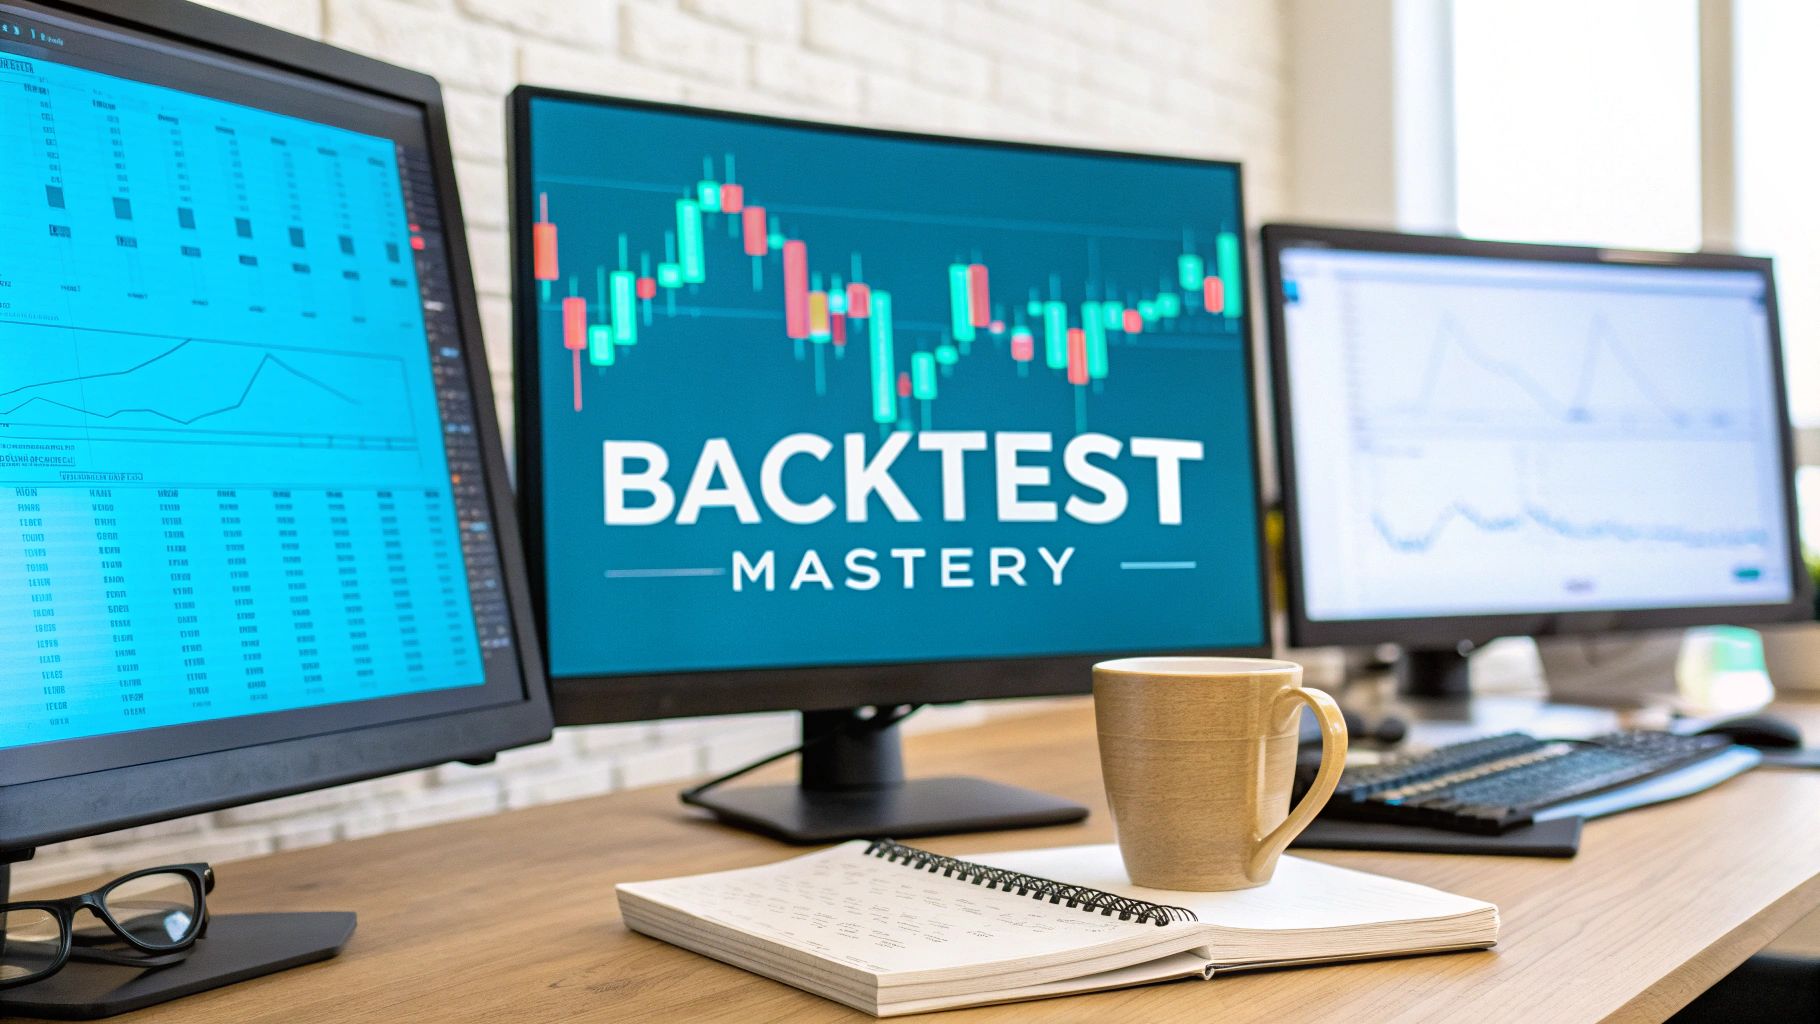
Backtesting is simply the process of taking a trading idea and seeing how it would have performed using old market data. It’s a crucial stress test for your logic—a dry run you perform before putting any real money on the line. This data-first approach is what separates a potentially winning strategy from a costly mistake.
We've all been there. You get a brilliant trading idea and you're absolutely certain it's a winner. The temptation to dive straight into the live market, fueled by that gut feeling, is huge. But honestly, that's where most traders trip up. A solid backtesting process acts as your first line of defense against those emotional decisions and any hidden flaws in your logic.
Think of it like a flight simulator for your trading concepts. A pilot would never fly a new jet without logging hundreds of hours in a simulator to learn how it handles in all sorts of conditions. Backtesting is the exact same thing for your strategy, revealing its potential strengths and weaknesses without risking a single dollar.
It’s really important to get one thing straight: backtesting doesn't predict the future. What it does do is validate whether your strategy had a statistical edge in the past. If a strategy performed terribly over the last five years of data, it's highly unlikely it will magically start printing money tomorrow.
A good backtest gives you evidence-based confidence in a strategy’s potential before you ever place a trade. By applying your rules to historical data, you can see hypothetical profits, analyze risk metrics like maximum drawdown, and get a feel for its overall performance. This is a core practice for any serious trader developing a new system.
Backtesting really boils down to asking one simple question: "If I had followed these exact rules for the past few years, would I have made money?" The answer, found in the data, is often surprising and always incredibly insightful.
Let's say a trader comes up with a classic "golden cross" strategy: buy a stock whenever its 50-day moving average crosses above the 200-day moving average. It sounds logical, right? It feels like a solid plan.
But by running a backtest on the S&P 500 over the last decade, they might uncover a critical detail. While the strategy was profitable overall, it also suffered a 40% maximum drawdown at one point. That's a peak-to-trough decline that would have erased nearly half their capital.
That single insight is invaluable. It doesn’t mean the strategy is worthless, but it shines a huge spotlight on a major risk. Knowing this allows you to go back and refine your approach, maybe by incorporating smarter risk management for traders.
This TradingView chart gives a great visual of what a simple backtest looks like when applied to a stock's historical price.
The performance summary below the chart instantly shows you key stats like net profit and max drawdown, giving you a quick, data-driven gut check on the strategy's potential.
Your backtest is only ever as reliable as the data you feed it. Think of it like this: you wouldn't build a house on a shaky foundation, right? The same logic applies here. If your historical data is flawed, incomplete, or just plain wrong, the results you get will be completely misleading.
It’s a classic case of "garbage in, garbage out." You could have what looks like a world-beating strategy, but if it was tested on data with missing price bars or incorrect volume, your backtest is pure fiction. Getting your data right isn't just a preliminary step; it's the most critical part of the entire process.
This is why experienced traders obsess over data quality—it's the bedrock of any sound trading model.
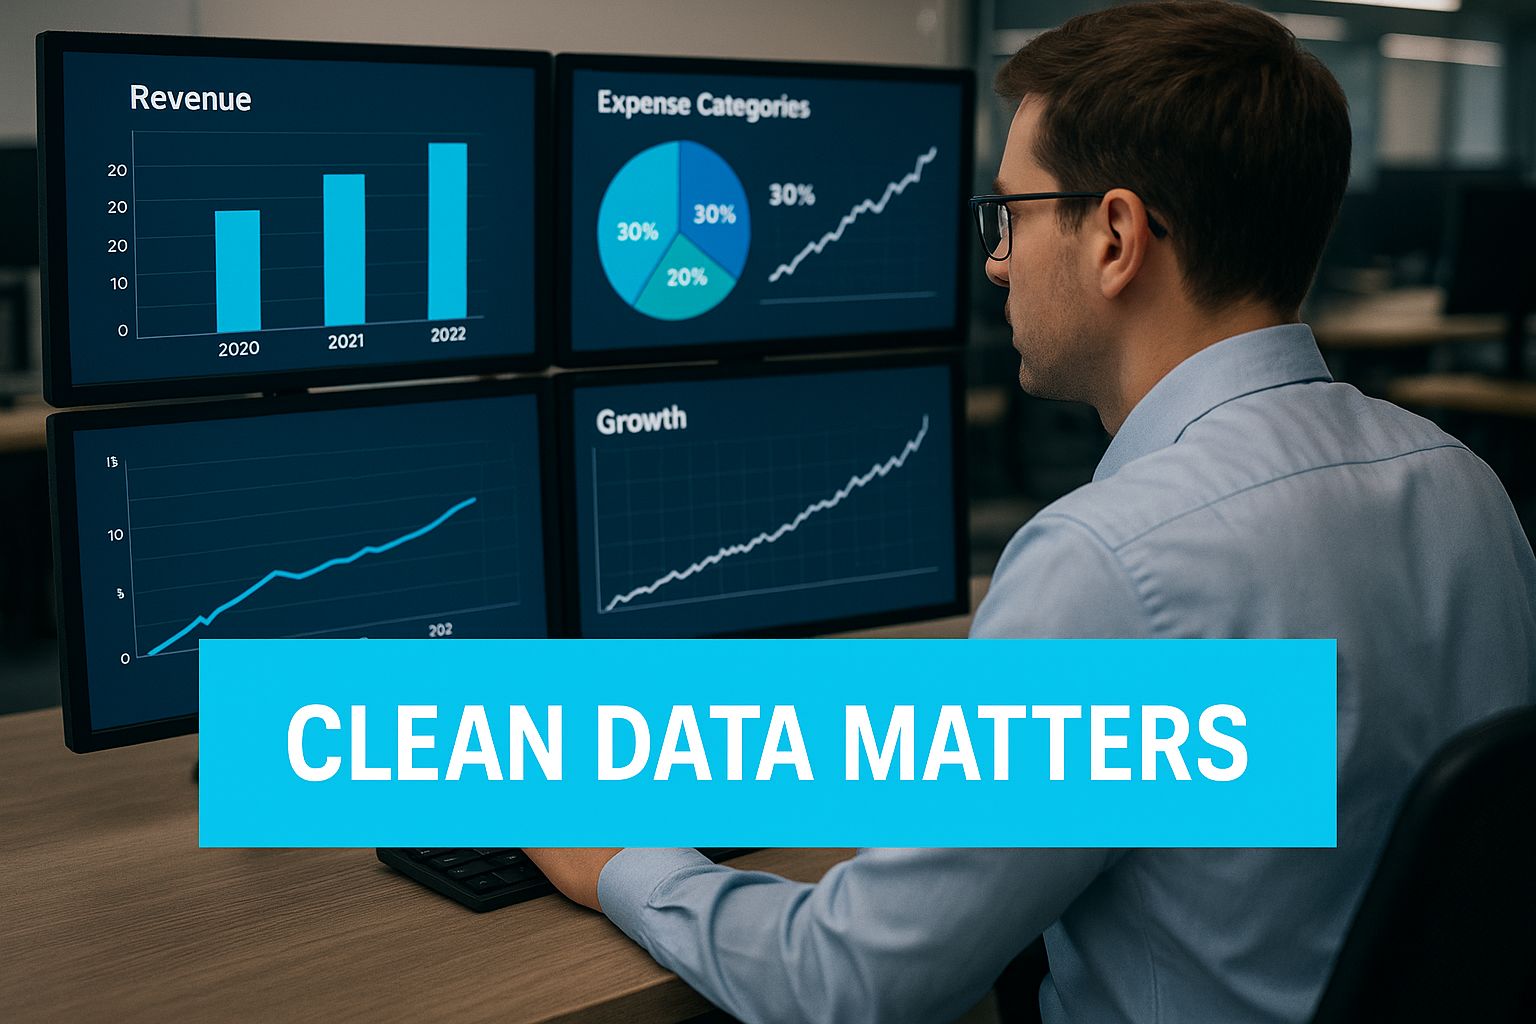
As you can see, clean data is what separates a reliable backtest from a worthless one. It’s what prevents you from drawing flawed conclusions and trading a bad strategy with real money.
Not all data is created equal, and what works for a long-term investor is useless for a scalper. The key is to match the data granularity—the timeframe of each data point—to how you actually trade. Using the wrong type is like trying to navigate a city with a map of the world; you simply don't have the detail you need.
Here’s a quick breakdown to help you pick the right tool for the job.
Ultimately, trying to backtest a five-minute scalping strategy on daily data is an exercise in futility. All the intraday price action your strategy relies on would be completely invisible, making your test results meaningless.
So, where do you get this data? For most of us, platforms like TradingView or the data feeds from our brokers are more than enough. But it's worth knowing that professional quant funds take this to another level entirely. They often purchase massive, terabyte-sized datasets of tick data directly from exchanges. Why? To eliminate every possible assumption and model things like slippage and order execution with brutal accuracy.
There's a hidden pitfall you need to be aware of, regardless of where you get your data: survivor bias.
Survivor bias is a sneaky trap where your dataset only includes the "winners." For example, if you backtest a strategy on the current list of S&P 500 stocks over the last 20 years, you're ignoring all the companies that went bankrupt or were delisted. This makes your results look far better than they would have been in reality.
Always be skeptical of your data. Check for gaps, question its accuracy, and understand where it came from. A little bit of due diligence now will save you from a world of pain later.
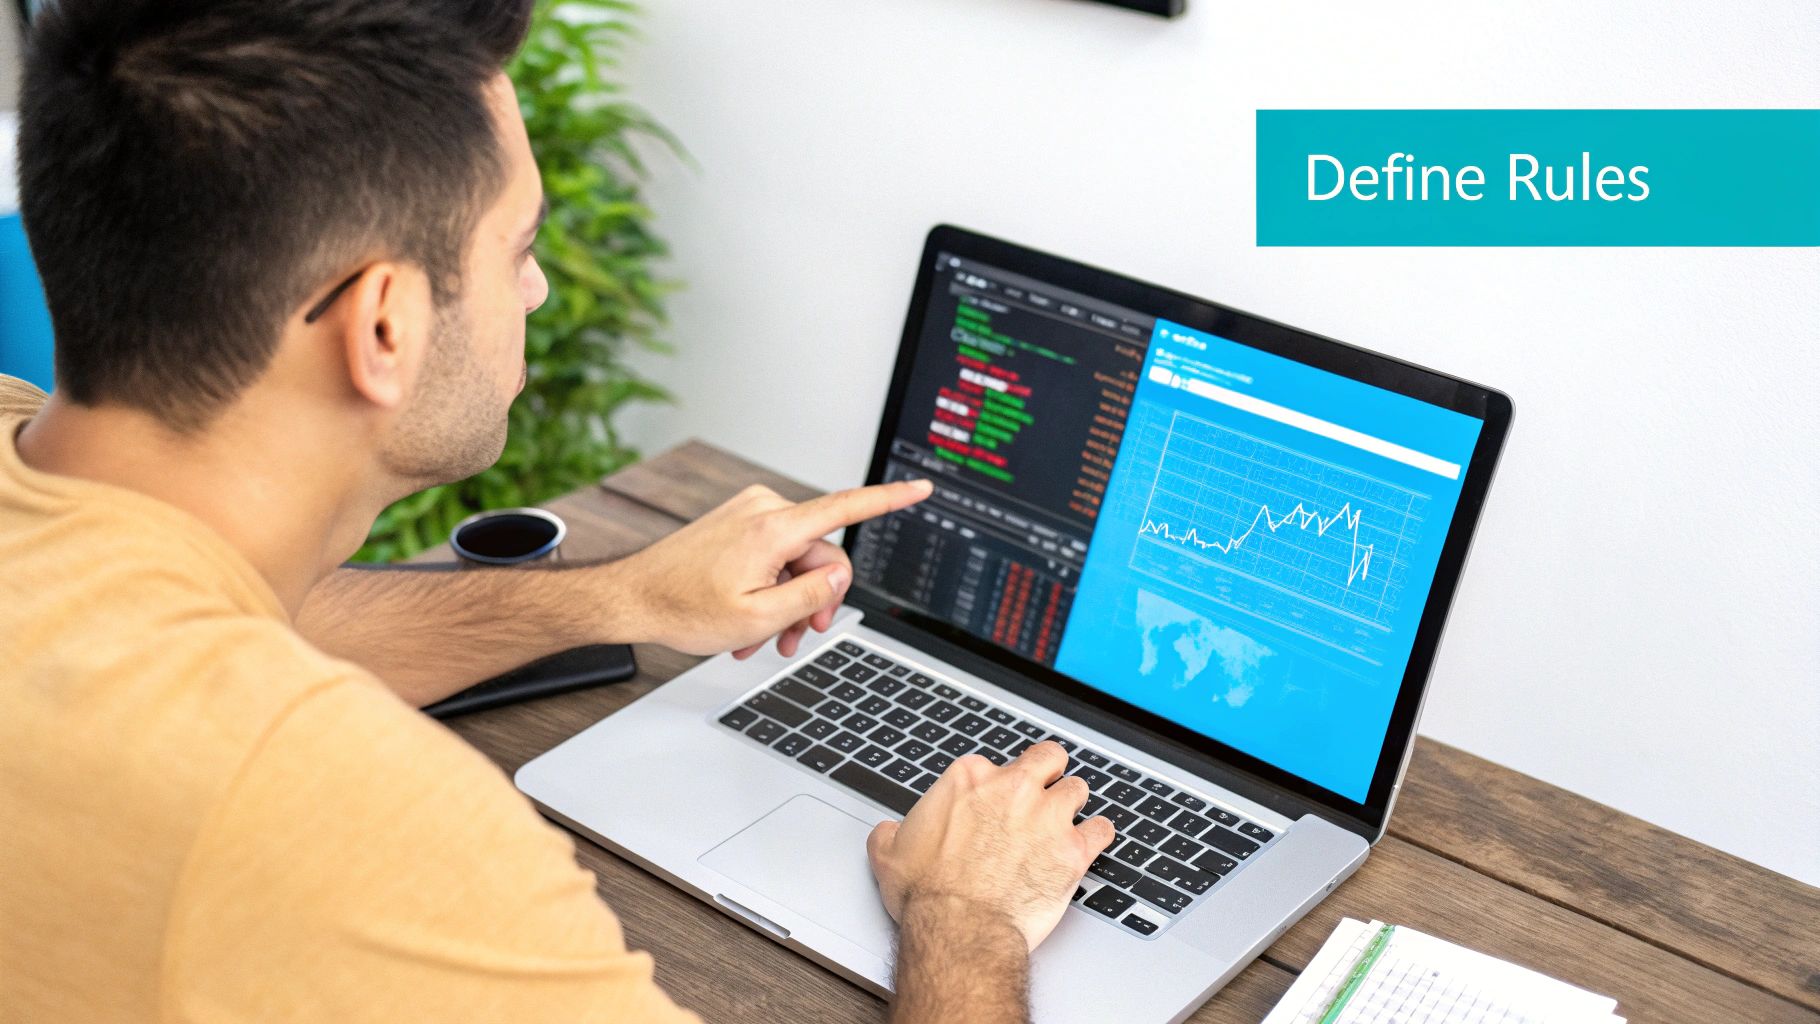
Alright, enough with the theory. It's time to roll up our sleeves and actually build a backtest. We’ll be using TradingView, which is my go-to for a reason—it’s powerful but doesn't require a computer science degree to get started.
The whole point here is to create a test environment that mimics reality. That means we have to account for the annoying little things like trading costs and set up our parameters in a way that makes sense. If you run a test that's too perfect, you'll get fantastic-looking results that fall apart the second you try them with real money.
Most of us start this journey with an indicator we like. For example, our EzAlgo indicator points out potential buy and sell signals on the chart. But to backtest it, you need to tell TradingView what to do with those signals. That's where a "strategy" script comes in.
A strategy takes the logic from an indicator and turns it into concrete actions, like "enter a long position here" or "close the trade now." It’s the brain that executes the hypothetical trades.
The good news? You don't have to code this yourself if you don't want to. Many premium indicators, including ours, come with a ready-made strategy script. You just add it to your chart, and you're ready to start tweaking the settings. It’s the fastest way to get your first test up and running.
For a more detailed walkthrough on this, you can check out our complete guide on how to backtest on TradingView.
Once the strategy is loaded onto your chart, you’ll see the "Strategy Tester" tab at the bottom of the screen light up. This is where the magic happens. But before you get trigger-happy and run the test, you have to adjust the properties to reflect real-world trading. This is non-negotiable if you want results you can actually trust.
Find the little settings gear icon inside the Strategy Tester tab. Here’s what you need to dial in:
A backtest without commission and slippage is just a fantasy. It ignores the unavoidable costs of trading and will always overstate your true performance. Always factor in these costs to keep your expectations grounded in reality.
By taking a few minutes to set these parameters correctly, you're building a simulation that actually means something. The performance numbers it spits out will give you a much clearer picture of your strategy's true potential, warts and all.
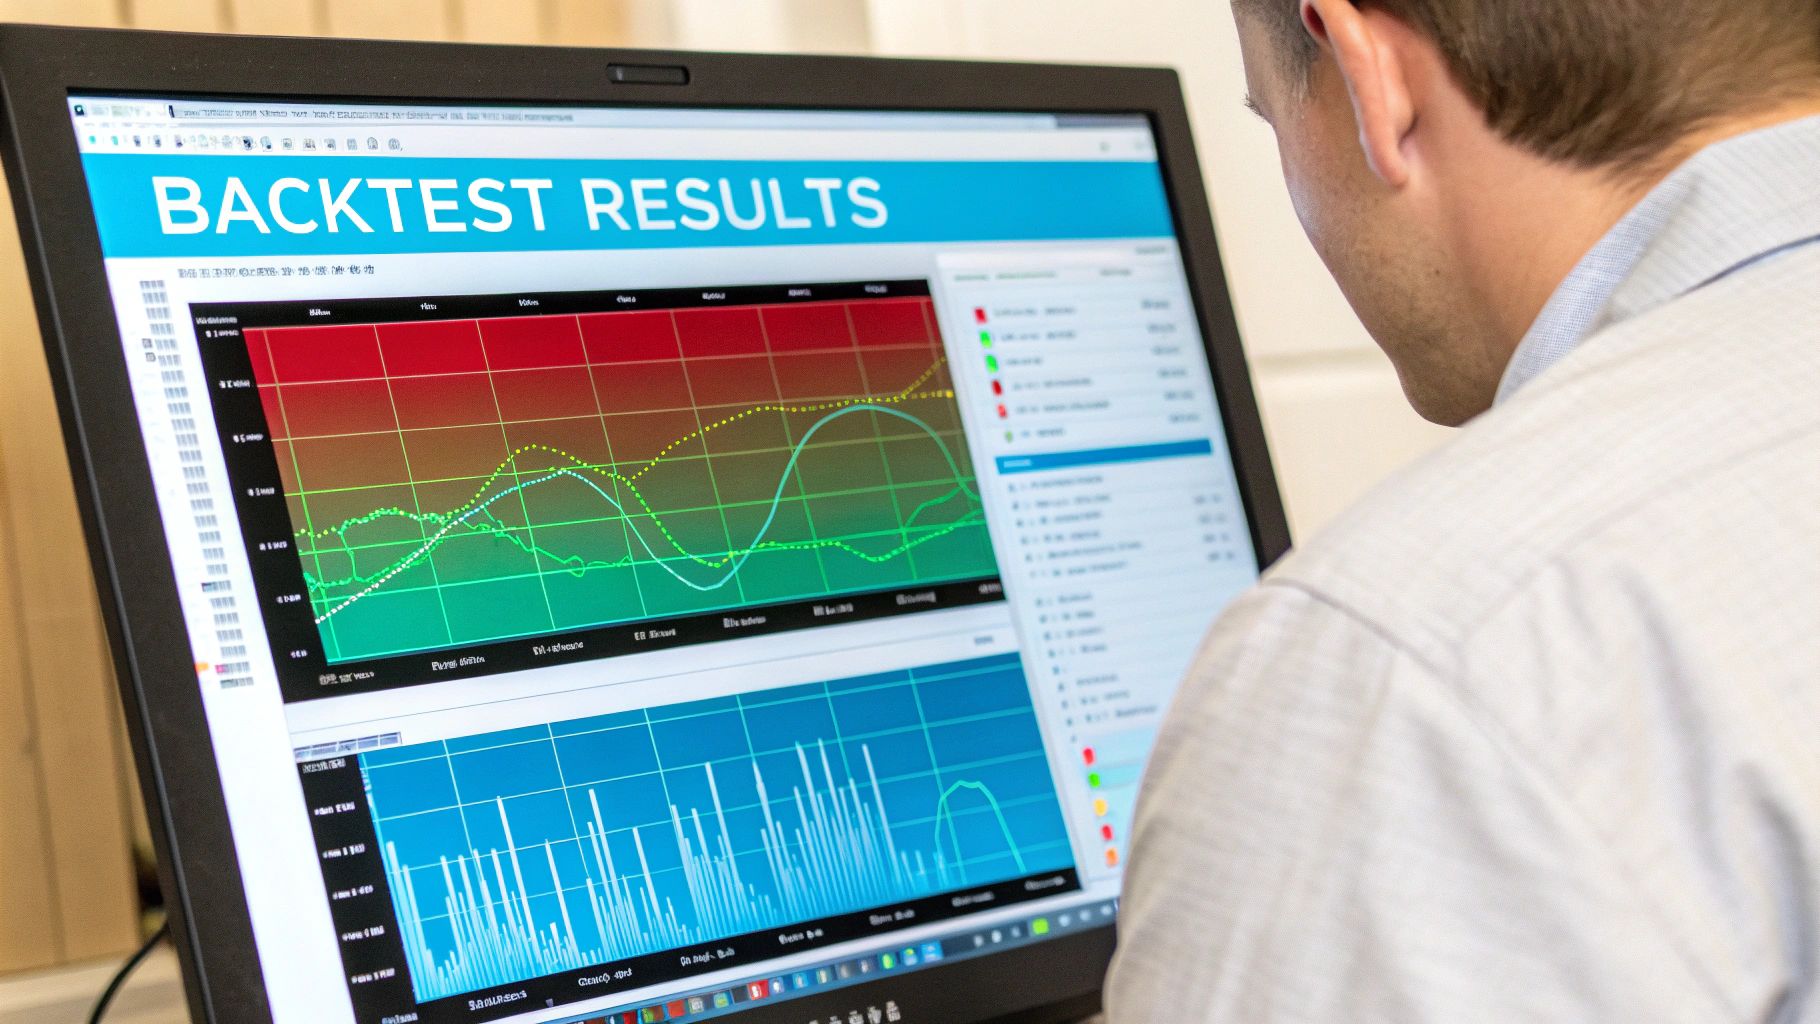
Running the backtest is the easy part. The real work—and where you actually forge a trading edge—starts when you start digging into the results. It's so tempting to just glance at the Net Profit and call it a day. But that one number tells you almost nothing about the strategy's personality, its risks, or whether you could psychologically survive trading it with real money.
Think of it like this: a car's top speed is just one number on a spec sheet. You also need to know its 0-60 time, braking distance, and how it handles on a wet road. A high-profit backtest is completely useless if it comes with a 70% maximum drawdown that would have emotionally crushed you and blown up your account in the real world. A deep dive is non-negotiable.
When you pop open the performance summary in TradingView's Strategy Tester, your eyes will naturally shoot to the net profit. Force yourself to ignore it for a minute. Instead, focus on the metrics that reveal the true character of your backtesting trading strategy. These numbers tell you about the journey, not just the destination.
Profit Factor: This is simply your gross profit divided by your gross loss. A profit factor of 2.0 means for every dollar you lost, you made two. Anything above 1.5 is pretty solid, and if you're seeing something over 2.0, you might be onto something special.
Percent Profitable: This is just your win rate. While a high number feels great, it can be dangerously misleading. I’ve seen strategies with a 90% win rate that still lose money because those few losing trades are absolute disasters. On the flip side, some of the best trend-following systems have win rates under 40% but are wildly profitable because the winners are home runs.
Total Closed Trades: This number gives you crucial context. A strategy that shows a massive profit over ten years but only took 15 trades isn't statistically significant—it's just lucky. You need a big enough sample size, ideally well over 100 trades, to have any real confidence in the numbers you're seeing.
To help you get started, this table breaks down the most important metrics you'll find in a standard backtest report. Think of it as your cheat sheet for understanding what the numbers are really telling you about your strategy's behavior.
Looking at these metrics together gives you a much clearer picture than staring at the net profit alone.
Out of all the data points, Max Drawdown is, in my opinion, the most critical number on the page. This metric shows you the absolute worst-case scenario your strategy went through during the tested period. It’s a raw measure of financial and emotional pain.
If your backtest spits out a 50% drawdown, you have to ask yourself a tough question: could you honestly stick with the plan after watching half of your trading capital vanish? Be real with yourself.
Your ability to execute a strategy live is directly tied to your tolerance for its drawdown. If the historical drawdown makes you nervous, you will abandon the strategy at the worst possible time—right at the bottom of a losing streak.
Understanding your potential drawdown prepares you for the losing streaks that are an inevitable part of trading. It sets realistic expectations and helps you build the mental toughness needed to trade a system through both the good times and the bad. Without that insight, you're just flying blind, waiting for a storm you never saw coming.
A great-looking backtest can feel amazing, but it can also be dangerously misleading. You see that beautiful upward-sloping equity curve and the rush hits. Before you get too excited, it’s time for a crucial reality check. A few hidden traps can completely invalidate your results, turning a "can't-miss" strategy into a guaranteed money-loser in the real world.
These pitfalls give you a false sense of security, tricking you into trading a broken system. The two biggest culprits every single trader needs to learn how to spot are overfitting and lookahead bias. Getting a handle on these isn't optional; it's essential for building a strategy that actually works.
Overfitting is, without a doubt, the most common mistake I see. It’s what happens when you fine-tune your strategy’s parameters over and over until they perfectly match the historical data you're testing on. You keep nudging those moving average lengths, tweaking RSI levels, and adjusting stop-loss values until the performance report looks absolutely flawless.
Here's the problem: you haven't built a robust trading strategy. You've built a fragile, one-trick pony that only knows how to perform on that specific set of historical data. It has essentially memorized the past, noise and all, instead of learning a genuine, repeatable market pattern. The moment you deploy this "perfect" strategy in a live market, it shatters under slightly different conditions.
An over-optimized strategy is like a student who memorizes the answers to an old exam. They can ace that specific test, but they will fail spectacularly when given a new one with different questions. The goal is to learn the subject, not just the answers.
Lookahead bias is a sneakier, but just as destructive, error. This happens when your backtesting simulation accidentally uses information that wouldn't have been available at the moment a trade was made. It's like letting your strategy peek at the future.
This can happen in a couple of ways:
This bias creates impossibly good results because your strategy is effectively trading with a crystal ball.
So, how do you protect yourself from these traps, particularly overfitting? A more advanced and powerful technique is walk-forward testing. Instead of optimizing your strategy across a massive ten-year dataset all at once, you break that data into smaller chunks.
The whole point of backtesting is to see what might happen in the future, but its effectiveness is held back by the risk of overfitting. Markets change. A strategy tuned to perfection on past data is likely to fail when those dynamics shift. Walk-forward testing helps solve this by splitting your data into "in-sample" periods for optimization and "out-of-sample" periods for validation.
This moving-window approach provides a much more realistic simulation of live trading and is quickly becoming the standard for professional quants. For a much deeper look into this method, you can learn more about backtesting with QuantInsti.
This process forces your strategy to constantly adapt to new, unseen data—just as it would have to in a live market. It’s a fantastic way to build confidence that your strategy has a real edge, not just a curve-fitted one.
Even with a killer backtest report in hand, it's natural to have a few nagging questions. It happens to every trader. Let's tackle some of the most common ones I hear, clearing up that last bit of uncertainty before you even think about putting real money on the line.
Think of this as your final pre-flight check. Answering these questions ensures you've covered all your bases and aren't about to fly blind into a live market.
This is a big one, and the answer isn't the same for everyone. It really boils down to your trading style.
I wish it were that simple, but no. A fantastic backtest is not a guarantee of future profits. The market is always changing, and what worked perfectly last year might not work next year.
But here’s the crucial part: a solid backtest gives you a statistical edge. It proves your logic was sound and profitable in the past, which is a massive confidence booster. It's the difference between gambling on a gut feeling and executing a plan backed by historical data.
A positive backtest doesn't promise future profits, but a negative backtest is a huge red flag. It’s your system screaming, "Don't trade me with real money!" It's an invaluable tool for weeding out flawed ideas before they cost you.
Technically, anything over 1.0 means you made more than you lost. But we're not aiming to just break even.
A profit factor in the 1.5 to 2.0 range is what I'd consider healthy and robust. If you're seeing numbers above 2.0, that's exceptional. A word of caution, though: be skeptical of ridiculously high numbers like 4.0 or more, especially with few trades. That can be a sign of overfitting, where the strategy is too perfectly tuned to past data and will likely fail in live conditions.
Slow down! The absolute last thing you should do is throw your entire account at it. The next critical step is forward testing, which most people call paper trading.
This is where you run your strategy in real-time, on the live market, but with fake money. It’s the final dress rehearsal. It lets you see if the strategy performs as you expect with live price action and helps you get a feel for executing it before your hard-earned capital is at risk.
Ready to stop guessing and start testing? EzAlgo gives you a complete toolkit of premium indicators and ready-to-go strategies for TradingView that you can backtest immediately. Get the data-driven edge you need to trade with confidence. Visit EzAlgo to get started.


%201.svg)