


Supply and demand trading is all about finding specific price areas on a chart where the market made a very strong, decisive move. Think of these zones as the footprints left behind by big institutional players. When they buy or sell in massive quantities, they create an imbalance that sends the price rocketing up or plummeting down.
Our job as traders is to spot these footprints. Why? Because they offer some of the highest-probability entry and exit points you can find. Unlike a simple support or resistance line, these are entire zones where the battle between buyers and sellers was completely one-sided.

Let's ditch the confusing lingo and think about it like this. Picture a popular sneaker drop. When a limited-edition pair is released, everyone rushes to buy. This overwhelming buying pressure sends the resale price through the roof. That initial rush of buying creates a "demand zone."
Now, imagine the opposite. A brand produces way too many of a certain model, and shelves are overflowing. To get rid of the excess stock, they have to slash prices. This flood of inventory creates a "supply zone," where intense selling pressure forces prices down. The financial markets are no different—it's just a constant tug-of-war between buyers and sellers.
At their core, supply and demand zones are the breadcrumbs left by major financial institutions like banks and hedge funds. When they execute enormous orders, they can't do it all at once without spooking the market. So, their orders get filled in chunks, leaving behind a clear zone on the chart where the price made an explosive move.
A supply or demand zone isn't just a random price level; it's a historical battleground where one side decisively won. These zones show where unfilled institutional orders may still be waiting, ready to influence price when it returns.
This is the secret sauce. It’s why prices often reverse with incredible accuracy when they re-enter these zones. As retail traders, we're essentially piggybacking on the "smart money," using their institutional footprints to predict where the price might turn next. In the forex market, where daily trading volume tops $7.5 trillion, these institutional moves create incredibly powerful zones.
So, what’s the real difference between a supply zone and a demand zone? A demand zone is where a wave of buying completely wiped out any selling pressure, causing the price to shoot up. On the flip side, a supply zone is where sellers took total control, causing the price to crash. Getting this distinction right is the first, most crucial step.
For a quick reference, here’s a simple table breaking it down.
Ultimately, a demand zone is a floor where buyers are likely waiting, and a supply zone is a ceiling where sellers are probably lurking. For a more detailed look, our guide on distinguishing a supply zone from a demand zone goes into much greater detail.
Learning to identify these zones correctly is a game-changer. It shifts your focus away from lagging indicators and helps you build a strategy based on the market's raw structure—the very engine of price movement.
Let's be honest, staring at a chart can feel like trying to find a needle in a haystack. You see dozens of potential zones, but which ones actually matter? The truth is, only a handful have enough institutional muscle behind them to really move the market. The trick is learning to spot those powerhouse zones and ignore the rest of the noise.
So, what's the secret? It all comes down to one thing: explosive price action. A real supply or demand zone isn't formed by a slow, meandering price drift. It’s born from a sudden, sharp, and decisive move away from a tight price range. Think of it less like a casual walk and more like a full-on sprint that leaves no doubt about who's in charge—the buyers or the sellers.
Imagine a coiled spring. The price gets squeezed into a tight consolidation, building up tension as big players place their orders. When that spring finally releases, the price shoots away with incredible force. That little area where the price was coiled up? That's your high-probability zone. It’s the origin point of a massive market imbalance.
To confidently pick these zones out, you need to train your eye to look for a few key clues on the chart. The single most important signal is the strength of the move away from the zone. If you see weak, choppy candles leaving an area, it's a red flag. It suggests the big institutions lack conviction, making the zone unreliable for a future trade.
Here's a quick mental checklist you can run through to see if a potential zone has what it takes:
This image really helps break down the process of finding and confirming these powerful trading zones.
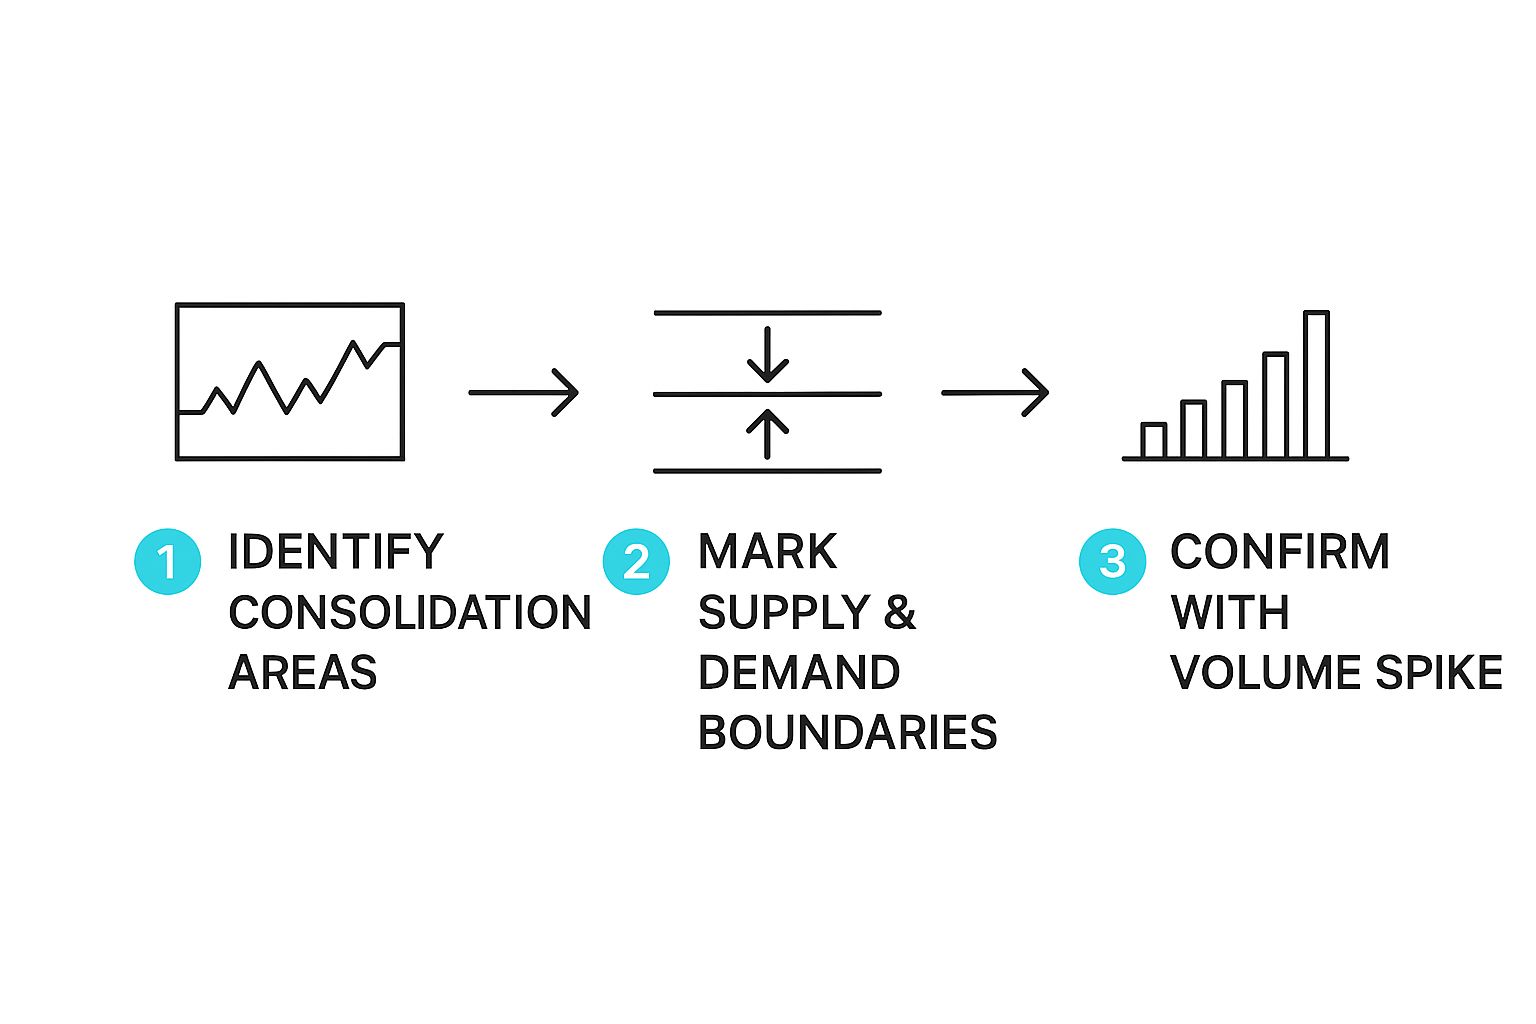
The flow is straightforward but powerful: find the area where price paused, mark the zone that kicked off the explosive move, and use volume as a final confirmation that the big money was involved.
Certain candlestick patterns are fantastic for pinpointing the exact origin of these powerful moves. A classic supply zone, for example, forms when an uptrend hits a wall and reverses. This often happens after a small consolidation where buyers and sellers briefly reach a stalemate before the sellers ultimately win out. These zones then become strong resistance levels. You'll often see price retest the area, with candlestick wicks just poking into the zone before being smacked back down—a clear sign of heavy selling pressure. You can dive deeper into how this price behavior creates solid zones over at PriceActionNinja.com.
The two most common patterns you'll see are:
These patterns are essentially the footprints left behind by institutional traders accumulating orders and then aggressively hitting the market.
Keep this in mind: the strength of a zone is directly tied to how fast the price ran away from it. A lazy exit means a weak zone. An explosive exit signals a powerful, high-probability trading opportunity you won't want to miss.
Take a look at this screenshot from TradingView. It shows a textbook example of a Rally-Base-Drop pattern that carved out a perfect supply zone.
See how the price absolutely plunged away from the base with those big, red candles? That’s your confirmation of intense selling pressure originating right from that area. By training yourself to focus only on zones created by moves like this, you can filter out the vast majority of weak setups and dramatically improve your chart analysis.
Spotting a great supply or demand zone is one thing, but actually making money from it consistently? That takes a solid, rule-based trading plan. This is the bridge you have to build between seeing an opportunity and actually executing it like a pro.
Think of your trading plan as your personal business strategy. It's the playbook that tells you exactly when to get in, how to manage your risk, and where to cash out. Without it, you're not really trading—you're just guessing, hoping the next zone holds up.
First things first, you need a crystal-clear set of entry rules. Vague ideas like "buy at demand" just won't cut it. You need specific, non-negotiable criteria that have to be met before you put a single dollar on the line. This is what builds discipline and consistency.
A great rule to start with is trading only fresh zones. A zone is "fresh" if the price hasn't come back to test it since it was formed. The very first retest of a supply or demand zone is usually the most potent because the big institutional orders that created it are often still sitting there, waiting to be filled. Every time the price revisits that zone, it gets weaker.
You also need to nail down your entry style. Are you more of a "set and forget" trader, or do you prefer to wait for confirmation?
Recent data shows just how effective a structured approach like this can be. Trading strategies built around well-defined supply and demand zones have been shown to outperform classic support and resistance methods by about 68% in success rate. This is because you're targeting the precise areas where institutional money is most likely to move the market. You can dive deeper into the stats behind this in this in-depth analysis of trading success with zones.
No trading plan is complete without airtight risk management. The beauty of trading supply and demand zones is that it makes this part incredibly straightforward. Your stop-loss and take-profit levels aren't just random guesses; they're dictated by the market's own structure.
As a trader, your main job isn't finding winners—it's protecting your capital. Deciding where to place your stop-loss is the single most important decision you'll make in any trade.
Here’s a simple way to structure your risk and reward:
By setting these levels before you enter a trade, you can calculate your risk-to-reward ratio. A solid rule of thumb is to only take trades that offer at least a 1:2 risk-to-reward ratio. This means your potential profit is at least double your potential loss, a key part of any sustainable supply and demand trading strategy.
Putting together a plan takes time and practice. Start by backtesting your rules on historical charts, then move to a demo account to get a feel for it. Tweak your entry rules and risk management until you have a system that feels right for you and, most importantly, gets results. This disciplined process is what separates the pros from the rest.
Manually hunting for high-probability supply and demand zones on a chart works, but let's be honest—it’s a grind. It's time-consuming, and it’s easy to make mistakes or second-guess yourself. What if you could offload all that heavy lifting? This is exactly where modern trading tools are making a huge difference.
AI-powered indicators are changing the game for supply and demand zone trading. Instead of relying purely on your own eyes to catch every subtle pattern, you can now use smart algorithms to do the grunt work. These tools are often designed to mimic how an institutional trader would see the market, flagging key zones with impressive speed and accuracy.
The biggest headache for most zone traders is the sheer amount of time spent scanning chart after chart, across multiple timeframes. An AI tool can whip through the market in seconds, automatically drawing and checking potential zones against its built-in rules.
This does more than just save you a few hours. It takes your emotions and biases right out of the picture. We've all been there—trying to will a trade into existence because a zone looks pretty good. AI doesn't have that problem. It runs on pure data, only highlighting zones that meet strict, objective criteria for strength.
AI doesn't get tired, bored, or greedy. It just analyzes the market with cold, hard logic. This helps you filter out the mediocre setups and focus only on the opportunities the data says are worth your time.
This kind of systematic process brings a new level of consistency to your trading. Every single zone is found using the same proven logic, giving you a much more reliable foundation to build your strategy on.
Here's a key thing to remember: not all zones are created equal. Some are rock-solid, while others are destined to break. A really good AI system can do more than just find zones; it can actually score how strong each one is.
How? By crunching a ton of historical data. The algorithm looks at a few key ingredients to cook up a score:
By turning these factors into a number, the AI gives you a clear pecking order of opportunities. Instead of guessing which demand zone is the "best" one to trade, you get a data-backed score. This helps you point your capital toward the A+ setups and avoid the duds.
One of the most maddening parts of trading is finding a perfect setup, getting distracted, and then realizing you missed the entry by minutes. AI-driven alerts put an end to that frustration for good.
Tools like EzAlgo can be set up to ping you with a real-time notification the second price action enters a supply or demand zone you're watching. These aren’t your basic price alerts; they are smart notifications tied directly to the zones on your chart.
This is a huge deal for a few reasons:
By bringing AI into your supply and demand zone trading, you switch from reacting to the market to being ready for it. You let the tech handle the tedious job of finding and monitoring zones, which frees up your mental energy for what really counts: executing your plan with discipline and precision.
Learning what not to do in supply and demand zone trading is just as important as knowing what to do. Even the sharpest strategy can fail if you keep falling into the same few traps. These common pitfalls are often what separates traders who build lasting success from those who just can't seem to get ahead.
Think of it like developing a good defense. Your first job as a trader is to manage risk, and sidestepping these predictable errors is your best line of defense. Let's walk through the most common mistakes I see traders make, time and time again.
One of the biggest mistakes is treating every zone the same. A supply or demand zone is at its most powerful the very first time price comes back to test it. Each time price revisits that zone, more of the institutional orders get filled, weakening its structure. It’s like a wall getting hit over and over again—eventually, it’s going to break.
A lot of traders will see a zone that's been hit three or four times and still jump in, expecting a big reaction. By that point, the big money that created the zone in the first place is likely long gone. Always give priority to fresh, untouched zones; that’s where you'll find the highest-probability trades.
The rule of thumb is simple: the more a zone gets tested, the weaker it gets. Don't trade a zone just because it's on your chart; trade it because it's strong.
Fighting the dominant trend is a recipe for disaster. Period. Trying to short a small supply zone in the middle of a screaming bull market is like trying to swim upstream against a powerful current. Sure, the zone might cause a little pullback, but the overwhelming buying pressure will probably steamroll right through it.
Your chances of success shoot up when your trades align with the trend on a higher timeframe. If the daily chart is in a clear uptrend, your focus should be on finding great demand zones to buy from. This simple adjustment puts the market’s momentum in your corner, giving your trade a natural tailwind.
Another classic mistake is drawing zones that are just too big to be practical. A demand zone that covers a huge price range might look valid, but it creates a terrible risk-to-reward ratio. If your stop-loss has to be a mile wide, you'll need a massive move just to break even.
Your zones need to be specific and reasonably tight. A well-drawn zone gives you a clear entry point and a logical place to put your stop-loss just on the other side. If a zone looks massive and messy, it's usually a sign of market indecision, not a clean institutional footprint. It’s a low-quality setup you should probably skip.
Even with the best intentions, it's easy to fall into bad habits. The table below is a quick-reference guide to help you spot these common errors in your own trading and, more importantly, know how to fix them.
Getting a handle on these mistakes helps you filter out the junk and focus your energy—and your capital—on setups that actually have a good chance of working out. This kind of discipline is what turns a good idea into a profitable, long-term supply and demand zone trading strategy.
We've covered a lot of ground, from understanding the institutional footprints that create supply and demand zones to building a solid trading plan around them. We’ve looked at how to spot the best zones, manage your risk like a pro, and even bring in modern tools to sharpen your edge. Now, let's tie it all together into a practical roadmap.
Mastering supply and demand zone trading isn't about a magic indicator or a "can't-miss" setup. It's a skill. You're learning to read the market's story, to see where the big institutions made their moves and left clues behind. Real, lasting consistency comes from discipline, focused practice, and following a set of rules that keep your emotions out of the driver's seat.
Having the knowledge is one thing, but turning it into profit is another. You need a methodical way to apply what you've learned. Here’s a simple, three-step plan to start building real skill and confidence.
Train Your Eyes on Past Charts: Before you even think about placing a trade, open up your charts and hit the rewind button. Go back in time and start spotting zones. Your only job is to get good at identifying quality Rally-Base-Drop and Drop-Base-Rally patterns—especially the ones where price shot out of the base like a rocket.
Move to a Demo Account: Once you feel comfortable finding zones on historical charts, it's time for a test drive. Open a demo account and start trading your plan. Practice your entries, set your stop-losses, and define your take-profit targets. This is your sandbox, the place to get a feel for the mechanics of trading without risking a single dollar.
Go Live, but Start Small: After you've found a rhythm and seen some consistent results in your demo account, you can think about trading with real money. But here’s the key: start small. Incredibly small. The goal isn't to make a fortune on day one; it's to get used to the very real feeling of having your own money on the line while sticking to your plan.
The real aim here is to make this process so automatic it becomes second nature. Trading stops feeling like guesswork and starts feeling like you're just executing a proven edge, one trade at a time.
This journey takes patience. You will have moments of frustration, and you will have losing trades—everyone does. But by focusing on the process, not just the profits, and committing to disciplined practice, you can build this powerful strategy into a cornerstone of your trading and take a massive step toward finding true consistency in the markets.
Even when you feel like you have a good grasp of a new trading strategy, questions are bound to pop up. Let's tackle some of the most common ones that traders ask about supply and demand zones. My goal here is to give you clear, no-nonsense answers so you can trade with more confidence.
Think of this as your go-to cheat sheet for clearing up any confusion.
It's a great question because they look similar on a chart, but they're fundamentally different concepts. Support and resistance levels are usually just single lines drawn where the price has bounced or turned around multiple times in the past. They're reactive—we only know they exist after the fact.
Supply and demand, on the other hand, are entire zones. These areas pinpoint the origin of a sharp, powerful price move, which is usually where a stack of institutional orders hit the market. Because these zones mark the source of a major imbalance, they often pack a much bigger punch than a simple line that's been tested over and over.
Honestly, there’s no single "best" timeframe. It really comes down to your personal trading style—are you a day trader glued to the 5-minute chart, a swing trader looking at dailies, or a long-term investor?
That said, one of the most powerful techniques is to combine timeframes. Here’s a practical way to do it:
This top-down approach gives you the best of both worlds: a strategic overview from the higher timeframe and a tactical, low-risk entry from the lower one. It's a game-changer for improving your timing.
Absolutely! In fact, you probably should. Trading with just one tool can be like driving with blinders on. When you combine supply and demand zones with other indicators, you're looking for confluence—multiple signals all pointing to the same outcome. This dramatically increases the odds of a trade working out.
Smart traders look for confluence. A demand zone that lines up perfectly with an oversold RSI reading and a key moving average is a much higher-probability setup than any of those signals by themselves.
Here are a few great indicators to pair with your zone analysis:
Zones don't last forever. The single most important factor here is freshness. A supply or demand zone is at its most powerful the very first time price returns to it.
Think of it like a buffet line. The first group gets the best food. Each time price comes back to a zone, it "eats up" some of the leftover buy or sell orders, weakening it for the next visit. A zone is officially considered broken or invalid once price closes firmly beyond its edge. For example, if price smashes right through a demand zone and closes far below it, you should no longer trust it for buy signals. In fact, it might even flip and become a new area to sell from.
Ready to stop the guesswork and start trading with an analytical edge? EzAlgo’s AI-driven tools automatically find high-probability supply and demand zones, score their strength, and give you real-time alerts so you never miss a setup. Take the manual work and emotional second-guessing out of your trading. Discover how EzAlgo can sharpen your edge.


%201.svg)