


Ever wonder how huge institutions like banks and hedge funds place massive trades without sending the market into a frenzy? They don't just hit a single "buy" or "sell" button. Instead, they leave behind what we call order blocks—specific price zones where they've layered in significant orders.
The order block trading strategy is all about spotting these zones. By identifying where the "smart money" has stepped in, you can anticipate powerful market reversals or continuations. It’s a way to trade alongside the big players, giving you far more precise entry and exit points than traditional methods.

Think of order block trading as seeing the market through an institutional lens. These blocks are literally the footprints left behind by major financial players. To move billions of dollars, they have to be clever, accumulating (buying) or distributing (selling) their positions within a tight price range to avoid spooking the market.
This activity creates a powerful zone that often acts as a pivot point later on. When the price revisits an order block, the leftover institutional orders tend to get triggered, sparking a strong, predictable reaction. It's the market's memory in action.
Classic support and resistance levels are usually just lines drawn from past highs and lows. They can be subjective and often fail. Order blocks, on the other hand, are based on the actual flow of massive amounts of capital. That’s a huge advantage.
When you see a sharp upward move from a specific zone, it’s a sign of institutional accumulation. Conversely, a strong downward move points to distribution. This isn't guesswork; it's a reflection of where billions of dollars have been committed. If you want to dive deeper into this institutional behavior, there are great examples on TradingView.
To put it into perspective, here's how these concepts stack up.
This table really highlights the shift in thinking from just watching price to understanding the forces that move it.
Instead of just hoping a level holds, you're identifying a zone where the big money has already shown its hand.
An order block isn't just a line on a chart; it's a historical record of significant market interest. Learning to read these records allows you to anticipate major price moves before they happen, giving you a distinct edge.
Finding these zones manually takes a trained eye and a lot of patience. You’re looking for specific candle formations, price imbalances, and liquidity sweeps—all while trying to tune out the market noise. It can be exhausting.
This is where a tool like EzAlgo changes the game. It plugs right into your TradingView chart and does all the hard work for you. Its algorithm scans the market in real-time, automatically pinpointing high-probability order blocks.
This frees you up to focus on what really matters: your strategy, risk management, and execution. You spend less time hunting and more time trading. By automating the detection process, EzAlgo makes a powerful institutional strategy accessible to any trader, no matter their experience level.
A messy chart leads to messy trading. Seriously. Before you can even think about finding and trading order blocks, you need a clean, uncluttered workspace on TradingView. This isn't just about making things look nice; it's about creating a canvas where the most important price action—the setups that matter—can pop right off the screen.
Think of it this way: your goal is to let the price and the key zones, like the ones EzAlgo finds for you, do all the talking. When your chart is clean, you can see a valid order block form and react with confidence instead of getting bogged down by a dozen conflicting indicators.
Let’s get this set up right.
First things first, let's get your main tool loaded up. Once you have access to EzAlgo, you'll find it under "Invite-only scripts" in the TradingView indicators menu. Just click to add it to your chart, and you’ll immediately see potential order blocks appear, all without you having to draw a single line.
But here's a pro tip: don't just stick with the default settings. The real magic happens when you tweak EzAlgo to fit your personal trading style. This is a step many traders skip, and it's where you can get a real edge.
Here are a few settings I always recommend adjusting:
Here's what a clean, professional-looking chart should look like. This is your foundation.
This simple layout gives us a crystal-clear view of price. Now, when we add a tool like EzAlgo, it complements the chart instead of cluttering it.
Looking at a single chart is like reading only one page of a book—you're missing the full story. The real strength of an order block strategy comes alive when you use multi-timeframe analysis. It’s how you confirm that a setup is actually as good as it looks.
A great trade setup happens when the story aligns across different timeframes. A bullish order block on the 15-minute chart becomes a high-probability trade when it’s sitting inside a larger bullish zone on the 4-hour chart.
A simple, powerful way to do this in TradingView is to use a multi-chart layout. My go-to setup, and one that works for many pros, is a three-chart view:
By syncing these three charts, you're essentially making sure you're swimming with the current, not against it. This layered approach helps you filter out the noise and dramatically boosts the odds of your trades working out. Your chart is no longer just a chart; it's a dashboard for making smart, high-quality decisions.
With your chart clean and ready, we can get to the heart of the matter: learning to separate a genuinely powerful order block from all the market noise. The EzAlgo indicator does a fantastic job of flagging potential zones, but your real edge as a trader comes from developing the skill to pick only the best of the best.
Not all order blocks are worth your attention. The high-probability ones—the ones that can really define a trade—share a few key characteristics.
Think of yourself as a detective. EzAlgo gives you a clue by highlighting a block, but it's on you to gather more evidence before you risk any capital. This is how you go from just seeing colored boxes to actually reading the story the market is telling you.
A high-probability order block isn't just a random candle; it's a specific price event that shows you where the big institutions left their footprints. Whether you're hunting for a bullish or bearish setup, you need to see two critical components lining up.
First, you have the order block itself. For a bullish setup, this is the last down-candle right before a strong move up. For a bearish setup, it's the final up-candle just before a sharp drop.
Second, and this is the most important part, is the impulsive move that comes right after. This isn't a slow, grinding price change. We're looking for a powerful, energetic explosion away from the block. This tells you a huge order imbalance just happened, and the institutions have made their move with conviction.
A valid order block almost always creates an inefficiency or what's known as a "fair value gap" (FVG). This is a literal gap in price left behind by the aggressive, one-sided move. When you see that gap, it’s a massive confirmation that the move was backed by real institutional money.
One of the most reliable signs of a top-tier order block is that it forms right after a liquidity sweep. This happens when the price briefly pokes above a recent swing high or below a swing low, tricking retail traders into thinking a breakout is underway. In reality, the big players are just grabbing all the available orders (liquidity) before shoving the price hard in the other direction.
When an order block forms after a liquidity sweep, it's a huge tell. It means the institutions didn't just enter the market—they fueled their positions by knocking out the weaker hands first. This is a core concept that makes order block trading so effective.
Even a picture-perfect order block can fail if you're trading against the dominant market trend. A single block is just one clue. You have to put it into the context of the broader market structure. This means zooming out and asking, "Where are we in the grand scheme of things?"
Always check the higher timeframes, like the 4-hour or Daily, to get a read on the overall trend. A bullish order block on a 15-minute chart has a much better shot at working out if the 4-hour trend is also pushing up. This is what we call trading in alignment, and it’s one of the simplest ways to stack the odds heavily in your favor.
Making sure your setup lines up with the bigger picture is a non-negotiable step. Without it, you’re just taking a guess. Verifying your assumptions is also a key part of building confidence, and you can learn more about how to effectively backtest trading strategies in our detailed guide.
Before you ever put money on the line, run every potential setup through this quick mental checklist. It will help you filter out the weak signals and focus only on A-grade opportunities.
If you can confidently answer "yes" to these questions, you've done more than just spot a block. You've validated it, confirmed it, and found a genuinely high-probability trade worth considering.
Finding a solid, high-probability order block is a great start, but it's only half the battle. The real test comes down to execution. This is where your chart analysis turns into actual profit or loss, and where your precision with entry, stop-loss, and take-profit points means everything.
Let's walk through the entire lifecycle of a trade with a real-world example. Say we're looking at the EUR/USD chart on the 15-minute timeframe and we've spotted a strong, unmitigated bullish order block. Even better, it lines up perfectly with a broader uptrend on the 4-hour chart. The setup looks fantastic—so how do we actually trade it?
I've seen it a hundred times: a trader gets antsy and jumps into a trade too early. You see the price heading back toward your order block, and that fear of missing out (FOMO) kicks in. You enter before the zone is even properly tested, only to get stopped out on a final dip right before the price actually reverses.
Patience is your best friend here. The goal is to wait for the price to move into the order block zone. A common and effective entry point is the 50% level of the order block candle, also known as the mean threshold. This gives you a more balanced entry and a much better risk-to-reward ratio than just entering at the top edge.
My Two Cents: Don't just set a limit order and hope for the best. Actively watch how the price reacts when it enters the block. Are you seeing signs of rejection, like long wicks forming on the candles? That's your confirmation that big players are absorbing the selling pressure. This active confirmation can make a huge difference in your win rate.
This diagram shows the flow from spotting a block to actually placing the trade, highlighting why confirmation is so important.
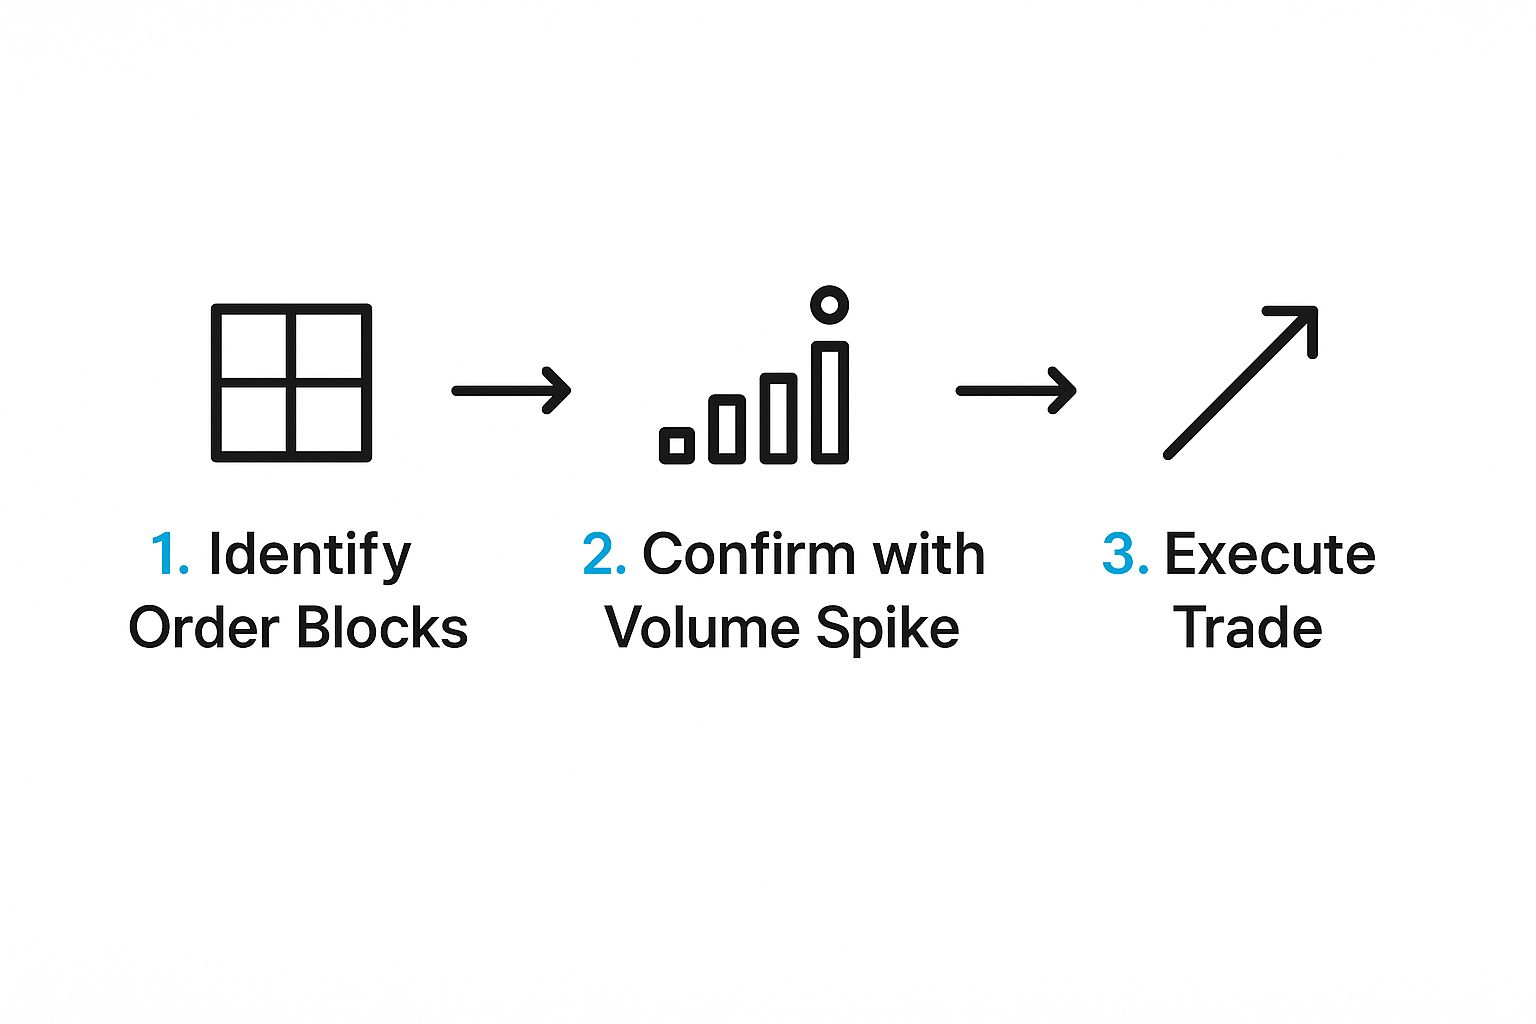
The image drives home the point: after you find a potential order block, confirming the move with other signals like a volume spike is a critical step before you risk any capital.
Your stop-loss isn't just a random price; it’s your get-out-of-jail-free card when a trade goes south. One of the best things about trading order blocks is that stop-loss placement is incredibly logical and objective. There's no guesswork involved.
The rule is simple: place your stop-loss just beyond the outer edge of the order block.
This placement is rooted in the trade's core logic. If the price breaks completely through the order block, the entire reason for the trade is gone. The institutional orders that were supposed to hold that level have failed. Placing your stop here defines your risk clearly and gives the trade enough breathing room without exposing you to a massive loss.
Finally, let's talk about getting paid. While the dream is to let your winners run forever, having predefined take-profit targets is what ensures you consistently bank gains. Here are a couple of my favorite, battle-tested approaches.
Targeting Liquidity PoolsA professional way to set targets is to aim for the next significant pool of liquidity. If you're in a long trade from a bullish order block, you'd typically target the next major swing high. For a short trade, you'd look to the next major swing low. These are spots where other traders' stop-loss orders are likely clustered, and price is naturally drawn to them.
Using a Fixed Risk-to-Reward RatioA more straightforward method is to use a fixed risk-to-reward (R:R) ratio. Since order blocks give you such tight stops, getting great R:R ratios is common. You should never aim for less than a 1:2 ratio, meaning you stand to make at least twice what you're risking.
Honestly, many good setups will offer potential for 1:3, 1:5, or even higher. For instance, if your stop-loss is 10 pips from your entry, a 1:3 R:R target would be 30 pips away. This disciplined approach is the foundation of long-term profitability because it ensures your winning trades are significantly larger than your losing ones.

Having a great order block strategy is one thing, but it's only half the story. The real battle for consistent profit is fought and won inside your own head. I’ve seen it countless times: traders fail not because their strategy is weak, but because their discipline collapses under pressure.
You know the feeling. The stomach-churning fear of missing out (FOMO) when a chart moves exactly as you predicted, but you weren't in the trade. Or that hot flash of anger when a setup that looked perfect inexplicably hits your stop-loss. These emotions are what lead to revenge trading, ignoring your rules, and blowing up accounts.
To succeed long-term, you have to build a resilient mindset—a non-negotiable mental framework that protects you from your own worst instincts.
The cornerstone of a solid trading mindset is rock-solid risk management. Before you dream about profits, you have to become an absolute pro at managing your downside.
This starts with the golden rule: never risk more than 1-2% of your trading capital on any single trade.
Think of this as less of a guideline and more of an unbreakable law. It’s what keeps you in the game long enough to see your strategy play out. A string of five losses at a 2% risk is a totally manageable 10% drawdown. But at a 10% risk per trade? Those same five losses would obliterate half your account.
You enforce this rule with proper position sizing. It’s a simple calculation based on your account size, risk percentage, and the distance to your stop-loss. Mastering the fundamentals of comprehensive risk management for traders isn't optional; it's the price of admission for consistent trading.
A trader’s primary job is not to find winning trades but to manage risk. Profit is simply the byproduct of excellent risk management executed with discipline over a long period.
Once you’re in a live trade, the psychological heat gets turned up. This is where you need more advanced techniques to protect not just your capital, but your mental well-being.
One of the most powerful moves you can make is shifting your stop-loss to breakeven.
After a trade moves well into profit—say, you hit a 1:1 risk-to-reward ratio—slide that stop-loss right to your entry point. Instantly, all the risk is off the table. The absolute worst that can happen is a no-gain, no-loss trade. Now you can let the position run stress-free and aim for those bigger targets.
Just as important is knowing when to sit on your hands and do nothing. Honestly, some of the best trades I've ever made are the ones I chose not to take. High-impact news events, like a Fed announcement or NFP data, can throw a wrench into the most logical market structure. The most beautiful order block setup can get obliterated by pure chaos.
True discipline is having the patience to recognize these volatile periods and simply wait for the storm to pass.
Even with a plan, it's easy to fall into common psychological traps. I've built this table to help you spot these mistakes in your own trading and know exactly how to fix them.
Spotting your own bad habits is the first step. The second is having a clear, actionable plan to correct them before they do serious damage to your account.
Ultimately, a resilient mindset is built not on emotion, but on a foundation of rules you refuse to break. By controlling your risk, managing trades with logic, and knowing when to stay out, you turn trading from a high-stakes gamble into a calculated business. This discipline is what truly separates the pros from the rest.
It's totally normal to have questions when you're getting the hang of a new trading strategy. Getting good answers is what builds the confidence to actually pull the trigger on a trade. I've heard these same questions from countless traders, so let's walk through them.
Think of this as your personal cheat sheet. We'll break down the common sticking points so you can get back to the charts and apply what you've learned.
This is a great question because it cuts right to the chase. They look similar, but the difference is all about precision.
A supply or demand zone is just a general area where the price turned around before. An order block, on the other hand, is much more specific. It's the very last opposing candle right before a sharp, powerful move that breaks the market structure. That specificity is what gives it an edge—it signals a clear institutional footprint.
For instance, a bullish order block isn't just any old area of demand; it's the final down-candle before a huge spike up. This lets you pinpoint your entry with incredible accuracy, which naturally tightens up your risk. This is where a tool like EzAlgo really shines, by automatically identifying these exact candles and separating the high-value blocks from the generic zones.
Absolutely. The patterns that form order blocks are fractal, meaning you'll see them on a 1-minute chart just like you'll see them on a monthly chart. But—and this is a big but—not all timeframes are created equal.
Higher timeframe (HTF) blocks, like those on a 4-hour or daily chart, are the heavy hitters. They represent major institutional money and often act as significant turning points for the market. Lower timeframe (LTF) blocks on the 5-minute or 15-minute charts are fantastic for nailing your entries, but they don't have the same stopping power on their own.
My best advice? Use them together. Find your major order blocks and overall trend on a higher timeframe. Then, zoom into a lower timeframe to find an entry that aligns with that bigger picture. It's about getting the best of both worlds and stacking the odds in your favor.
The life of an order block comes down to one simple idea: mitigation. An order block is considered "fresh" and tradable as long as the price hasn't come back to it since it was formed.
Once the price returns and the body of a candle fully closes past the block, it's considered mitigated, or "used up." Think of it like this: the institutional orders that were parked there have likely been filled, and the zone has done its job.
Always prioritize fresh, unmitigated blocks. They hold the most potential because the original orders are still sitting there, waiting to be triggered. These are the zones that give you the most reliable reactions.
This is where the strategy really pays off. Because your entry and stop-loss are so well-defined, you can target profits that are multiples of what you risk. It's not uncommon to see incredible risk-to-reward (R:R) ratios.
As a rule of thumb, you should never take a trade with less than a 1:2 R:R. This means for every $1 you risk, you're aiming to make at least $2. This simple discipline ensures you can still be profitable even if your win rate is below 50%.
With high-quality setups, finding opportunities with 1:3, 1:5, or even higher is very achievable. Sticking to a strict R:R plan is what separates consistently profitable traders from the rest. It protects your capital and keeps you in the game.
Tired of manually hunting for order blocks? EzAlgo does the heavy lifting for you, automatically plotting high-probability zones right on your TradingView chart. Get the clarity you need to trade with confidence. Upgrade your trading with EzAlgo today!


%201.svg)