


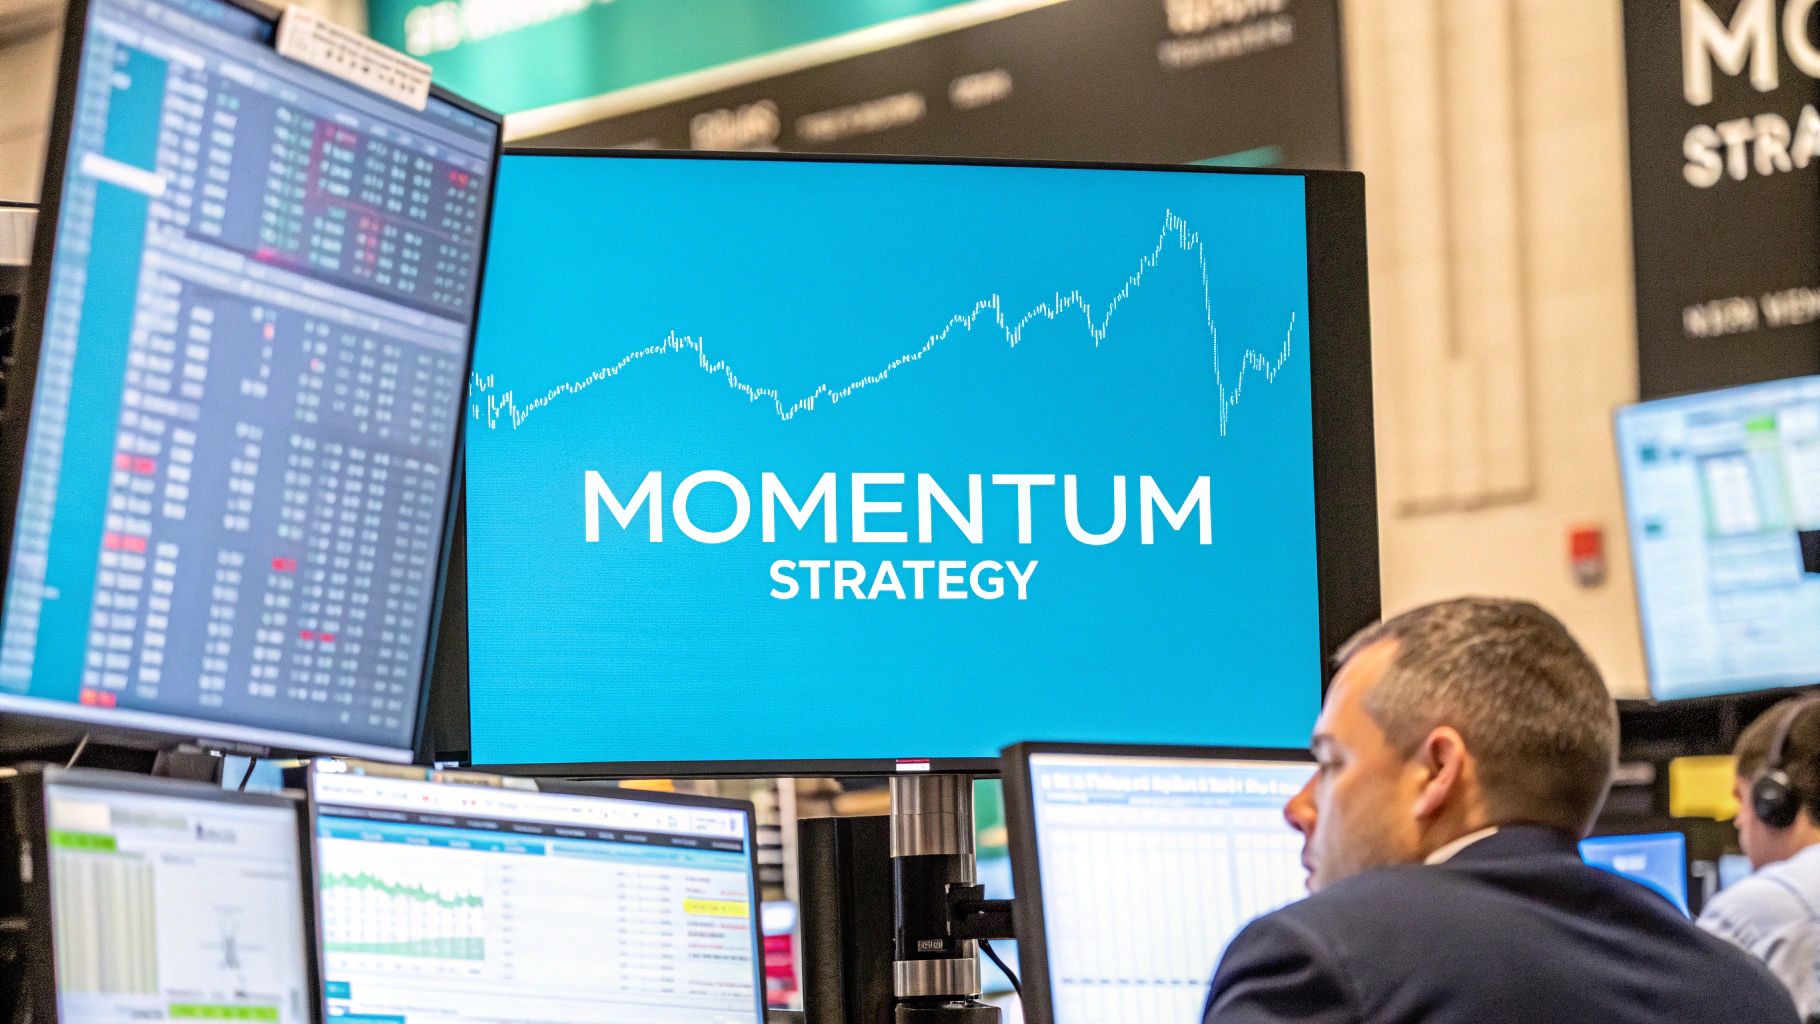
Think about a championship sports team on a massive winning streak. It makes more sense to bet on them to keep winning than to bet against them, right? That’s the basic idea behind momentum trading. You find assets that are already on a tear and ride that wave for as long as it lasts.

At its heart, momentum trading is built on a simple physics principle: an object in motion stays in motion. In the market, this means an asset with a strong upward (or downward) price trend is likely to keep heading in that same direction, at least for a while. It’s all about focusing on the market's current strength, not trying to predict a bottom or find a hidden bargain.
This is the opposite of value investing, where the goal is to "buy low, sell high." Momentum traders are perfectly happy to "buy high and sell even higher." They're tapping into the persistence of price trends, which are often pushed along by things like big news, investor herd mentality, and large institutional buying or selling.
The strategy isn't just a gut feeling; it's backed by a lot of market data and research. Some of the most foundational academic studies have shown that it works across different markets and timeframes. A landmark paper, for instance, showed that buying the best-performing stocks from the last 3 to 12 months and selling short the worst performers could generate a significant edge.
How big of an edge? We're talking about an annualized return advantage of roughly 12% before transaction costs. You can dig into the foundational momentum research yourself to see the data.
This shows that momentum isn't just random luck. It's a real, persistent market anomaly. A trader using this approach is essentially betting that market psychology—like fear of missing out (FOMO) and herd behavior—will keep pushing prices along a clear path.
A momentum trader doesn't try to predict the future. Instead, they react to what the market is currently doing, aligning their trades with the strongest and most established trends.
Let's be clear: momentum trading isn't for everyone. It demands a certain type of personality and a rock-solid approach to managing risk. It's usually a good fit for traders who are:
This approach requires constant attention. You have to accept that you'll have losing trades. The whole point is to make sure your winning trades are bigger than your losing ones, letting you profit from the market's momentum over time.
To really get the hang of a momentum trading strategy, you first have to understand what makes it tick. It’s not some market secret or magic formula. It’s just human nature.
The powerful trends that momentum traders look for are often fueled less by a company's actual value and more by the predictable—and sometimes totally irrational—behavior of other traders.
Think of a snowball rolling downhill. It starts small, but as it gathers more snow (investors), it gets bigger and moves faster. The initial push might be a solid earnings report or some good news, but the real momentum comes from the psychological drivers that follow.
These behaviors create little pockets of inefficiency in the market. And for a momentum trader, those inefficiencies are pure opportunity.
At its heart, market momentum is just a massive reflection of collective human emotion. When you boil it down, a few key psychological triggers are doing the heavy lifting to create and sustain trends.
Herd Behavior: We're wired to follow the crowd. When a stock starts to climb and everyone's talking about it, the natural instinct for many is to jump on board. This new wave of buyers pushes the price even higher, simply because everyone else is doing it.
Fear of Missing Out (FOMO): This one is a monster. As an asset's price shoots up, traders on the sidelines get antsy. They feel an intense pressure to buy in before they miss the boat entirely. That rush of demand is like pouring gasoline on a fire.
Confirmation Bias: We all want to be right. Once someone buys a stock, they naturally look for information that confirms their brilliant decision while conveniently ignoring anything that suggests they might be wrong. This helps investors hold onto winning stocks longer, which keeps the momentum going.
These forces create a powerful feedback loop. Rising prices bring in more buyers, their buying pushes prices higher, and the cycle continues. It becomes a self-fulfilling prophecy that can carry a trend way beyond what the company's fundamentals might suggest.
But it’s not just individual traders caught up in the hype. Institutional investors—the big guns like mutual funds and hedge funds—are major players here. When a stock starts showing serious strength and meets their strict performance criteria, they often start buying in massive volumes.
These institutions move so much capital that their buying pressure alone can create the kind of sustained, powerful trends that a momentum trading strategy is built to catch. When they get involved, it's a huge vote of confidence that pulls even more people into the trade.
The interesting thing is, none of this is new. Momentum has been a real, measurable force in markets for over a century, all driven by the same timeless human behaviors we see today.
History backs this up. Data shows that momentum strategies have been consistently profitable across global markets for generations. In fact, one study found that while modern momentum portfolios hit a downturn every 15 to 16 months on average, these slumps were even less frequent before 1907. This isn't some fleeting fad; it's a deep-rooted dynamic of the market.
Want to dive deeper into this? Check out our complete guide on momentum trading strategies.
Spotting real momentum isn't just about eyeballing a chart and hoping for the best. If you want to trade a momentum trading strategy effectively, you need the right tools to measure a trend's actual strength and staying power. Think of these indicators as the dashboard of a race car—each gauge gives you critical feedback to make sharp, decisive moves.
Flying blind is a recipe for disaster. With the right indicators, you can pinpoint high-probability setups, sidestep false starts, and, just as importantly, know when a trend is running out of gas. They help you turn a gut feeling into a repeatable, rules-based process, which is the secret to consistency in trading.
One of the first tools most momentum traders learn is the Relative Strength Index (RSI). It’s a classic momentum oscillator that measures the speed and magnitude of recent price changes, displayed on a scale from 0 to 100.
Now, most trading books will tell you that an RSI reading above 70 is "overbought" (a sell signal) and a reading below 30 is "oversold" (a buy signal). But for a momentum trader, that’s completely backward.
We see a sustained overbought reading as a sign of incredible buying pressure—exactly what we're looking for! A stock that can hang out in the 70+ zone for a while is showing off its strength. On the flip side, a price that stays pinned below 30 signals powerful downward momentum, making it a potential short-selling target.
The key takeaway here is simple: for a momentum trader, an RSI that stays consistently above 50 points to a healthy uptrend. An asset that gets "stuck" in the overbought zone is often a prime candidate for a long position because it shows buyers are in complete control.
Next up is the Moving Average Convergence Divergence (MACD) indicator. This one is all about revealing shifts in a trend's strength, direction, and momentum. It looks a little more complex, with two lines (the MACD line and the signal line) and a histogram, but the signals are actually very straightforward.
For momentum traders, it boils down to two key events:
The histogram gives you an even quicker read. When the bars are above the zero line and getting taller, bullish momentum is growing. When they are below the zero line and getting longer, bearish momentum is taking over. This makes the MACD a fantastic tool for both confirming a trend and spotting the very first signs that it might be about to change.
While RSI and MACD are great for direction, the Average Directional Index (ADX) answers a totally different but crucial question: "Is this trend even strong enough to bother with?" The ADX doesn't care if the trend is up or down; it only measures its raw power on a scale of 0 to 100.
Here’s how to read it at a glance:
This image highlights the different risk-reward profiles for two common momentum entry signals—the breakout and the pullback.
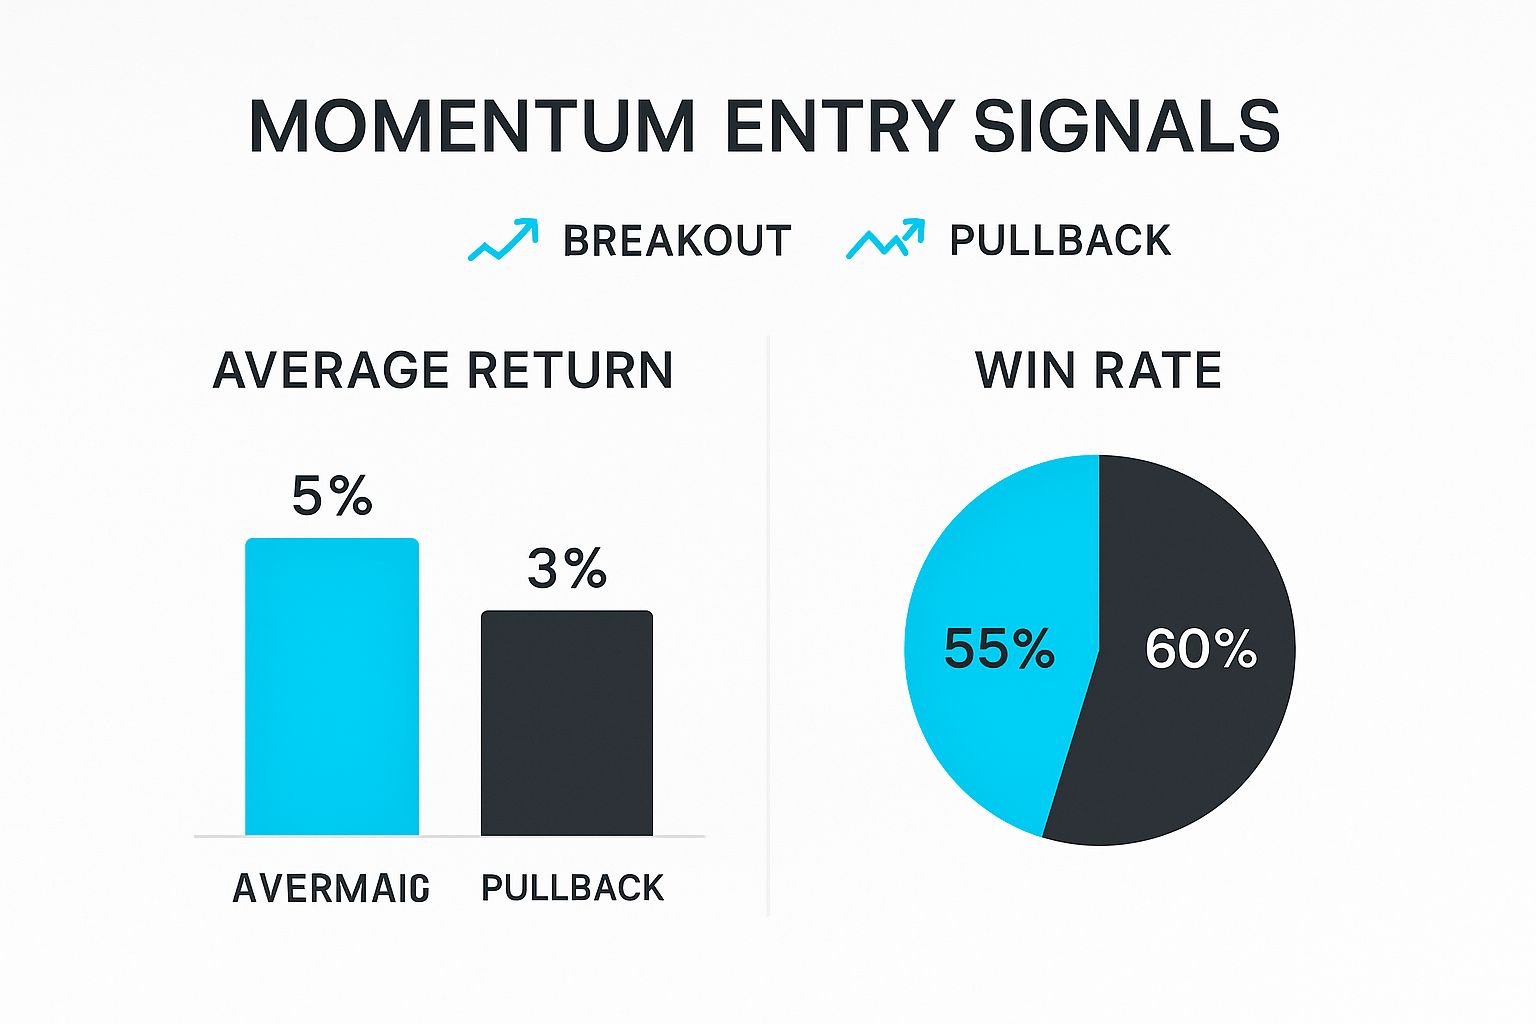
As you can see, breakout entries often produce a higher average return but with a lower win rate. Pullbacks, on the other hand, tend to win more often but with a smaller average gain per trade.
When you start combining these tools, your analysis gets much sharper. For example, a bullish MACD crossover is interesting on its own, but a bullish MACD crossover while the ADX is above 25 is a much more powerful, high-confidence signal. This kind of multi-indicator approach is how you filter out the noise and focus only on assets with real, explosive potential.
To help you keep these straight, here's a quick breakdown of how the big three momentum indicators stack up against each other. Each one tells a different part of the story, and they work best when used together.
Ultimately, no single indicator is a magic bullet. The real skill lies in learning how to read them in context—both with each other and with the price action on your chart. This layered approach is what separates amateurs from experienced momentum traders.

Jumping into a momentum trade without a plan is like sailing into a storm without a map. Sure, you might get lucky, but chances are you're going to get swamped. A solid momentum trading strategy isn't just about picking a few indicators; it's a full-blown business plan for every single trade you make.
Having this plan is what keeps you grounded. It strips the emotion out of your decisions, swapping gut feelings and guesswork for a clear, repeatable process. When the market is going wild, your plan is the anchor that keeps you disciplined and focused. It tells you what to trade, when to get in, and—most importantly—when to get out.
First things first: you can't trade everything. Trying to keep an eye on the entire market is a surefire way to get overwhelmed and miss the real opportunities. The trick is to create a manageable watchlist of assets that fit your trading style.
So, narrow it down. Your "universe" might be a specific sector known for big moves, like tech or biotech stocks. Or maybe you’ll focus on major forex pairs or a handful of high-volume cryptocurrencies.
The point is to become a specialist in your own little corner of the market. When you know an asset class inside and out, you’ll spot unusual strength or weakness way faster than someone trying to watch a thousand different charts.
Your entry rules are the non-negotiable conditions that must be met before you even think about hitting the "buy" button. Think of them as your final checkpoint against making impulsive, emotional trades. These rules are built directly from the indicators we've already covered.
A strong entry checklist might look something like this:
These rules need to be black and white. There's no room for "almost" or "good enough." It’s a simple yes or no. This mechanical approach is what ensures you're only taking trades that match your highest-probability setups.
"A trading plan is a roadmap to profitability. Without it, you are simply navigating the markets blindfolded, guided only by hope and fear. Your rules define your edge and protect your capital from your own worst impulses."
This is easily the most crucial part of any momentum trading strategy, and it’s the one most traders ignore. Knowing your exit points—for both taking profits and cutting losses—is what separates the pros from everyone else.
You need to define two things before you ever place the trade:
Beyond that, many momentum traders swear by a trailing stop-loss. This is a dynamic order that moves up as the price climbs, locking in your profits while still giving the trend room to breathe. It helps you ride the wave for as long as possible without giving everything back when the tide inevitably turns. Never, ever enter a trade without knowing exactly where your exits are.
The rush of catching a powerful trend is what gets a lot of us into momentum trading. But every trader has to ask themselves the tough question: what happens when the trend dies? If you don't have an answer, you're setting yourself up to hand back all your hard-earned profits, and probably more.
High-flying stocks don't just gently float back to earth; they can reverse hard and fast, leading to what traders call a "momentum crash." These sudden reversals can wipe you out if you're not prepared. That's why mastering risk management isn't just a good idea—it's the only way you'll survive in this game long-term. Your defense has to be as strong as your offense.
The most critical tool you have for managing risk is the stop-loss order. Simple as that. It’s an order you set ahead of time to automatically close your position if the price moves against you by a certain amount. It's your safety net, there to catch you before a small, acceptable loss snowballs into a disaster.
Think of it like this: you wouldn't drive a car without brakes, would you? A stop-loss is your brake pedal in the market. It pulls the emotion right out of the decision to cut a loser, acting on the clear-headed logic you had when you first entered the trade.
Going all-in on a single, high-flying stock is a recipe for disaster. Sure, concentrating your capital can build wealth incredibly fast, but it can destroy it just as quickly. A much smarter move is to spread your momentum bets across a few different assets that don't move in lockstep with each other. If one trend suddenly fizzles out, the others can help soften the impact.
How much you risk on each trade, or position sizing, is just as important. A solid rule of thumb is to never risk more than 1-2% of your total trading capital on any one idea. This discipline is what keeps you in the game. It ensures that a string of bad luck won't wipe you out, so you can live to trade another day and catch the next big move.
Risk management isn't about avoiding losses altogether—that's impossible. It's about making sure your wins are bigger than your losses, and that no single loss can ever take you out of the game for good.
Momentum trading plays on our most powerful emotions, like greed and the fear of missing out (FOMO). These feelings are dangerous traps. Chasing a stock after it has already made a massive run is a classic rookie mistake. By the time a trade looks like a sure thing to everyone, the easy money is usually gone, and the risk of a reversal is at its peak.
Fear is the other side of that coin, causing you to snatch profits way too early. You end up cutting your winners short while—you guessed it—letting your losers run. Having a disciplined trading plan is your best defense against these impulses.
For a deeper dive, check out our complete guide on risk management for traders. Ultimately, sticking to your rules for entries, exits, and position sizing is the only way to protect yourself from your own worst enemy: your emotions.
Even the most seasoned traders have questions when refining a new strategy. Let's tackle some of the most common ones that come up with momentum trading to give you a clearer path forward.
This is a great question, but the answer isn't on the clock. Momentum trades aren't like day trades where you're in and out by the end of the day. Instead, the length of the trade is dictated entirely by the strength of the trend.
You could be in a position for a few weeks or even several months. The goal is simple: ride the momentum for as long as it lasts. You don't exit based on a calendar date; you exit when your indicators tell you the party is over or when a trailing stop-loss gets hit.
You bet. Momentum works both ways, up and down. During a bear market, the strategy is just as powerful, but you're flipping the script. Instead of looking for stocks breaking out to new highs, you're hunting for assets that are in a strong, confirmed downtrend.
Here, the goal is to "short sell" and profit from the falling prices. All the same tools and indicators apply—you're just using them to catch and ride the downward wave. This makes momentum trading an incredibly flexible strategy that can work no matter which way the market is heading.
The core principle remains unchanged: identify the strongest trend and trade in that direction. In a bear market, the strongest trend is often downward.
Hands down, the single biggest killer of a momentum trading account is sloppy risk management. It’s a rookie mistake and a pro mistake, and it can show up in a few devastating ways.
Here’s where traders often go wrong:
The antidote is discipline. You have to follow your rules for entry, exit, and how much you'll risk on each trade with almost robotic consistency. The moment you let fear or greed take the wheel, you're setting yourself up for failure.
Ready to stop guessing and start trading with data-driven signals? EzAlgo provides the advanced indicators and real-time alerts you need to master your momentum trading strategy. Eliminate emotional bias and gain a technical edge.


%201.svg)