


A commodities trading strategy is your personal rulebook for buying and selling raw materials like oil, gold, or corn. It’s not about making wild guesses or trading on a whim. It’s a clear, repeatable plan that dictates precisely when you enter and exit trades, how you'll handle risk, and how much money you'll put on the line.
Think of it as the blueprint for building a house. You wouldn't just start nailing boards together and hope for the best, right? You need a detailed plan that covers every angle. This blueprint is what keeps your emotions in check when the market gets chaotic.
Imagine a pilot flying through a storm. They don't panic and start flipping random switches. They rely on their flight plan and their instruments to navigate safely. A trading strategy is your flight plan in the often-turbulent commodities market.
Without one, you're not really trading; you're gambling. A solid strategy provides the structure you need to make logical decisions instead of emotional ones. The core elements of any good plan are actually quite simple, but they are absolutely critical.
Every effective trading strategy rests on three core pillars. If you ignore even one, your whole approach becomes unstable, like a three-legged stool with one leg missing. It just won't hold up when the market pressure is on.
A trading plan is your roadmap. It tells you where you are, where you want to go, and how you intend to get there, preventing you from getting lost in the market's noise.
Before we get into the nuts and bolts of specific strategies, it helps to know what you're actually trading. Commodities usually fall into four main buckets: energy (like crude oil), metals (gold and copper), livestock (cattle and hogs), and agricultural products (corn and soybeans). Each group behaves differently and is driven by unique forces, so understanding these basics is key to building a successful blueprint.
To get a real feel for where commodity markets are headed, you have to look back at where they've been. History isn't just a dusty record of old prices; it’s a living story full of booms, busts, and the massive global forces that have shaped our world. When you dig in, you start to see a clear pattern: these markets move in big, sweeping cycles.
Think of it like seasons. There are long periods of growth and equally long periods of decline. These aren't random blips on a chart. They're often tied to major economic shifts and world events. Learning to recognize the signs of these seasons can give you a huge edge.
One of the most powerful concepts you'll come across is the commodity supercycle. This isn't just a temporary price swing. A supercycle is a massive, multi-decade price trend that gets kicked off by a fundamental change in the global economy. It's the kind of shift that reshapes everything.
These long-term trends don't just happen. They're driven by powerful, specific events that completely alter the balance of global supply and demand for years at a time.
The big takeaway here is that while the headlines and the players change, the cyclical nature of the market is a constant. Grasping this is the bedrock of any solid trading strategy.
The data backs this up. The Dow Jones Commodity Futures Price Index, for example, climbed at an average of about 3.7% per year between 1933 and 1998, a period that saw several of these huge cycles. More recently, as global tensions and crises ramped up, the volume of electronically traded commodity contracts nearly tripled over a decade while prices doubled. You can explore a detailed history of the commodity market to see these patterns for yourself.
By studying these past booms and busts, you gain something invaluable: perspective. This historical lens helps you tell the difference between short-term market noise and the early signs of a major, long-term trend—a critical skill for anyone serious about commodity futures trading.
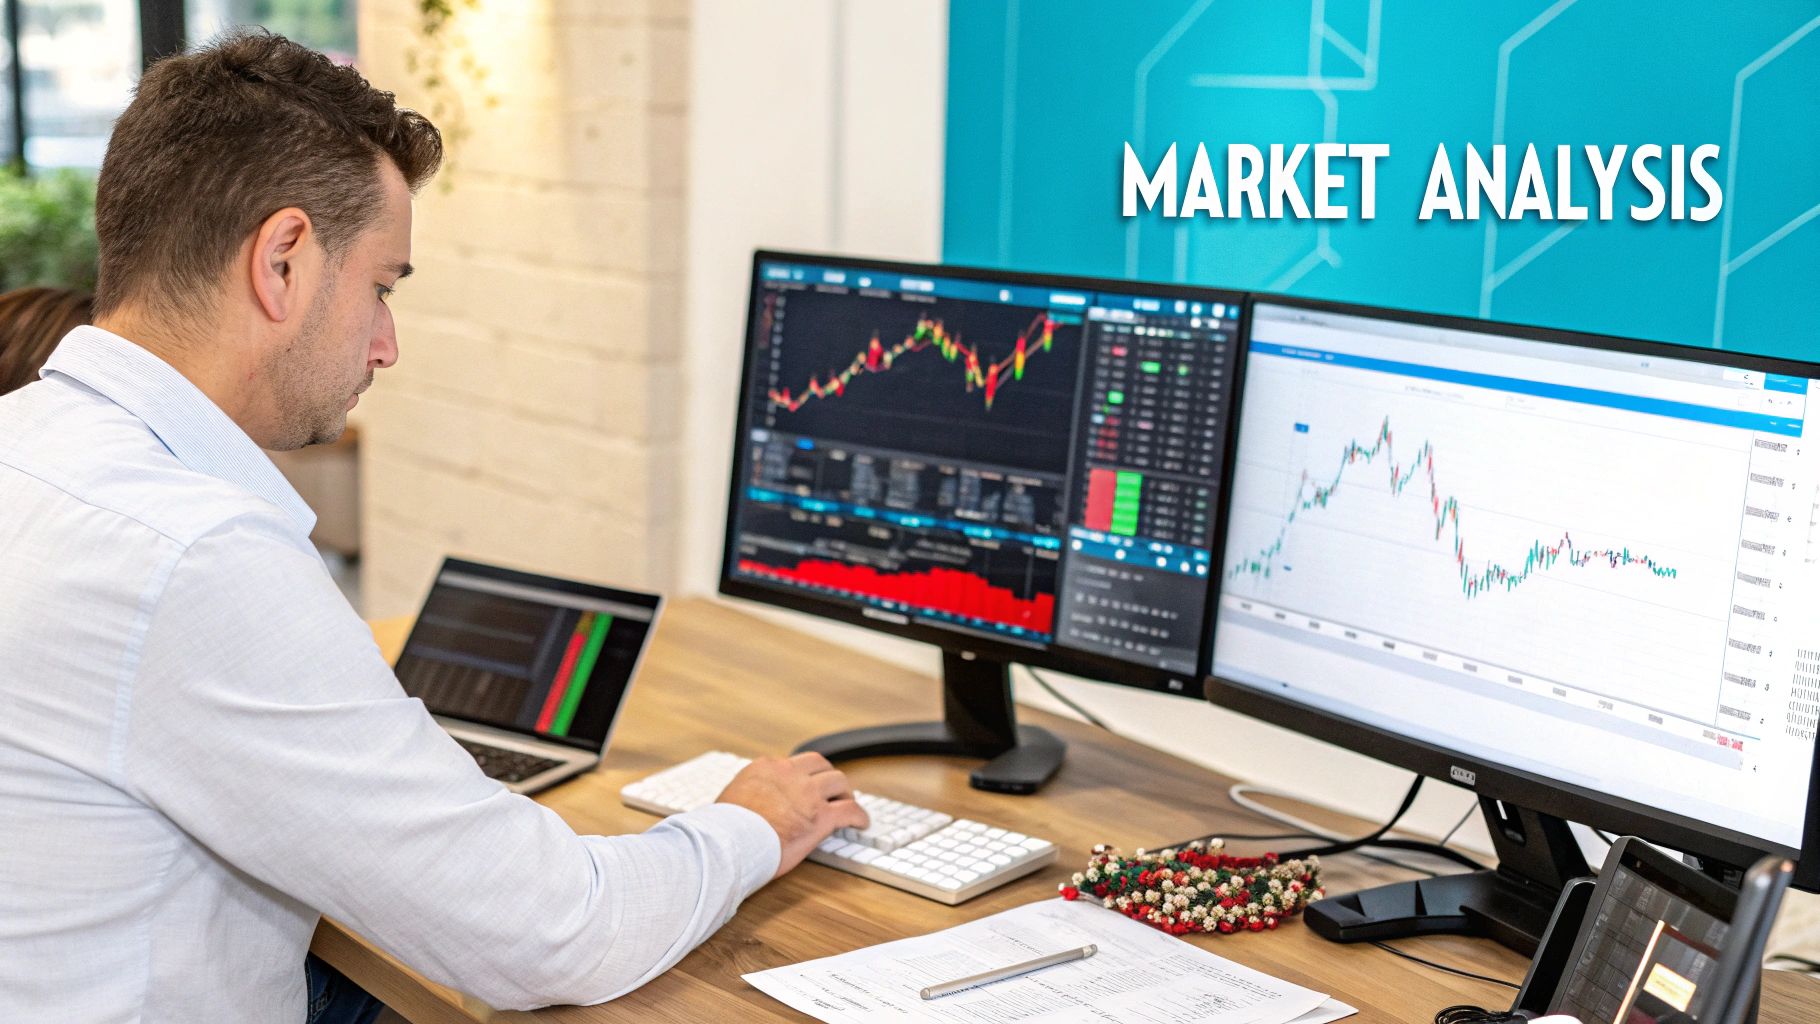
Every solid commodities trading strategy starts with a plan for reading the market. While you'll encounter a dizzying array of tools and indicators, they almost all boil down to two core philosophies: fundamental analysis and technical analysis. Getting a handle on both is crucial for building a strategy that works for you.
Think of it like this: A fundamental analyst is a detective, piecing together clues from reports, news, and global events to figure out what a commodity should be worth. A technical analyst, on the other hand, is more like a psychologist, studying the market's mood swings through price charts, convinced that all the important information is already out in the open.
Fundamental analysis is all about the big picture. It digs into the real-world supply and demand forces that ultimately push a commodity's price up or down. A trader using this approach is constantly asking, "What is this stuff actually worth, based on what's happening in the world right now?"
The whole game is to spot a disconnect between the current market price and its true, underlying value. For instance, if a sudden, severe drought scorches a major wheat-producing region, a fundamental analyst would immediately anticipate a supply crunch. They’d see a clear reason for prices to climb, signaling a potential opportunity to buy.
They’re constantly poring over details like:
This is where a deep understanding of risk comes into play, as you have to weigh all these complex and often unpredictable factors.
The image of a desk covered in reports and a calculator perfectly captures the detail-oriented work involved. It's about doing the homework to understand the fundamental risks before ever putting capital on the line.
Technical analysis, in sharp contrast, tunes out the "why" and focuses entirely on the "what." The core belief here is that all those fundamental factors—from weather to politics—are already reflected, or "baked into," the price you see on the screen. For a technical trader, the price chart is the entire universe.
This approach is all about recognizing historical patterns in market behavior and betting that they'll repeat. For example, a technician might see a classic "bullish flag" pattern forming on a gold chart. To them, this is a clear signal that the price is gathering steam for another move up, regardless of what the latest jobs report says.
"The only way to make money in the markets is to have an edge. I don't see how you can have an edge in fundamental analysis, because I think there are too many people doing it." - Legendary Trader Monroe Trout
Technical analysts have a whole toolbox to help them spot these opportunities, including:
So, which one is right? The truth is, they're just different lenses for viewing the same market. To make it clearer, here’s a quick side-by-side comparison.
Ultimately, many of the most successful traders I know don't chain themselves to just one method. A common and very powerful approach is to use fundamental analysis to decide what to trade—like identifying that wheat is a good buy—and then use technical analysis to decide when to pull the trigger, finding the perfect entry point.
By blending the strengths of both, you can build a much more robust and complete commodities trading strategy.
Alright, you've got the basics of market analysis down. Now, let's get into the fun part: the actual game plans traders use to navigate the commodity markets. A solid commodities trading strategy isn't just a vague idea; it's a complete playbook with entry, exit, and risk management rules.
Think of these strategies like different tools in a toolbox. Some are perfect for calm, predictable markets, while others are built to handle wild, unpredictable swings. The real skill is knowing which tool to pull out for the job at hand.
Let's walk through three of the most popular strategies you can start with.
Trend following is probably the most straightforward strategy out there. The core concept is simple: find a market that's clearly moving in one direction—up or down—and just go with the flow. You're not trying to be a hero by predicting the absolute top or bottom. Instead, you're aiming to catch the big, juicy middle of a sustained move.
It's a bit like being a surfer. You don't create the waves. You just sit on your board, watch the ocean, and wait patiently for a big one to form. When it does, you paddle hard, get on, and ride its momentum for as long as you can. Trend followers do the same, using tools like moving averages to confirm a trend is real before jumping in.
This strategy really shines in markets making strong, decisive moves over a long period. It demands a ton of patience and discipline because you'll often take small losses on false signals while waiting for that one massive trend that pays for everything.
A trend follower's goal isn't to win every time. It's to win so big on the few trades that work that all the small losses become irrelevant.
If trend following is about patience, breakout trading is all about explosive action. This strategy is laser-focused on identifying key price levels—what we call support and resistance—and pouncing the moment the price smashes through them. The idea here is that a powerful breakout often signals a major shift in market psychology and the beginning of a brand-new trend.
Picture a coiled spring. The more it's compressed, the more powerful the release when it finally pops. A breakout trader is trying to get in on the trade right at that moment of release.
For instance, say crude oil has been stuck trading between $75 and $80 a barrel for weeks. A breakout trader sets an alert and is ready to buy the second the price breaks decisively above $80. The bet is that this move will trigger a flood of new buyers, pushing the price much higher. Oil is a classic market for this, as its price can react violently to global events. Over the past 50 years, the oil market has seen incredible price spikes and collapses, creating some legendary breakout opportunities, which you can read more about in this World Bank analysis of commodity markets.
So what do you do when the market isn't going anywhere fast? That's where range trading comes in. While the other two strategies need momentum, this one is designed for quiet, sideways markets. It's all about identifying a clear trading channel with a solid ceiling (resistance) and floor (support), then simply buying near the bottom and selling near the top.
Think of it like a game of ping-pong. The price just bounces back and forth between two predictable lines. A range trader simply stands at either end of the table and hits the ball back. This commodities trading strategy is a go-to when there's no clear trend and the market is just consolidating, waiting for its next big move.
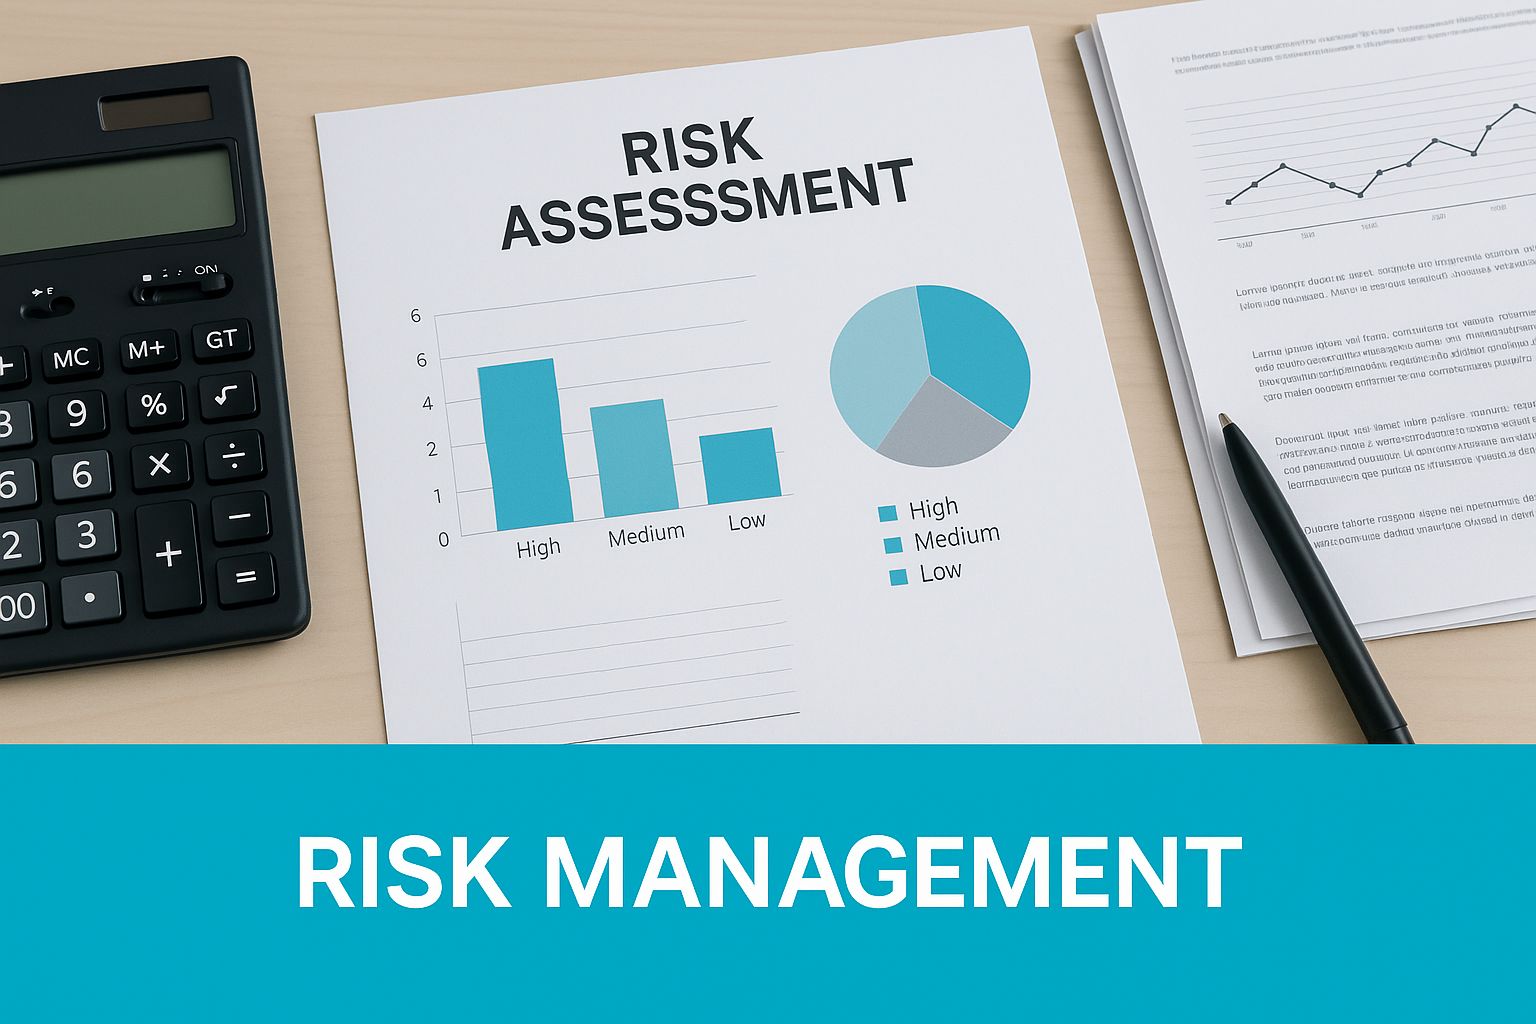
A great commodities trading strategy isn't just about picking winners. It's really about how you handle the losers. That might sound backward, but your ability to survive in this game comes down to protecting your capital when a trade moves against you. Without a solid risk management plan, one bad trade can easily erase a whole string of wins.
Think of your trading capital as the fuel for your car. The destination might be fantastic, but if you run out of gas, you're not going anywhere. Risk management is all about making sure you have enough fuel to stay on the road and actually reach your goals. Honestly, it's the one skill that truly separates traders who make it from those who don't.
One of the simplest yet most powerful rules to live by is the 1% Rule. It’s incredibly straightforward: never risk more than 1% of your total trading account on any single trade. So, if you have a $10,000 account, you should never stand to lose more than $100 on one position.
This rule is a game-changer psychologically. It keeps any single loss from feeling like a big deal, which helps you avoid emotional mistakes like revenge trading. By keeping your risk small and consistent, you make sure no single trade can ever knock you out of the market.
Effective risk management is the foundation upon which all successful trading careers are built. It's not about being timid; it's about being smart enough to stay in the game.
So, how do you actually stick to the 1% Rule? Your most important tool is the stop-loss order. A stop-loss is just a pre-set order with your broker to automatically sell a commodity if it drops to a certain price. It’s your eject button—it gets you out of a bad trade before the loss gets out of hand.
The other key piece of the puzzle is position sizing. This just means you calculate how much of a commodity to buy or sell based on its volatility and where you set your stop-loss. This calculation ensures that your potential loss always stays within that 1% risk limit, no matter how wild the market gets.
To really nail these concepts, check out our complete guide on risk management for traders. Once you master these techniques, you stop hoping the market will go your way and start taking control of the one thing you can: your potential losses.
Not too long ago, executing a solid commodities strategy was a grind. It meant hours of manual chart analysis and gut-wrenching guesswork. Today, technology can act as your second set of eyes, helping you navigate the markets with more discipline and a whole lot less stress. Think of these tools as a way to automate the grunt work, freeing you up to focus on the big picture.
Can you imagine trying to track dozens of commodities at once? You'd be flipping between charts, scanning for specific patterns, and trying to keep up with every headline. It’s just not humanly possible. Modern trading platforms can do this in a split second, pinging you the moment an opportunity lines up with your criteria. This isn't about letting a robot trade for you; it's about making your own judgment sharper.
One of the best things to come out of modern trading tech is backtesting. This is your strategy’s flight simulator. It lets you run your trading ideas against years of real historical data to see how they would have held up through different bull and bear markets. Best of all, you can crash and burn as many times as you need to without risking a single penny of actual capital.
Another game-changer is real-time market monitoring. Indicators can automatically keep a pulse on broad market sentiment using tools like the Commodity Research Bureau (CRB) Index, which lumps together a basket of raw materials to give you a quick snapshot of where things are heading. For instance, while the index might show you the general trend, you can simultaneously see that crude oil is hovering near $64 a barrel and gold has pushed past $3,400 an ounce, giving you the context needed for smarter decisions. You can always find the latest commodity index data and trends on TradingEconomics.
Modern trading tools don't just throw data at you; they provide clarity. By automating the tedious work of pattern recognition and risk calculation, they help you stick to your plan and keep emotions out of the driver's seat.
At the end of the day, these tools help you trade smarter, not harder. They take care of the repetitive, data-heavy tasks where we humans tend to make mistakes. By weaving platforms with AI-driven signals and automated alerts into your workflow, you can execute your strategy with a level of insight and efficiency that used to be only for the big Wall Street firms.
Jumping into the world of commodities can feel like a lot to take in at first, but you're not alone. Most beginners start with the exact same questions, and getting clear on the answers is the first step toward building a solid trading strategy.
One of the biggest questions is always about money: How much do I actually need to start? While there’s no one-size-fits-all answer, the golden rule is to only trade with capital you are prepared to lose. Many traders get their feet wet with a few thousand dollars, using smaller contracts or commodity ETFs to learn the market's rhythm without risking the farm.
Another hurdle is simply figuring out where to start. Gold? Oil? Soybeans? It's a huge field. A great piece of advice is to begin with a commodity you already know something about or at least find genuinely interesting.
If you’re always keeping up with farming news, maybe trading wheat or corn makes sense. If you're a bit of a global economics nerd, the movements of crude oil or copper might be right up your alley.
The key is to focus on just one or two markets in the beginning. This lets you get a real feel for their unique personalities—what makes their prices tick, their seasonal patterns, and their moments of high volatility. It’s much smarter than trying to be a master of all trades from day one.
The biggest mistake I see new traders make is trying to do too much, too soon. They bounce between a dozen markets and a handful of strategies, never really mastering any of them. Keep it simple. Focus is your best friend when you're starting out.
So, what's the number one trap to avoid? Trading without a plan. Every single move you make—when you buy, when you sell, and how much you risk—needs to be dictated by your strategy. That's what separates disciplined trading from just gambling.
Ready to trade with more confidence? EzAlgo provides AI-driven signals and automated tools to help you execute your strategy with precision. Ditch the guesswork and discover your edge at the official EzAlgo website.


%201.svg)