


In today's fast-paced markets, a reliable strategy is non-negotiable. But a strategy is only as strong as its components, and at the core of every successful trade are clear signals for when to get in and when to get out. That's where technical indicators come in. The real challenge isn't just finding indicators; it's finding the right ones. Many traders overload their charts with conflicting tools, leading to analysis paralysis and missed opportunities.
This guide cuts through that noise. We will break down seven of the best entry and exit indicators used by professional traders, from RSI to VWAP. For each tool, we'll cover its core function, how to interpret its signals for precise entries and secure exits, and its specific strengths and weaknesses.
More importantly, you will learn how to combine these classic indicators into a powerful, cohesive system. We'll provide actionable tips on how to integrate these tools, especially with advanced platforms like EzAlgo, to build a data-driven trading approach. This helps remove emotional guesswork, enhance your decision-making, and ultimately sharpen your trading edge. Let's dive in.
The Relative Strength Index (RSI) is a staple for traders looking to measure the speed and magnitude of price changes. Developed by J. Welles Wilder Jr., this momentum oscillator operates on a scale from 0 to 100. It helps identify when an asset might be overbought (typically above 70) or oversold (typically below 30), making it one of the best entry and exit indicators for gauging market extremes.
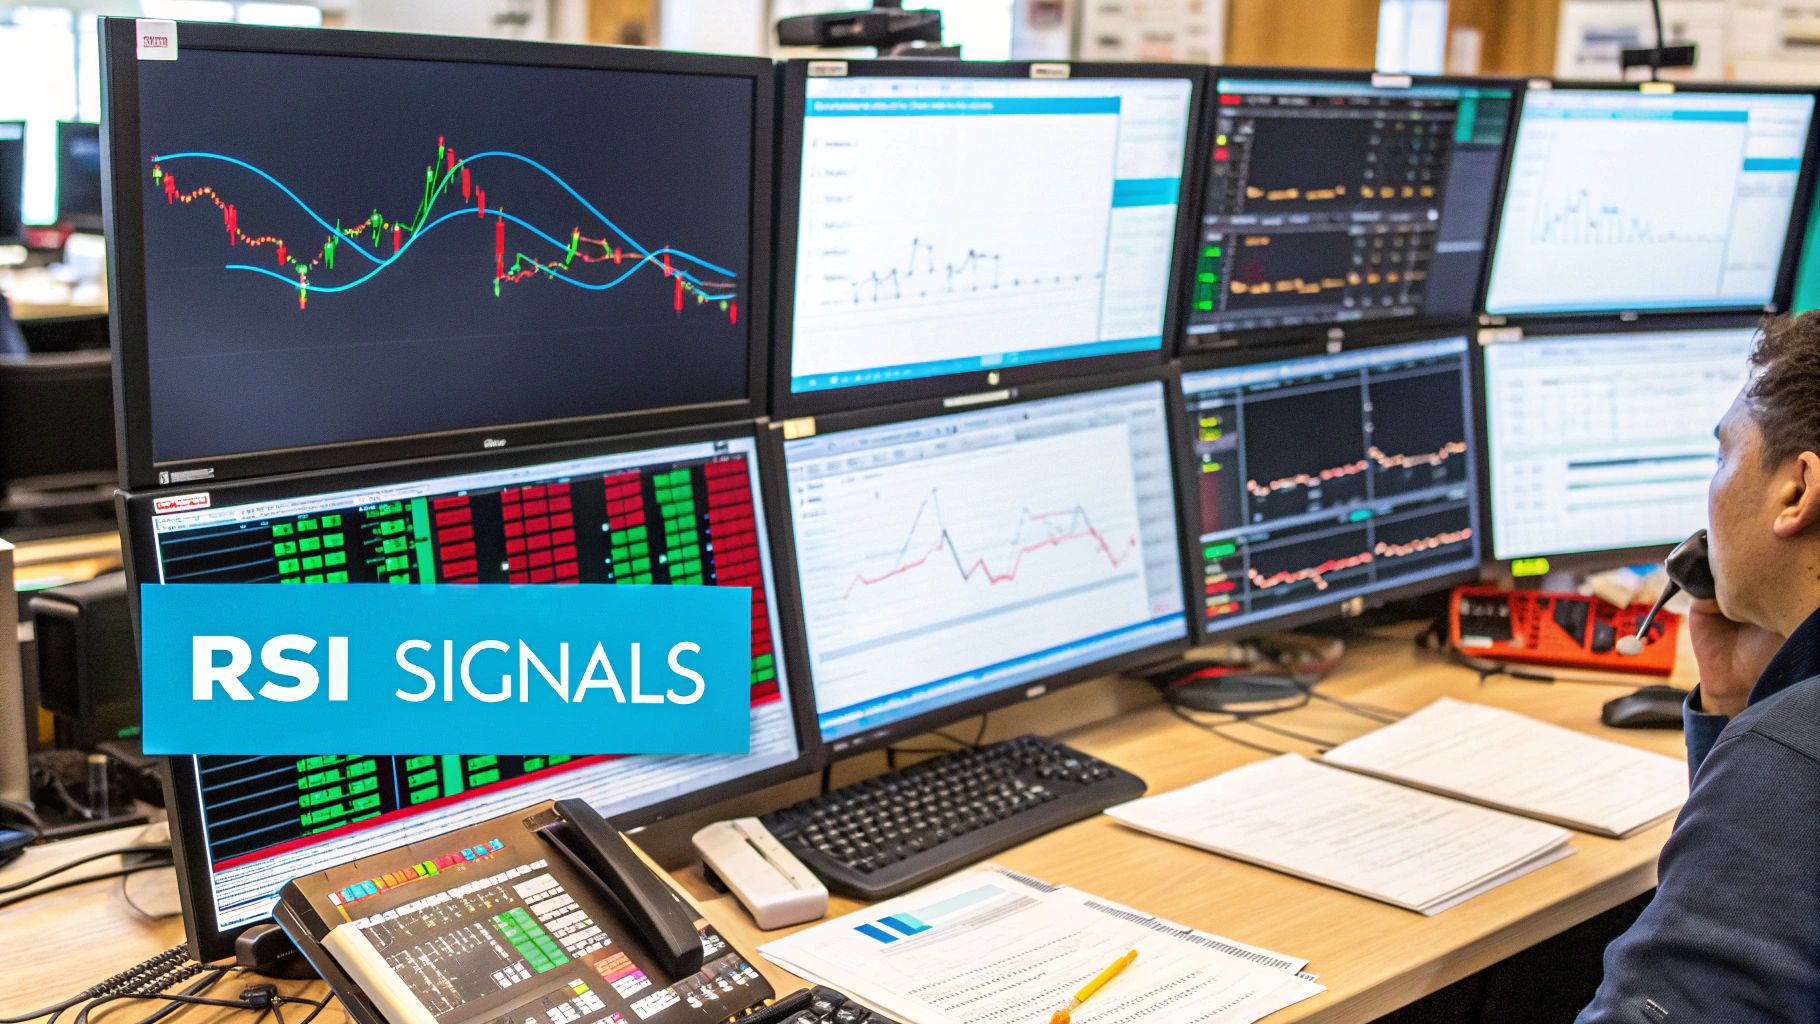
When the RSI moves above 70, it suggests that buying momentum is becoming exhausted, and the asset may be due for a pullback or reversal. Conversely, an RSI below 30 indicates that selling pressure may be drying up, presenting a potential buying opportunity.
RSI shines in its simplicity and versatility. It works across various markets, including stocks, forex, and crypto. For example, before its 2021 correction, Tesla (TSLA) stock consistently showed an RSI above 70, warning traders of its overbought status. Similarly, Bitcoin’s RSI dipped below 30 at its 2022 bear market bottom, signaling a prime accumulation zone for buyers.
However, its most powerful signals come from divergence.
Key Insight: When the price of an asset makes a new high but the RSI fails to do so, it creates a bearish divergence. This often precedes a significant price drop and acts as a powerful exit signal.
To effectively use the RSI as one of your primary entry and exit indicators, consider these strategies:
The Moving Average Convergence Divergence (MACD) is a classic trend-following momentum indicator that shows the relationship between two moving averages of a security's price. Created by Gerald Appel, it consists of the MACD line, a signal line, and a histogram. This trio works together to provide signals about trend direction, momentum, and potential entry or exit points.

When the MACD line crosses above the signal line (a "golden cross"), it signals bullish momentum and a potential buy opportunity. Conversely, a cross below the signal line (a "death cross") indicates bearish momentum and a possible exit or short-selling signal. The histogram visually represents the distance between these two lines, showing the strength of the momentum.
MACD excels at capturing trend momentum, making it one of the best entry and exit indicators for traders who want to ride trends. Its signals are clear and widely followed. For instance, Amazon (AMZN) showed a powerful MACD golden cross in early 2020, signaling the start of its massive pandemic-era rally. Similarly, a bullish crossover in Gold during 2019 preceded a major bull run that lasted well into 2020.
Like the RSI, the MACD's true strength is often found in divergence.
Key Insight: A bearish divergence occurs when the price action makes a new high while the MACD indicator makes a lower high. This suggests the underlying momentum is weakening and a reversal could be imminent, providing a strong exit signal.
To effectively integrate the MACD into your trading strategy, consider these powerful techniques:
Bollinger Bands are a powerful tool for measuring market volatility and identifying dynamic support and resistance levels. Created by John Bollinger, this indicator consists of a simple moving average (the middle band) and two outer bands set at a standard deviation above and below it. The bands expand when volatility increases and contract when volatility decreases, making them one of the best entry and exit indicators for adapting to real-time market conditions.

Prices tend to stay within the bands, so a touch of the upper band can signal an overbought condition, while a touch of the lower band can signal an oversold state. This provides clear potential entry and exit points based on mean-reversion principles.
The genius of Bollinger Bands lies in their dynamic nature. Unlike static support and resistance lines, they adjust automatically to market volatility. For example, during the 2021 GameStop (GME) short squeeze, the price repeatedly broke above the upper band, signaling extreme upward momentum. Conversely, during the March 2020 market sell-off, Netflix (NFLX) found strong support near its lower Bollinger Band, presenting a prime buying opportunity for traders anticipating a bounce.
The most anticipated signal, however, is the "squeeze."
Key Insight: When the bands contract tightly around the price, it signals a period of low volatility known as a squeeze. This often precedes a significant price breakout in either direction, giving traders a heads-up to prepare for a major move.
To master Bollinger Bands as one of your core entry and exit indicators, apply these practical strategies:
The Stochastic Oscillator is a momentum indicator that compares a particular closing price of a security to a range of its prices over a certain period of time. Developed by George Lane, it operates on a 0-100 scale, similar to the RSI, to identify overbought and oversold conditions. Its sensitivity to price momentum makes it one of the best entry and exit indicators, especially for timing trades in ranging or sideways markets.
When the oscillator reading moves above 80, it signals that an asset is potentially overbought and could be due for a price decline. Conversely, a reading below 20 suggests the asset is oversold and that buying pressure may soon resume, presenting a possible entry point.
The Stochastic Oscillator excels at identifying potential turning points with greater speed than many other oscillators. It's highly effective in markets that are not strongly trending, providing clear signals for swing traders. For instance, during Crude Oil’s range-bound trading in 2021, stochastic crossovers provided reliable entry and exit signals. Similarly, the indicator showed Microsoft (MSFT) in deep oversold territory just before its significant rally in 2020.
The indicator’s core strength lies in its responsiveness to recent price action.
Key Insight: The primary signal is the crossover. When the main %K line crosses above the signal %D line in the oversold area (below 20), it generates a potent buy signal. A crossover below the %D line in the overbought area (above 80) is a strong sell signal.
To integrate the Stochastic Oscillator into your trading system as one of your main entry and exit indicators, apply these strategies:
The Average True Range (ATR) is a pure volatility indicator, not a directional one. Developed by J. Welles Wilder Jr., the same mind behind the RSI, ATR measures how much an asset moves on average over a given period. It doesn't tell you which way the price is headed, but it is an indispensable tool for managing risk, making it one of the best entry and exit indicators for pragmatic traders.
ATR calculates the average of the "true ranges" over a specified number of periods, typically 14. A high ATR value signifies high volatility, meaning price is moving a lot. A low ATR indicates low volatility and smaller price swings.
ATR’s strength lies in its ability to adapt your strategy to current market conditions. It provides the context needed for setting realistic profit targets and, more importantly, protective stop-losses. For example, forex traders often use ATR to calculate their position size, ensuring they risk the same percentage of their account regardless of whether they are trading a volatile pair like GBP/JPY or a less volatile one like EUR/CHF.
Similarly, during major breakouts, an expansion in Bitcoin's ATR often confirms the strength of the move, giving traders more confidence to stay in the position.
Key Insight: ATR is not for finding entries; it's for managing your trade once you're in. It helps you set a stop-loss that respects the asset's normal volatility, preventing you from being stopped out by random market noise.
To effectively integrate ATR into your trading, making it one of your most valuable entry and exit indicators, consider these strategies:
The Volume Weighted Average Price (VWAP) is a powerful trading benchmark widely used by institutional traders and algorithms. It calculates the average price an asset has traded at throughout the day, weighted by volume. This makes VWAP a true representation of the asset's price, providing dynamic support and resistance levels that are critical for making informed trading decisions.
Unlike a simple moving average, VWAP places greater emphasis on price levels where heavier trading volume occurred. This distinction makes it one of the best entry and exit indicators for understanding where the "smart money" is positioned, helping day traders align their strategies with institutional activity.
VWAP's strength lies in its role as a fair value benchmark for a single trading session. Many institutional funds are judged by their ability to buy below the VWAP or sell above it. This self-fulfilling prophecy means the VWAP line often acts as a powerful magnet for price, making it a reliable level for entries and exits.
For example, on strong trending days, a stock like Apple (AAPL) or the S&P 500 futures (ES) will repeatedly pull back to the VWAP and find support before continuing its trend. A break and hold above the VWAP is often interpreted as a bullish signal for the day, while trading below it suggests bearish control.
Key Insight: When price reclaims the VWAP after a pullback, it signals a potential shift in intraday momentum. This VWAP reclaim is a high-probability entry signal, suggesting that buyers have absorbed the selling pressure and are ready to push the price higher.
To integrate VWAP effectively into your trading, consider these professional strategies:
Fibonacci retracement is a powerful tool used by traders to pinpoint potential support and resistance levels. Based on the key numbers in the sequence discovered by Leonardo Fibonacci, this indicator helps identify where a price might reverse or pause within a larger trend. By drawing horizontal lines at key levels-23.6%, 38.2%, 50%, 61.8%, and 78.6%-between a swing high and low, you can anticipate high-probability reversal zones.
This infographic summarizes the most critical retracement levels traders watch for potential entries and exits.
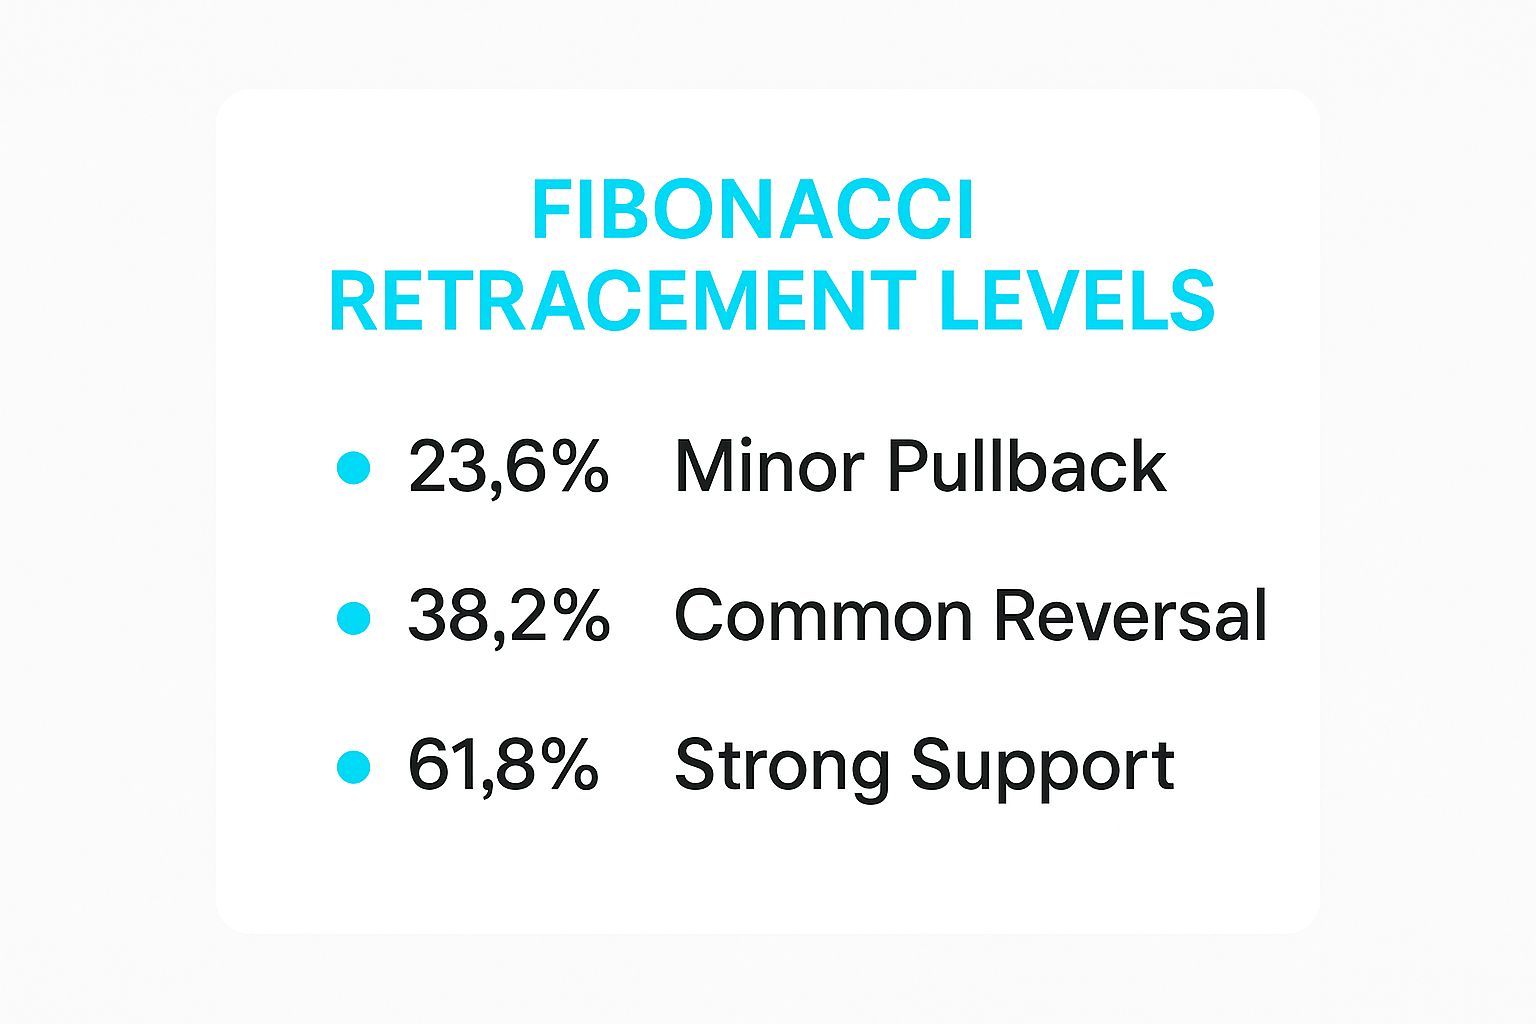
As shown, the 38.2% and 61.8% levels are often the most significant, representing common and strong areas where price action tends to react.
Fibonacci retracement stands out because it provides objective, predictable price levels where buying or selling pressure may emerge. These levels are watched by millions of traders, creating a self-fulfilling prophecy. For instance, during its 2020 bull market, Gold frequently found strong support at the 61.8% retracement level after pullbacks, offering precise entry points. Similarly, the S&P 500 faced significant resistance at the 50% retracement level during its 2022 bear market rally.
It’s one of the best entry and exit indicators because it helps you distinguish a minor pullback from a full trend reversal.
Key Insight: The area between the 38.2% and 61.8% levels is often called the "golden pocket." When price enters this zone and finds support, it frequently signals a high-probability continuation of the primary trend.
To effectively use Fibonacci levels as one of your core entry and exit indicators, apply these strategies:
Throughout this guide, we've explored a powerful arsenal of the best entry and exit indicators, from the momentum-gauging RSI and MACD to the volatility-measuring Bollinger Bands and ATR. We’ve seen how each tool offers a unique lens through which to view market dynamics, providing critical clues about potential reversals, trend strength, and optimal profit-taking zones. You now understand how to spot divergence on the Stochastic Oscillator, identify key support with Fibonacci Retracement, and gauge institutional interest using VWAP.
But knowledge alone isn't the final destination; it's the starting point. The true challenge for any trader lies in synthesizing these individual signals into a coherent, actionable strategy. Manually juggling multiple indicators across different assets and timeframes is not just mentally taxing; it's a process where emotional biases and missed opportunities can easily creep in. A perfect setup on one indicator can be invalidated by another, and spotting these confluences in real-time requires immense focus and discipline.
The transition from a good trader to a great one often hinges on moving from manual analysis to a systematic, integrated approach. The core principle is confluence, the idea that high-probability trade setups occur when multiple, non-correlated indicators align to tell the same story.
This is precisely where automation becomes a game-changer. Instead of constantly scanning charts for these rare moments of perfect alignment, you can leverage a tool that does the heavy lifting for you. This is the core philosophy behind EzAlgo. It's not about replacing your trading knowledge but amplifying it.
EzAlgo automates the complex task of finding these high-probability confluences. Its advanced algorithms are designed to process signals from foundational indicators like the ones we've discussed, presenting them as simple, unified, and non-repainting buy or sell signals directly on your chart. It automatically draws key support and resistance levels, identifies bullish and bearish divergences, and flags reversal patterns, saving you countless hours of manual chart work. By integrating the timeless principles of these classic indicators into a sophisticated, AI-driven framework, you can elevate your decision-making, reduce emotional errors, and approach every trade with data-backed confidence.
Ready to stop guessing and start trading with precision? See how EzAlgo combines the power of the world's best entry and exit indicators into one simple, automated system. Transform your trading strategy with EzAlgo today.


%201.svg)