


Navigating the financial markets without a clear strategy is like sailing without a compass. The key to successful trading isn't just about knowing what to trade, but precisely when to enter and exit a position. This is where technical indicators become indispensable tools in a trader's arsenal. They transform complex price action and market sentiment into simplified, visual signals, helping you make informed decisions rather than emotional ones. Finding the best entry and exit indicators for your specific trading style can dramatically improve your consistency and profitability.
This guide cuts straight to the point. We will break down eight of the most effective and widely used indicators for pinpointing optimal trade opportunities. You will learn not only what each indicator does but also how to interpret its signals for both entering and exiting trades. We'll explore their individual strengths, weaknesses, and practical applications across different markets like crypto, forex, and stocks. For those looking to elevate their strategy, we will also provide actionable tips on how to integrate these classic indicators with advanced tools like the EzAlgo suite, creating a more robust and comprehensive trading system. Forget guesswork; it's time to build a data-driven approach.
The Moving Average Convergence Divergence (MACD) is a cornerstone momentum indicator for traders worldwide. Created by Gerald Appel in 1979, it highlights the relationship between two exponential moving averages (EMAs) of an asset's price, making it one of the best entry and exit indicators for identifying trend strength and potential reversals. It’s not just an indicator; it’s a complete system packaged into one tool.
The MACD consists of three primary components that work together to generate signals. Understanding each part is crucial for effective implementation.
This infographic provides a quick reference for the three core elements of the MACD indicator.
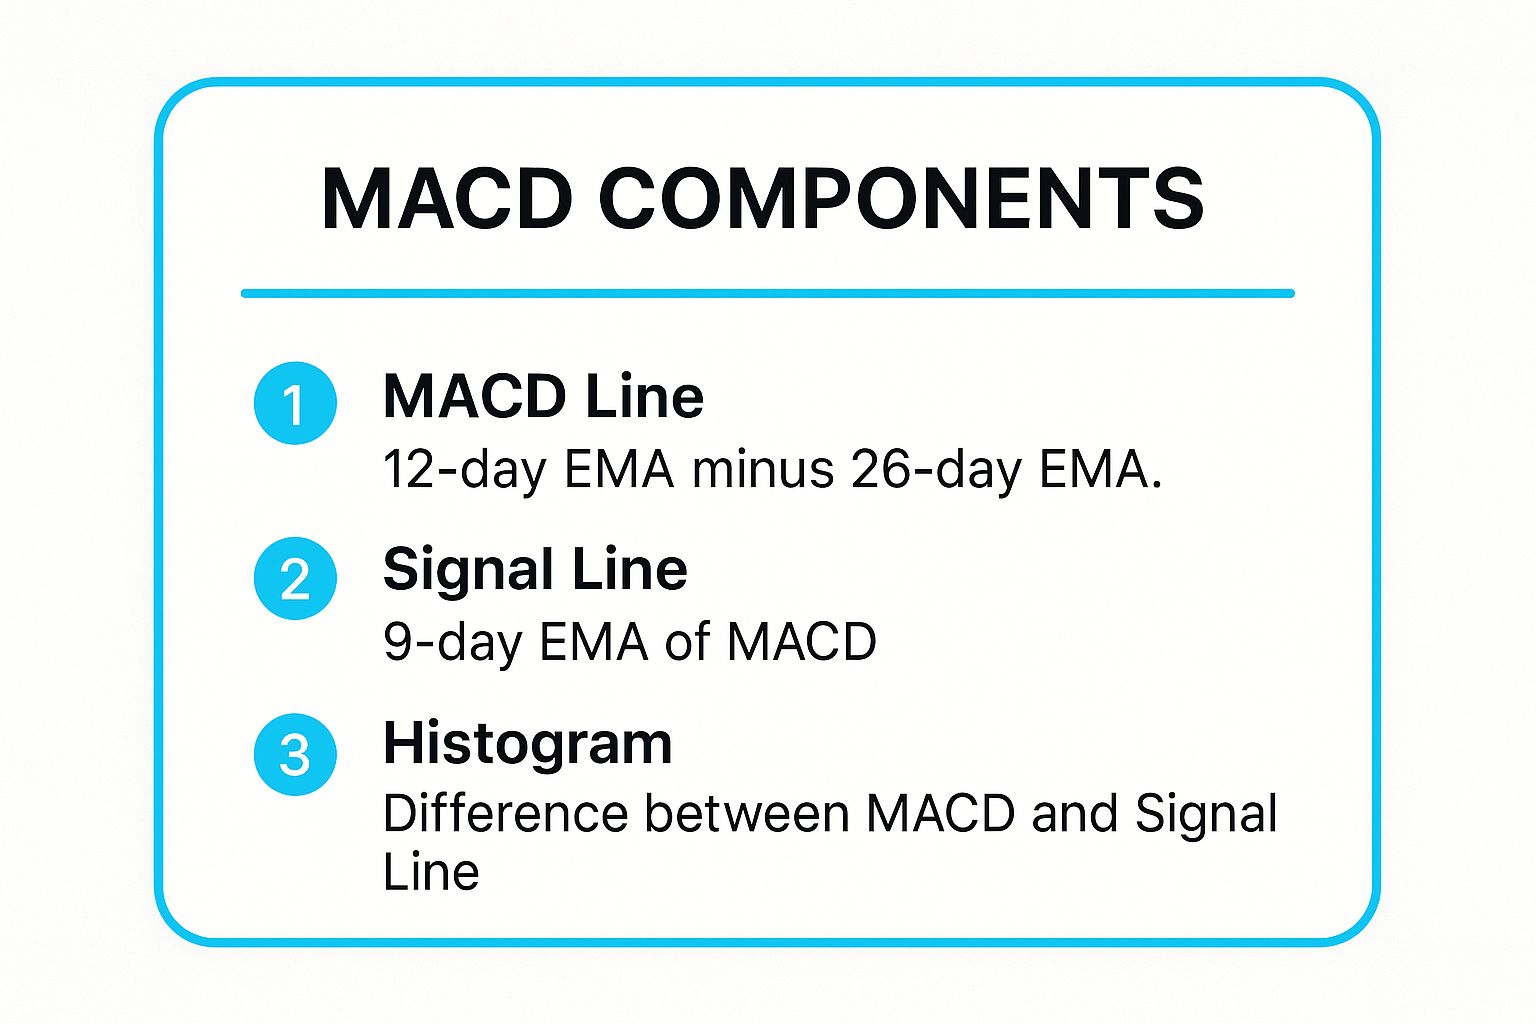
These three elements provide a comprehensive view of market momentum, direction, and potential turning points.
The most common entry signal is a bullish crossover, where the MACD line crosses above the signal line, suggesting upward momentum is building. Conversely, an exit or short-entry signal occurs when the MACD line crosses below the signal line (a bearish crossover).
For example, the sharp recovery of Apple (AAPL) stock after the March 2020 crash was preceded by a clear bullish MACD crossover on the daily chart, signaling a powerful new uptrend.
Here are some actionable tips for using the MACD:
Key Insight: MACD is not just for crossovers. Its real power lies in identifying divergences, which often precede major trend changes, giving you an edge in timing your entries and exits. For a deeper dive into this concept, you can learn more about momentum trading strategies here.
The Relative Strength Index (RSI) is a powerful momentum oscillator that has remained one of the best entry and exit indicators since its creation by J. Welles Wilder Jr. in 1978. It measures the speed and change of price movements on a scale of 0 to 100, helping traders identify overbought or oversold conditions. Its straightforward nature makes it an essential tool for gauging market sentiment and timing reversals.
The RSI provides a clear visual representation of momentum. By tracking its value relative to key levels, traders can quickly assess whether an asset's price has moved too far, too fast, signaling a potential pullback or bounce.
The RSI calculation is based on the average gains and average losses over a specified period, typically 14. The core of its application revolves around three key zones:
These simple levels provide an immediate and effective framework for making trading decisions.
The most common entry signal is when the RSI moves out of the oversold territory (crossing above 30), suggesting that selling pressure is waning and buyers are stepping in. Conversely, an exit or short-entry signal occurs when the RSI falls from the overbought region (crossing below 70).
For example, during the 2022 decline in EUR/USD, multiple successful long entries could have been timed by buying when the RSI on the daily chart bounced from oversold levels below 30.
Here are some actionable tips for using the RSI:
Key Insight: Don't just use RSI for overbought and oversold levels. Its true strength often lies in identifying divergences. A divergence signals that the underlying momentum does not support the price trend, often providing an early warning of a major market turn.
Developed by John Bollinger in the 1980s, Bollinger Bands are a volatility-based indicator that provides a dynamic framework around an asset's price action. They consist of a central Simple Moving Average (SMA) and two outer bands set at a standard deviation above and below it. This makes them one of the best entry and exit indicators for gauging market volatility and identifying overbought or oversold conditions.

The bands expand when volatility increases and contract when it decreases, offering a powerful visual representation of the current market state.
The indicator is built on three lines that adapt to price movements and volatility.
These components work in tandem to frame the price, with touches of the outer bands often signaling potential turning points or continuation patterns.
A common entry signal is when the price touches the lower band during an uptrend, suggesting a potential bounce. Conversely, an exit signal can occur when the price reaches the upper band, indicating the move may be overextended.
For example, during the Brexit-induced volatility, GBP/USD frequently touched the upper and lower bands, providing clear short-term entry and exit points for range traders. Similarly, Crude Oil often respects the bands as dynamic support and resistance levels.
Here are some actionable tips for using Bollinger Bands:
Key Insight: Bollinger Bands excel at contextualizing price action. They don't just tell you where the price is; they tell you where it is relative to recent volatility. This makes them incredibly versatile for identifying both trend continuations and potential reversals.
The Stochastic Oscillator is a classic momentum indicator developed by George Lane in the 1950s. It operates on the principle that as prices rise, closing prices tend to be closer to the high of the price range. Conversely, in a downtrend, closing prices tend to be near the low. This indicator compares a security's closing price to its price range over a specific period, making it one of the best entry and exit indicators for identifying overbought and oversold conditions.
The oscillator consists of two lines, %K and %D, that fluctuate between 0 and 100. The %K line is the primary calculation, while the %D line is a simple moving average of %K, acting as a smoothing mechanism to generate more reliable signals.
The core idea is to measure momentum by tracking where the close is in relation to the recent high-low range.
These components work together to provide clear signals about market momentum and potential reversal points.
The most common entry signal is a bullish crossover in the oversold territory (below 20), where the %K line crosses above the %D line. This suggests that downward momentum is fading. An exit or short-entry signal occurs with a bearish crossover in the overbought zone (above 80).
For example, Forex traders often use the Stochastic Oscillator on hourly charts to time EUR/JPY entries, waiting for a clear bullish crossover below the 20 level during a broader uptrend to join the move.
Here are some actionable tips for using the Stochastic Oscillator:
Key Insight: The Stochastic Oscillator is most effective in ranging or choppy markets. In strong, trending markets, it can remain in overbought or oversold territory for extended periods, giving false signals. Always confirm its signals with the broader market trend.
The Parabolic Stop and Reverse (SAR) is a unique trend-following indicator developed by the legendary J. Welles Wilder Jr. It provides dynamic entry and exit points, making it one of the best entry and exit indicators for traders who want clear, visual signals. The indicator plots a series of dots either above or below the price, creating a parabola-like curve that trails the trend.
The Parabolic SAR is designed not only to identify the current trend direction but also to provide a trailing stop-loss level. Its primary function is to help traders stay in a trend for as long as it is profitable and exit as soon as it shows signs of reversing.
The indicator’s logic is straightforward: when the dots are below the price candles, it signals a bullish uptrend. When the dots appear above the price candles, it indicates a bearish downtrend. A signal to enter or exit is generated when the price touches a dot, causing the indicator to "flip" to the other side of the price action. This flip signals a potential trend reversal.
The sensitivity of the SAR can be adjusted via its acceleration factor, allowing traders to fine-tune it for different market conditions and volatility levels.
A common entry signal occurs when the SAR dots flip from above the price to below it, suggesting a new uptrend has begun. Conversely, an exit or short-entry signal is generated when the dots flip from below the price to above it, indicating a potential downtrend.
For instance, during its major bull runs, Bitcoin’s daily chart often shows the Parabolic SAR providing excellent trailing stop-loss levels, allowing traders to capture the majority of the upward move while protecting profits. Similarly, Netflix (NFLX) stock showed clear trend changes using the SAR during its volatile periods in 2021.
Here are some actionable tips for using the Parabolic SAR:
Key Insight: The Parabolic SAR excels at keeping you in a trade during a strong, sustained trend. Its ability to provide an objective, emotion-free exit point prevents you from closing a profitable position too early. For more on managing trades effectively, you can explore advanced position management techniques here.
The Average True Range (ATR) is a pure volatility indicator, not a directional one. Developed by the legendary J. Welles Wilder Jr. in 1978, it measures market volatility by calculating the average of "true ranges" over a specified period. This makes it one of the best entry and exit indicators for risk management, helping traders adapt their strategies to changing market conditions.
The ATR doesn't tell you which way the price will go, but it powerfully informs you how much it might move. This is critical for setting realistic stop-losses and profit targets based on the market's current character.
The ATR calculation is based on the "true range," which is the greatest of the following three values:
The indicator then smooths these values, typically over 14 periods, to create a single line representing average volatility. A rising ATR signifies increasing volatility, while a falling ATR indicates a quieter, contracting market.
While ATR isn't used for entry signals on its own, it is indispensable for managing trades once you are in them. Its primary function is to help with position sizing and stop-loss placement, preventing you from being stopped out by normal market noise.
For instance, a forex trader might notice the ATR on EUR/USD is 50 pips. They can then set a stop-loss at 2x ATR (100 pips) from their entry to allow the trade room to breathe. This dynamic approach is far more effective than using a fixed-pip stop-loss across all market conditions.
Here are some actionable tips for using the ATR:
Key Insight: ATR's value is in its adaptability. It forces you to think in terms of market volatility, not just price points. By basing your risk parameters on the ATR, you align your strategy with the market's current behavior. To explore this concept further, you can learn more about volatility trading strategies here.
Fibonacci Retracements are a powerful method for identifying potential support and resistance levels. Derived from the famous Fibonacci sequence, these horizontal lines are drawn between significant swing highs and lows to pinpoint where a price pullback might end and the primary trend could resume. This makes them one of the best entry and exit indicators for traders who want to capitalize on corrections within a larger trend.
These levels, based on key ratios like 23.6%, 38.2%, 50%, 61.8%, and 78.6%, act as invisible zones of interest where market psychology often shifts, providing clear, predictive areas for placing orders.
This chart illustrates how Fibonacci Retracement levels are drawn on a price chart to identify potential reversal zones during a pullback.

Each percentage level represents a potential area where the price may find support in an uptrend or resistance in a downtrend.
The primary use of Fibonacci Retracements is to identify entry points during a market correction. After a strong price move, traders watch for the price to pull back to one of the key Fibonacci levels before entering in the direction of the original trend. For example, during its 2020 recovery, the S&P 500 repeatedly found significant support at the 38.2% retracement level, offering multiple buying opportunities.
Similarly, Fibonacci extension levels (like 127.2% and 161.8%) can be used as profit targets, indicating where the price might travel after breaking its previous high or low.
Here are some actionable tips for using Fibonacci Retracements:
Key Insight: Fibonacci levels are not just lines on a chart; they are reflections of market psychology. The real predictive power emerges when multiple levels from different swings cluster in the same price area, creating a "Fibonacci cluster" that acts as a powerful support or resistance zone.
The Volume Weighted Average Price (VWAP) is a powerful intraday benchmark used extensively by institutional traders and day traders alike. Unlike a simple moving average, VWAP incorporates volume into its calculation, revealing the true average price of an asset for a given trading session. This makes it one of the best entry and exit indicators for gauging intraday market sentiment and identifying fair value.
VWAP is calculated by taking the total dollar value of all trading activity and dividing it by the total shares traded over the period. It appears as a single line on the chart, resetting at the start of each new trading day.
VWAP acts as a dynamic reference point that helps traders determine the underlying trend relative to trading volume. Its position relative to the current price provides immediate, actionable insights into market control.
The VWAP line itself often serves as a dynamic level of support or resistance, where price action tends to react.
The most straightforward entry signal is when the price crosses above the VWAP line, signaling a potential long position. An exit or short-entry signal occurs when the price breaks below VWAP, suggesting a shift to bearish momentum.
For example, day traders often wait for a stock to pull back to the VWAP line during an uptrend. A bounce off the VWAP confirms bullish strength and provides a low-risk entry point. Scalpers use these same bounces for quick, high-probability trades.
Here are some actionable tips for using the VWAP:
Key Insight: VWAP is more than just a crossover tool; it is a benchmark for fair value. Institutions use it to execute large orders with minimal market impact, making it a self-fulfilling prophecy. Retail traders can leverage this by treating VWAP as a "magnetic" level of institutional interest.
Navigating the financial markets without a clear strategy for entering and exiting trades is like sailing without a compass. Throughout this guide, we've explored a powerful arsenal of technical tools, from momentum oscillators like the RSI and Stochastic to trend-following indicators like the MACD and Parabolic SAR. Each one offers a unique lens through which to view market dynamics, helping you pinpoint potential opportunities and manage risk effectively.
We’ve seen how Bollinger Bands can define dynamic support and resistance, how VWAP provides an institutional benchmark for price, and how Fibonacci retracements highlight hidden levels of psychological significance. The key takeaway is that no single indicator holds all the answers. The true power lies in confluence, the art of combining these tools to build a robust, multi-faceted trading system that confirms your trade theses from several angles.
Mastering the best entry and exit indicators is not about memorizing formulas; it's about understanding the market story each one tells. Your journey from here should be one of practice, testing, and refinement.
The goal is to move beyond simply reacting to signals and start anticipating market movements with confidence. By diligently applying these concepts, you transform indicators from confusing lines on a chart into a clear roadmap for your trading decisions. This disciplined approach is what separates consistently profitable traders from the crowd, providing you with the structure needed to navigate even the most volatile market conditions with clarity and purpose.
Ready to take the guesswork out of finding these crucial signals? EzAlgo integrates the principles of many of the best entry and exit indicators into a streamlined, all-in-one toolkit directly on your TradingView chart. Get clear, AI-driven buy and sell signals, automatic support and resistance levels, and real-time divergence alerts to supercharge your analysis by visiting EzAlgo today.


%201.svg)